
“99% accuracy” seems to say it all. Until we ask: accuracy at measuring what?
In Nobody Is Talking About This. (September 1, 2026, published under the name Wizard of Ops), the author challenges the use of Cboe Open-Close data to reconstruct dealer positioning and proposes a method that infers the side of the trade from prices instead. Our response starts with what the data actually records.
Our standard is simple: the limitations of a dataset do not prove that an alternative model is superior. That requires a comparison.
DeepGamma uses licensed Cboe data, combining classified flows, prices, and volatility. In our August webinar, we put it in one sentence: The industry estimates the side. We read it.

The 99%: a claim to understand, not a number to applaud
The service recommended in the article is described in Jason D. DeLorenzo’s white paper, Impact of option dealer flows on equity returns, dated December 19, 2023. The document claims accuracy above 90% across expirations and 99% for 0DTE options, based on a comparison with Cboe’s SPX data. It calls that data “the definitive answer.” Which Cboe information validated the method, and which is now considered insufficient? That distinction needs explaining.
But 99% of what: position signs, classified executions, or reconstructed quantities? Within what tolerance? Across how many observations, and over what validation period?
The published explanation does not specify the operational definition of accuracy, the tolerance, the number of observations, or the comparison period. High correlation, a small error in the aggregate, and good accuracy for each contract are different results.
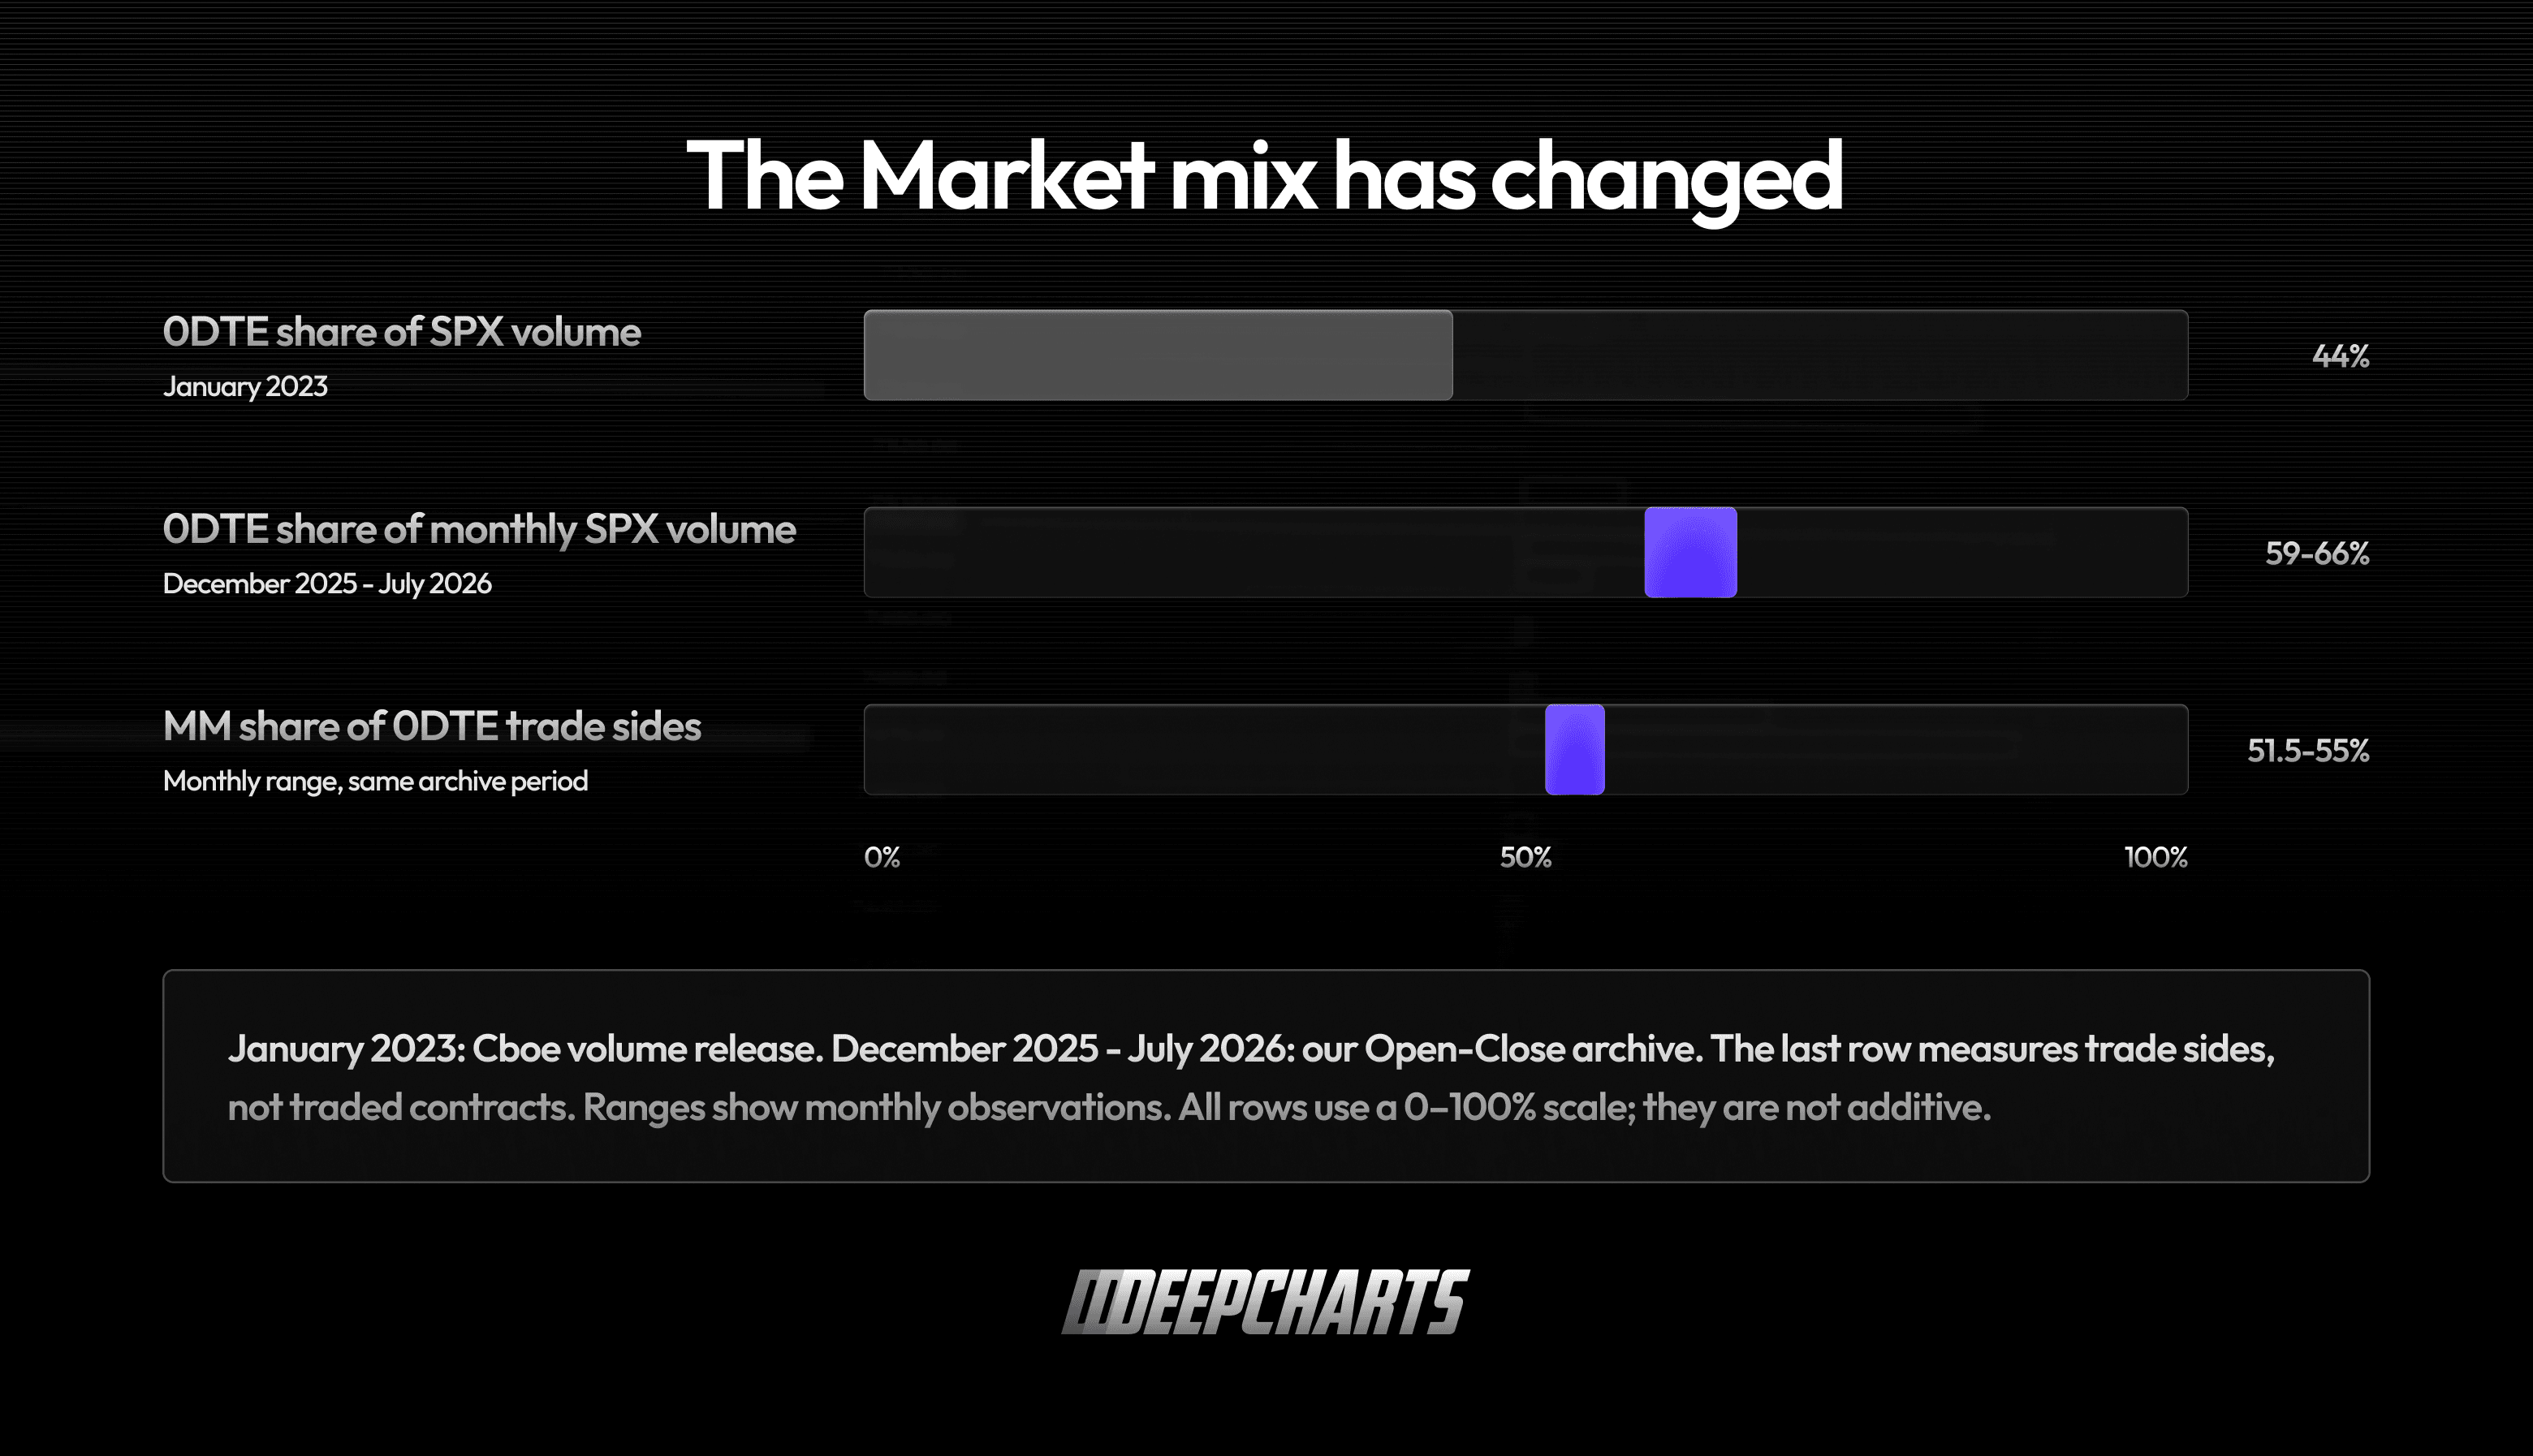
Then there is the date, which matters most of all. The comparison is undated. The document’s return studies use data from 2018–2022 and 2023; it does not identify the sample used for the 99% test. Meanwhile, the market has changed. According to Cboe, 0DTE accounted for 44% of SPX volume in January 2023. In our archive, from December 2025 through July 2026, they account for 59% to 66% of monthly volume. Cboe volume release.
Who trades them changes too: over the same period, the share of 0DTE trade sides attributed to market makers varies month by month between 51.5% and 55%. A price-based classifier’s accuracy is not a property of the algorithm alone: it is a property of the algorithm in a particular market.
A 99% result measured no later than 2023, without a date or a metric, describes a different market from today’s. What validation documents that this accuracy has been maintained? In the public materials we examined, none. And on page 19, the document itself argues that most 0DTE trades take place between dealers. How does that 99% change between dealer–customer and dealer–dealer trades? Without separate results, we do not know where the method works and where it gets things wrong. Anyone selling accuracy in a market whose size and composition have changed over three years would revalidate it over time—and say so. Here, there is just one number, and it has no date.
The chosen reference matters too. The document speaks of “dealers,” a role, and acknowledges that the term is not “exactly synonymous” with market maker; on page 19, it suggests that some of those its system classifies as customers may actually be dealers. Cboe records categories. Which definition of dealer was compared with which Cboe categories, and does it match the definition used by the product? Without that mapping, what does the 99% certify? Those who have the category talk about categories; those who infer it talk about roles.
Validation on SPX is not a certificate that transfers to other underlyings, either. Applying a method to many instruments and having verified its accuracy on each are two different things: the first is a claim; the second requires documentation.
Explaining the test does not require giving away the algorithm. It requires saying what was measured.
Who buys and who provides liquidity are two different questions
A market maker can buy by accepting someone else’s price or by posting a price that another participant accepts. In the first case, it takes liquidity; in the second, it provides it. In both cases, it buys.
Open-Close records quantities bought and sold by participant category, option series, and interval. In the files we use, it also distinguishes opening and closing trades for non-market-maker categories. It does not identify every participant or the aggressor in each execution. Cboe dataset documentation.
A category does not determine a role. A role does not erase a quantity.
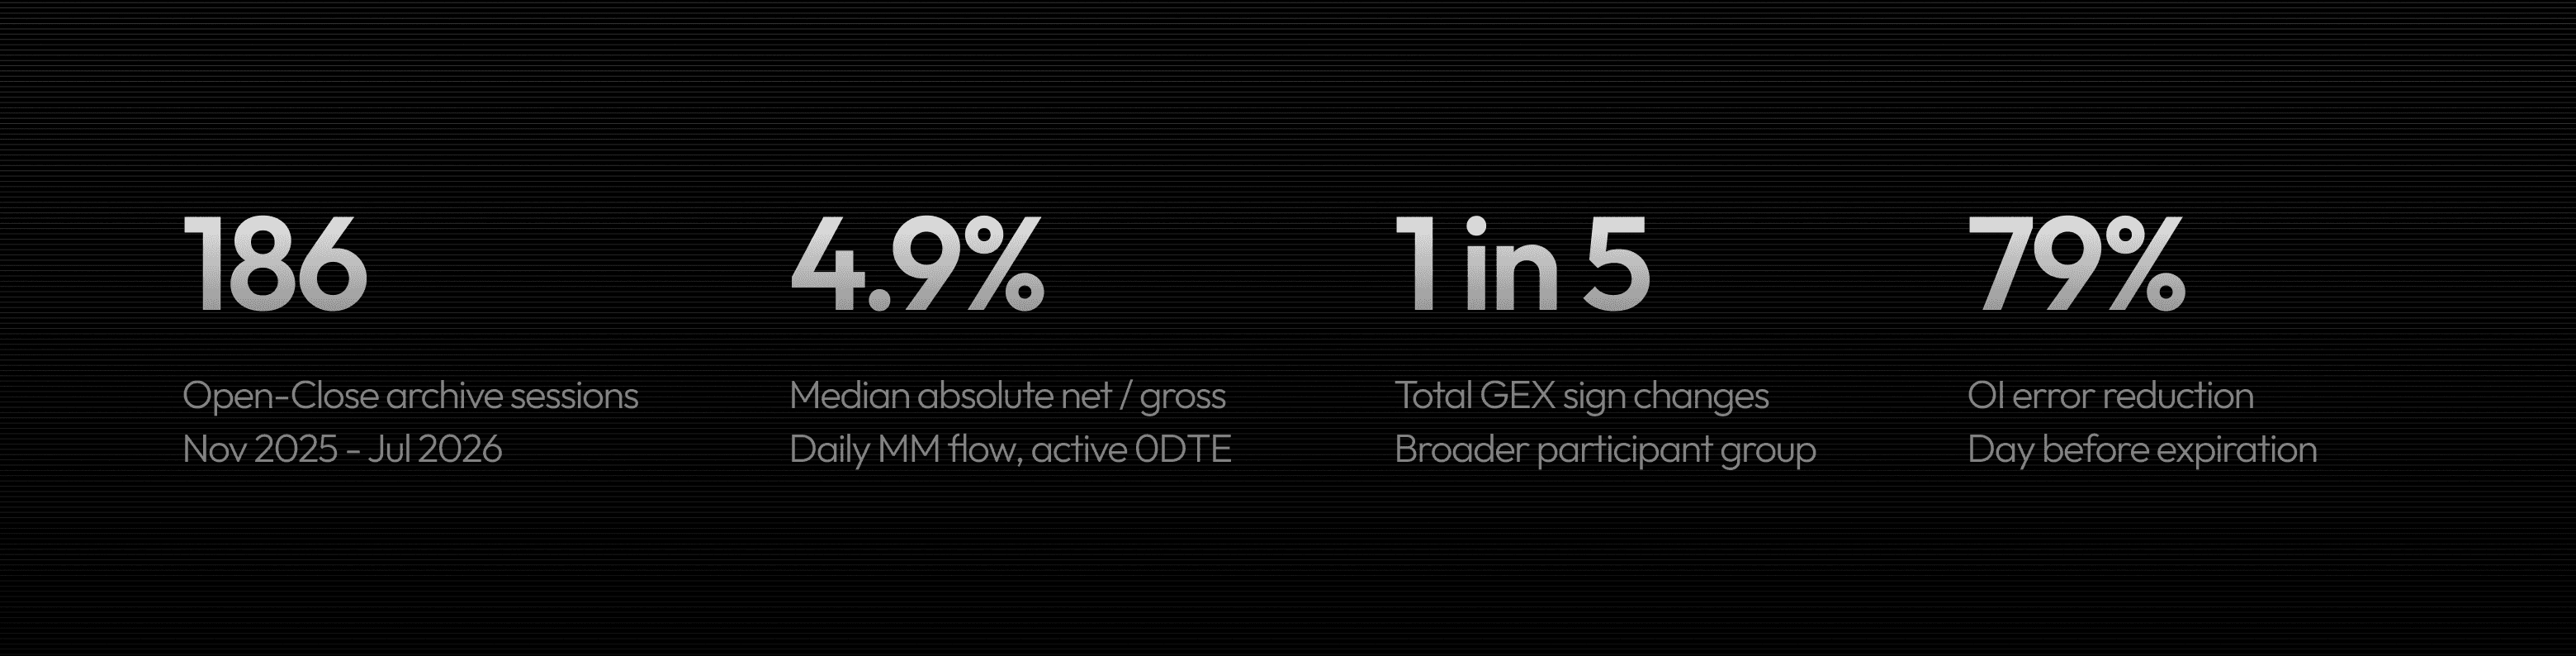
And before deciding which side the market maker is on, we need to check whether one is there at all. Every day in our 186-session archive contains series and intervals with trades but not a single contract attributed to the market-maker category.
One example from the file: the 09:40 bucket on January 13, 2026, for the SPX 6625 put expiring that day. Customers bought 300 contracts to open; professional customers sold 300 contracts to open. Market-maker purchases and sales: zero.
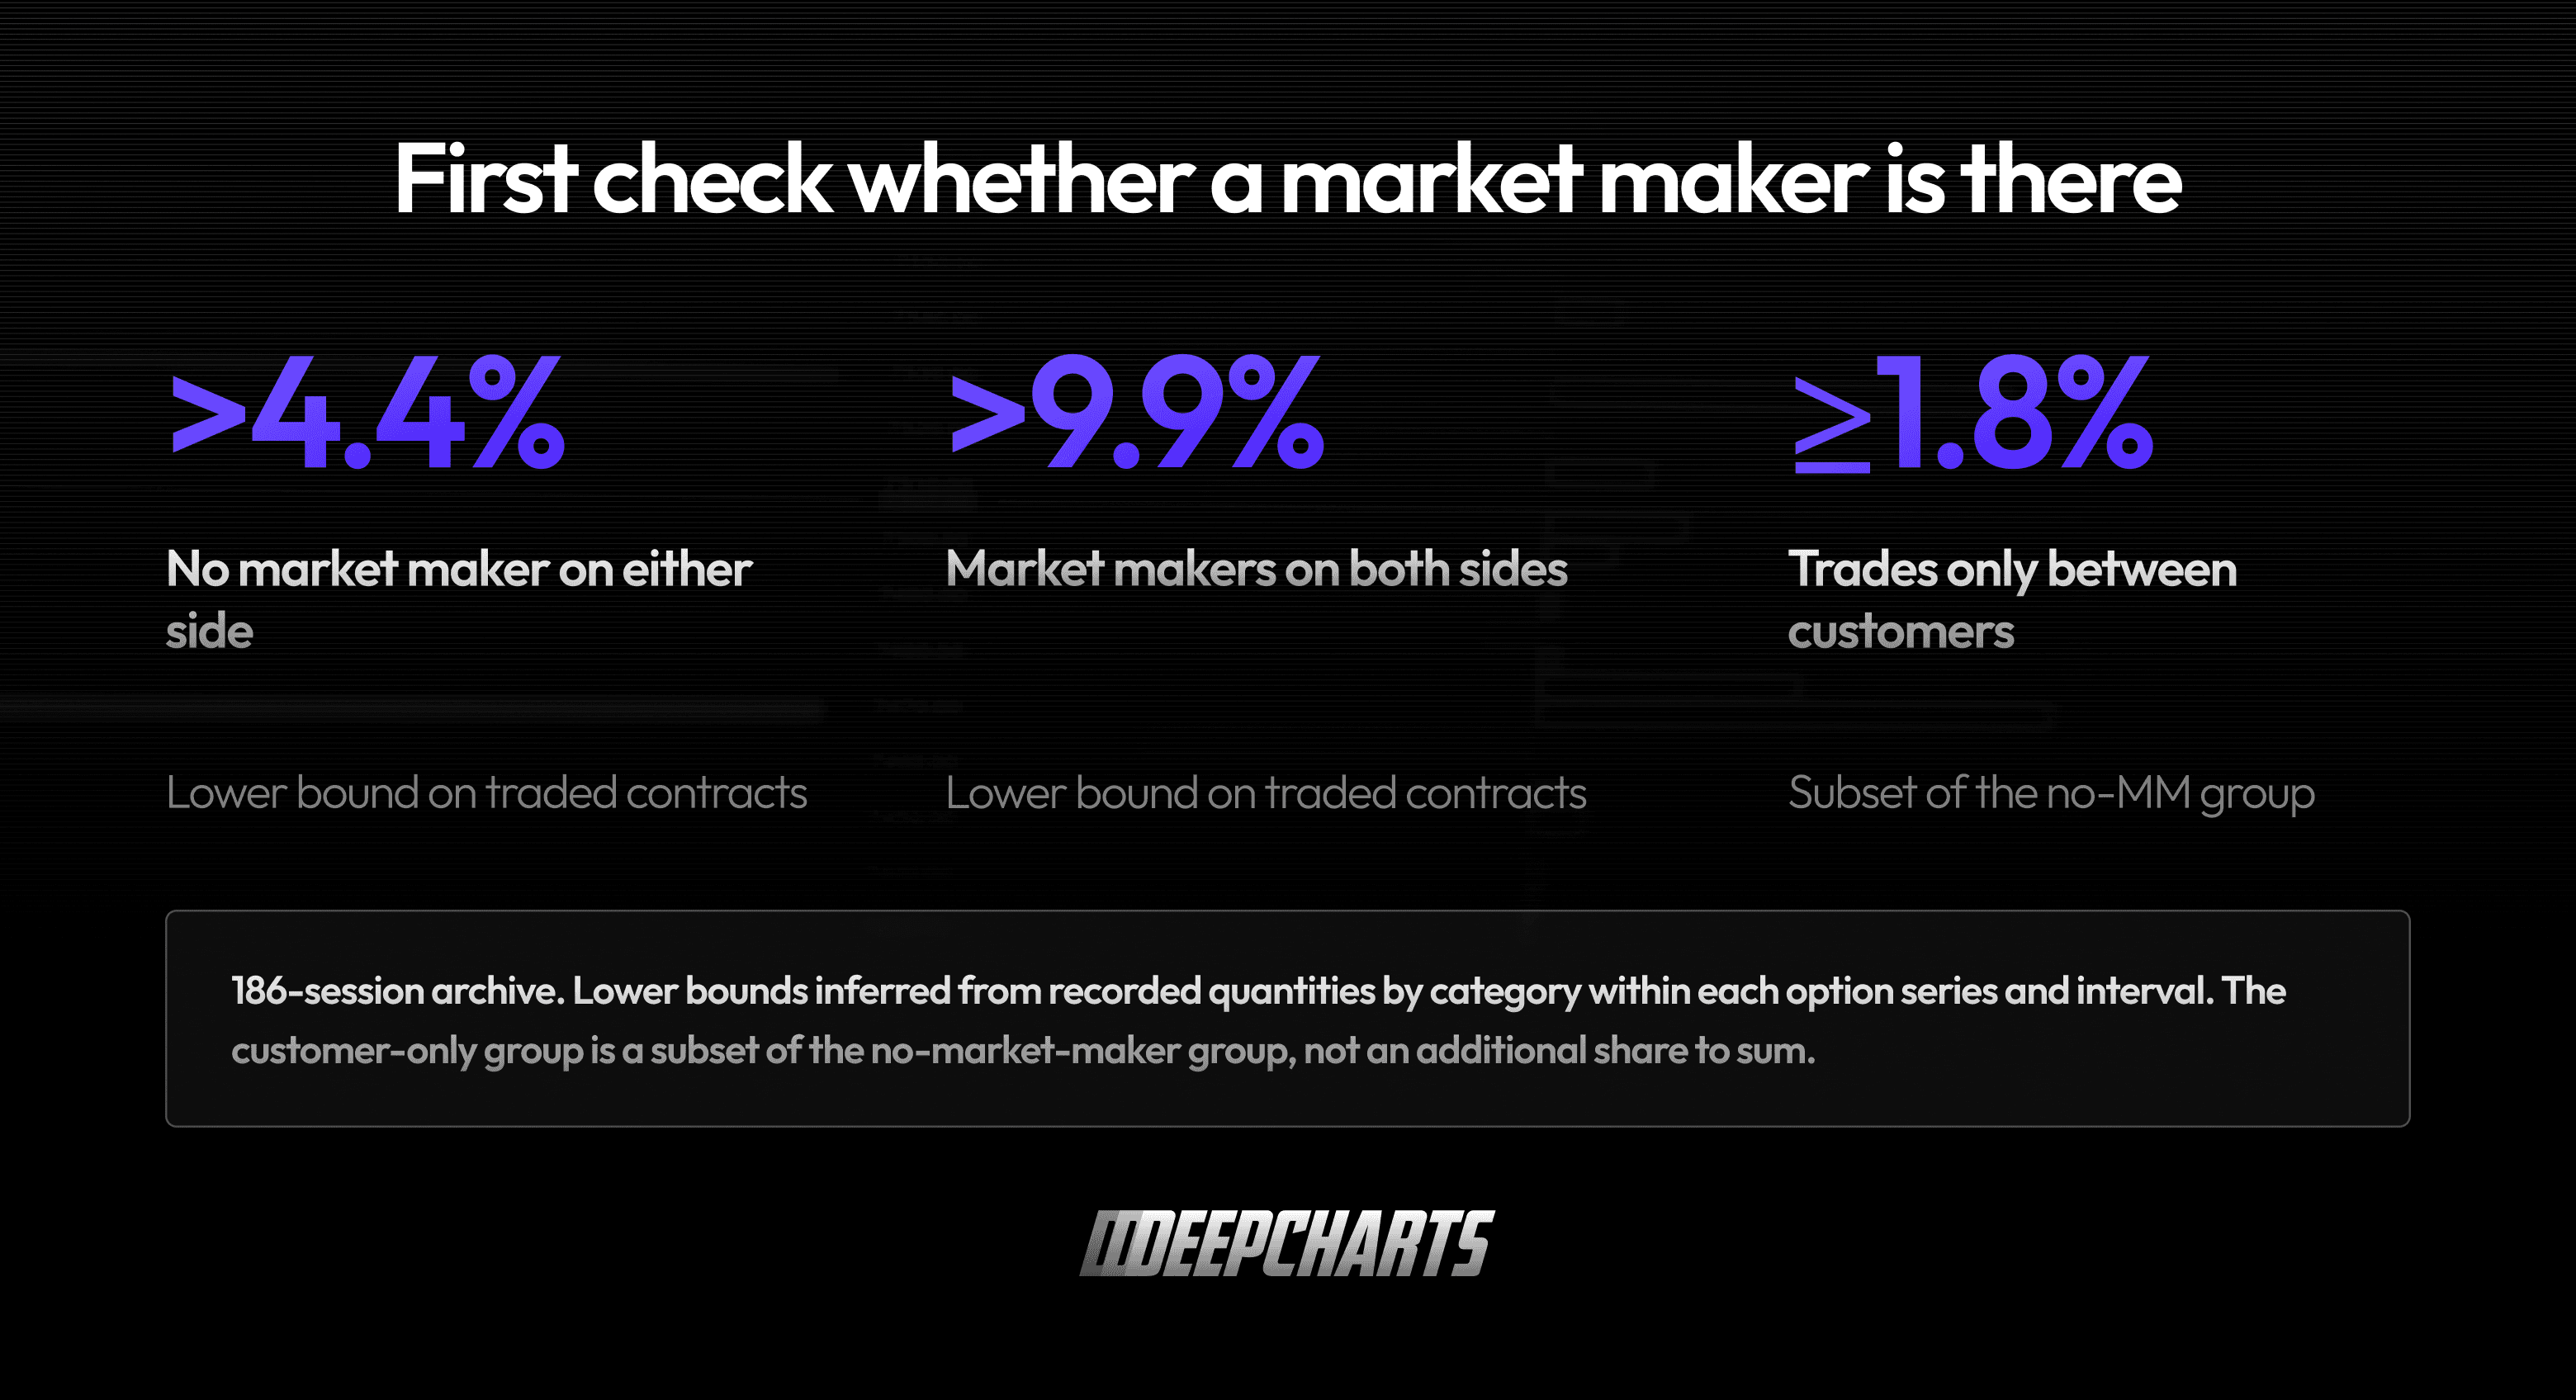
Across the entire archive, more than 4.4% of traded contracts have no market maker on either side, more than 9.9% have one on both sides, and at least 1.8% trade only between customers, with no market maker, firm, or broker-dealer involved. These are lower bounds derived from the quantities recorded by category in each series and interval.
Automatically assigning one of those sides to the market-maker category means attributing a flow to it that the file does not record. An inference-based method must demonstrate how it handles these cases and with what error.
Small errors in gross flows can become large errors in the map
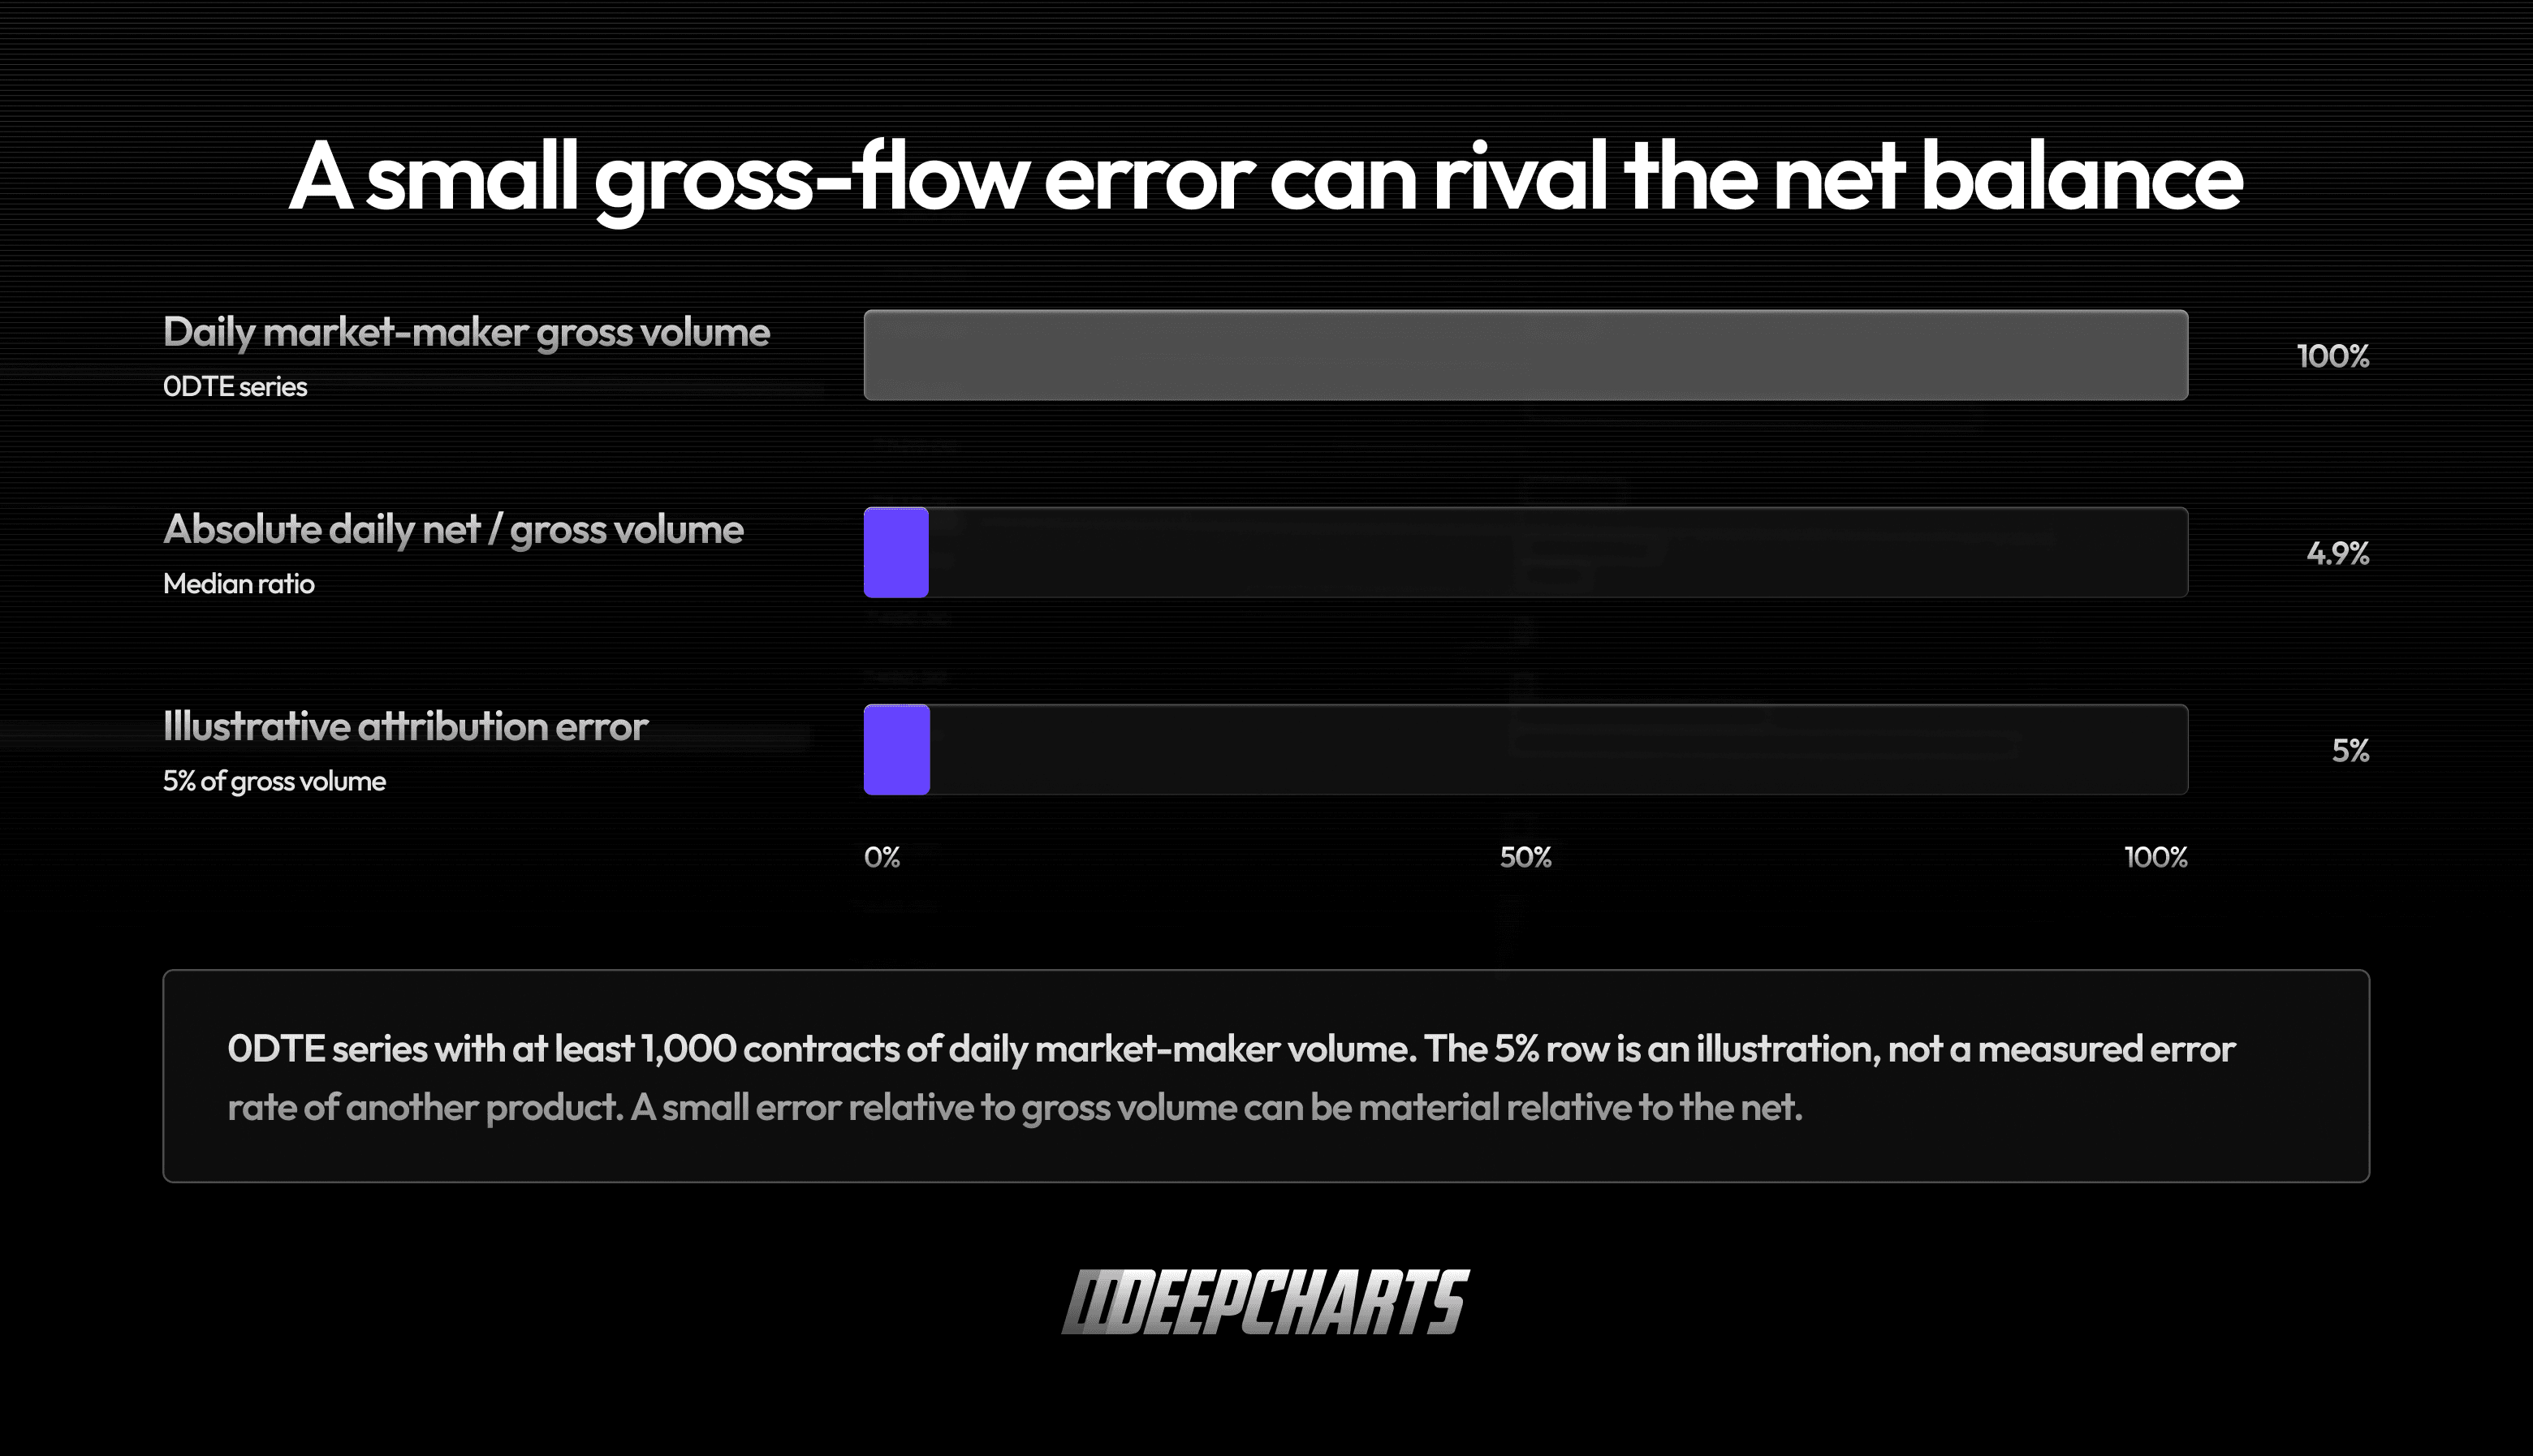
For 0DTE series with at least 1,000 contracts of daily market-maker volume, the median ratio of absolute daily net flow to gross volume is 4.9%.
An attribution error of around 5% of volume is of the same order of magnitude as the net balance: it can be enough to flip its sign. High accuracy on volume does not, by itself, guarantee accuracy in the net position by strike—in other words, the map.
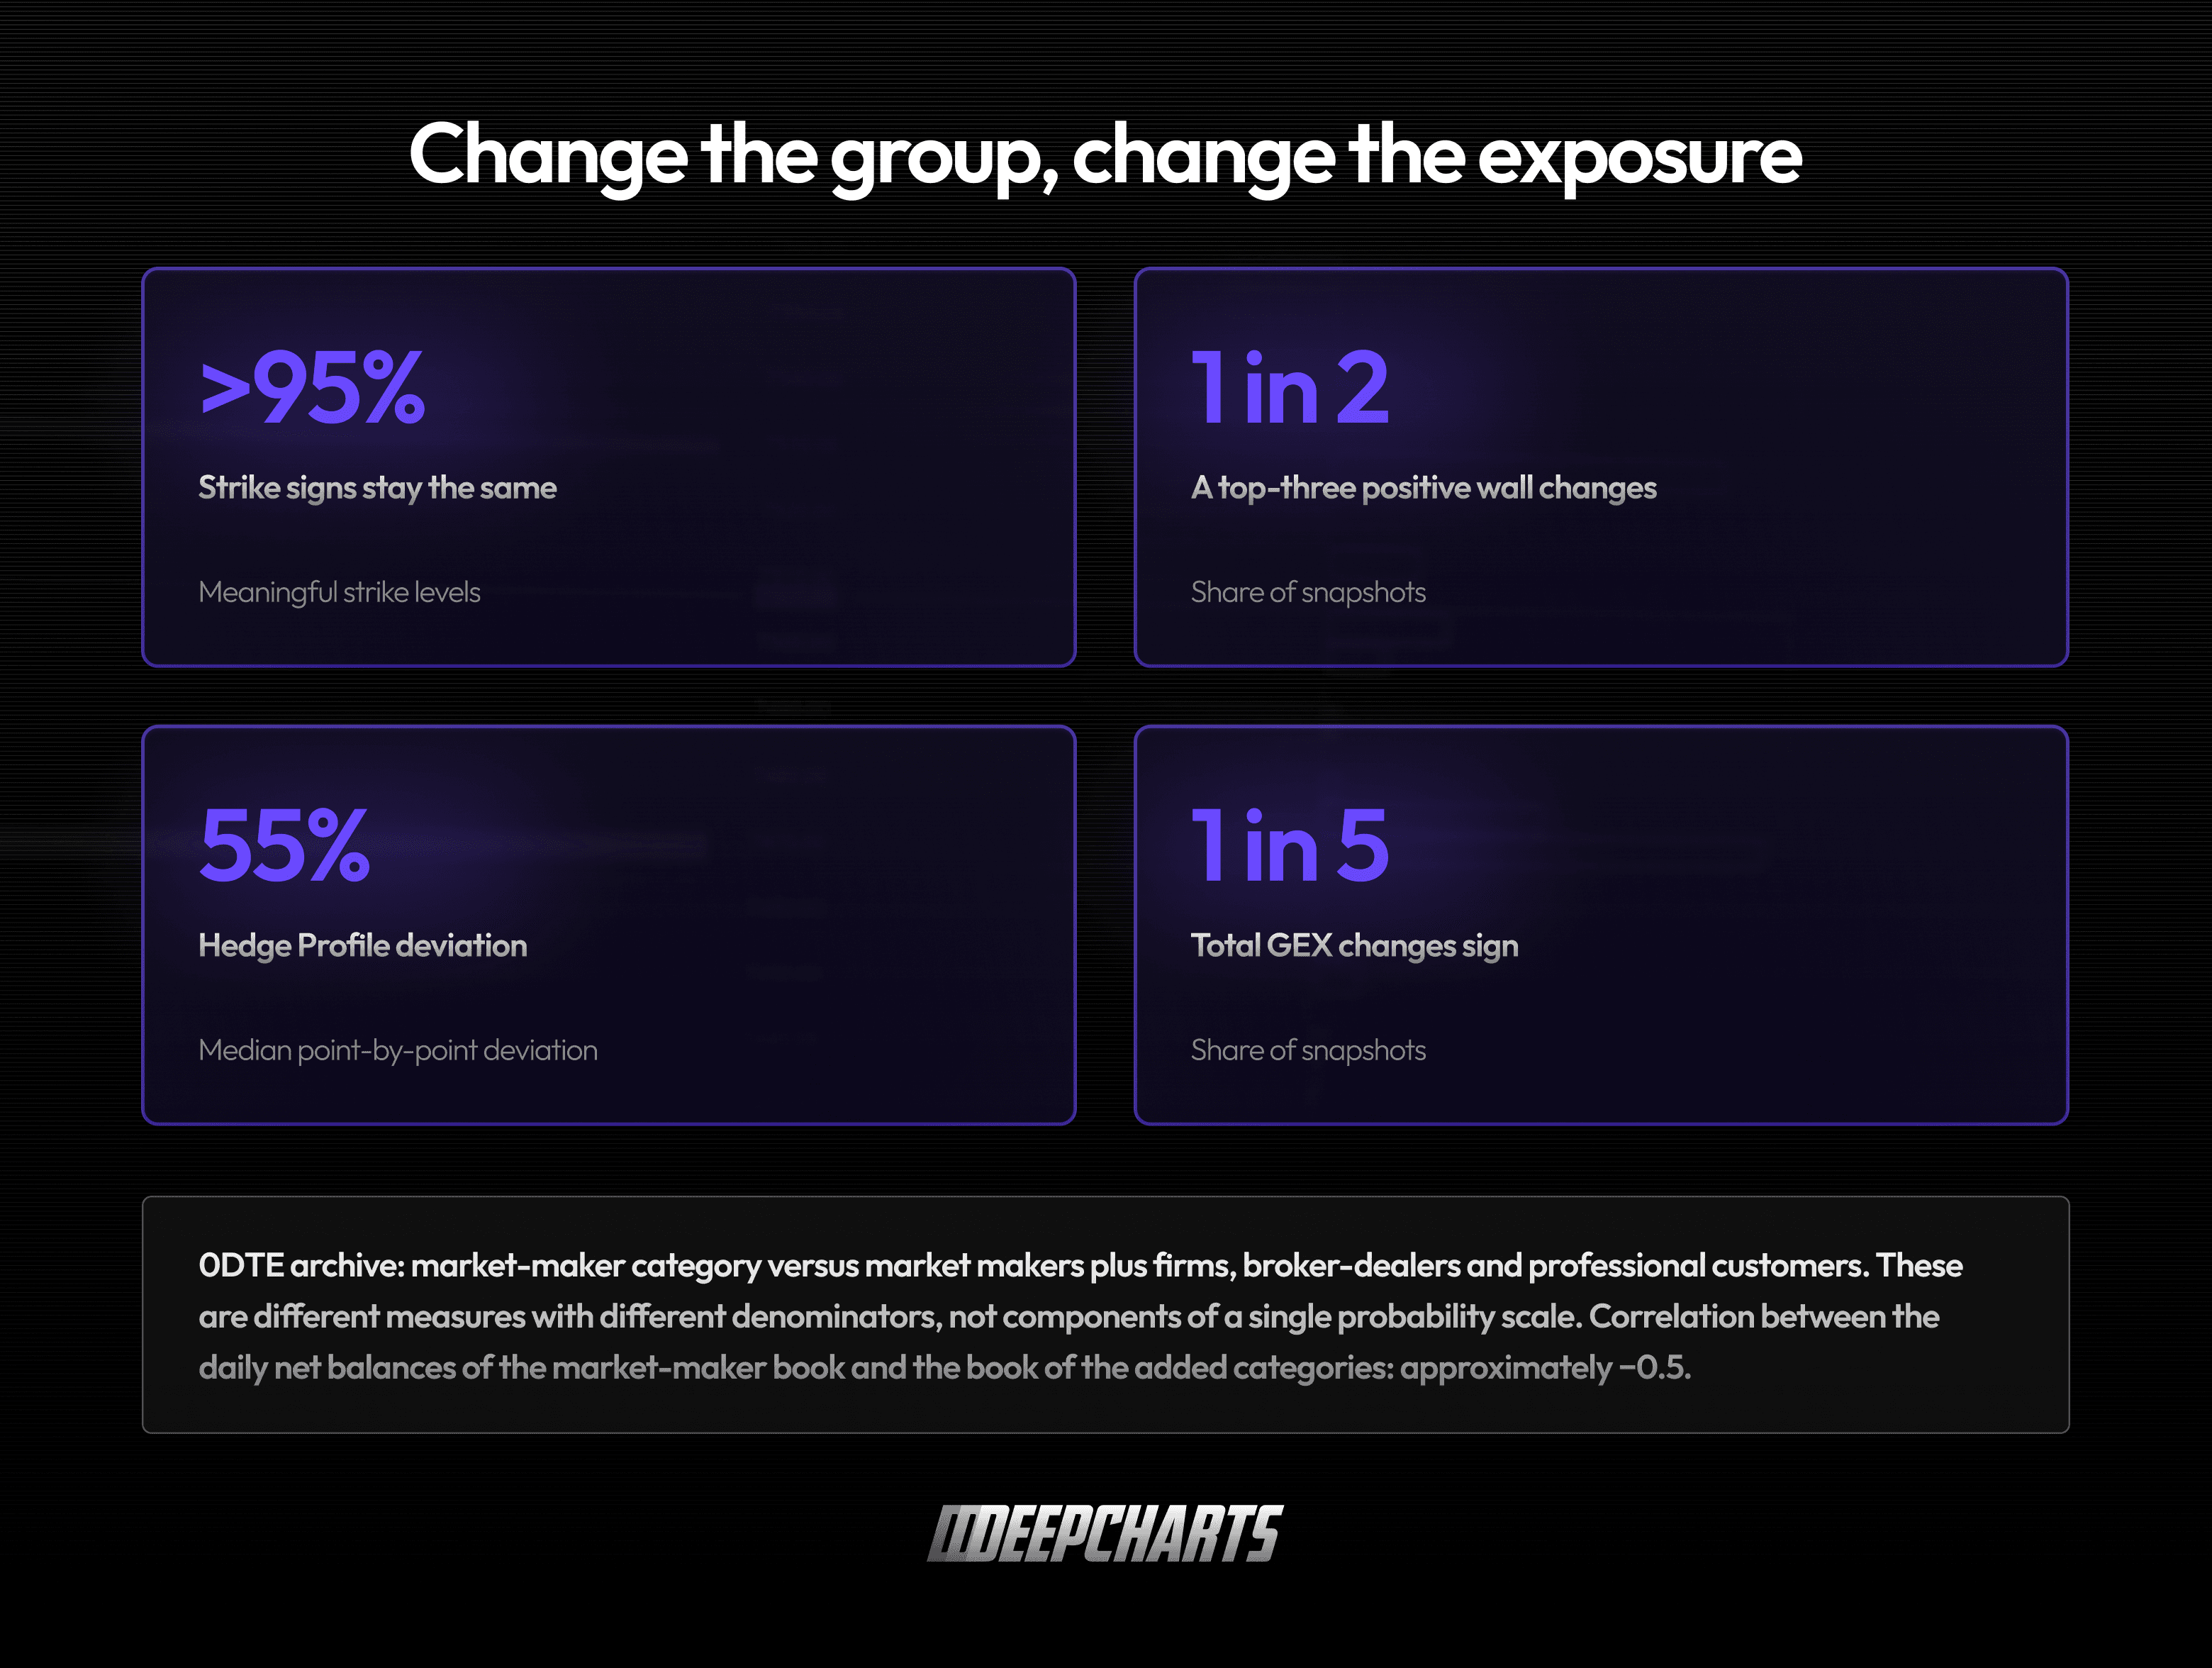
Who is included among “dealers” also changes the map, and we measured that directly. We tested adding firms, broker-dealers, and professional customers to the market-maker category. For the 0DTE options in our archive:
The sign stays the same at more than 95% of meaningful strike levels, but one of the three largest positive walls changes in half of the snapshots. The Hedge Profile shows a median point-by-point deviation of 55%, and total GEX flips sign one time in five.
The daily net balances for the 0DTE market-maker book and the book of the added categories have a correlation of approximately −0.5; the relationship is weak at the individual-series level. Expanding the group changes the exposure being represented, but does not prove that it represents it better.
Adding them does not add more market makers: it adds a different book.
The DeepGamma map represents, by explicit choice, the market-maker category, reconstructed from the flows the exchange records by category: a stated scope, not a convenient aggregation. Anyone selling “dealer positioning” without saying who is in the group is selling a number whose sign—we have measured it—depends on the definition.
On SPX, prices and quantities must be read together
SPX options are listed exclusively on Cboe. For this product, “a single exchange” does not mean a small slice of a fragmented market. File completeness and reconstruction quality still need checking, but counting venues is the wrong objection. Cboe annual report.
Implied volatility and skew matter. DeepGamma uses them. But the volatility surface is not, on its own, a ledger of how many contracts each category has bought or sold. Deriving those quantities from prices requires assumptions.
Our approach is complementary: classified flows to reconstruct positions; quotes, volatility, and Greeks to assess their risk.
In its own analyses of SPX 0DTE options, Cboe states that it can see, for each transaction, whether it involves a customer or market maker, a purchase or sale, and an opening or closing trade. On that basis, it tracks market makers’ net positions by strike and calculates aggregate net gamma. The same logic as our map, with transaction-level detail that the aggregated product does not provide. Cboe positioning analysis.
Real-time OI: the advantage we can measure
During the trading session, official Open Interest remains the previous evening’s figure. DeepGamma’s real-time OI, available in DeepCharts, is an estimate updated with Open-Close flows at every available interval. Cboe DataShop convention.
We compared end-of-day reconstructions with official OI the following morning. The method was selected before 55 subsequent evaluation sessions, with comparison data available through July 31, 2026.
Sample | Contract-day observations | Error: morning OI left unchanged | Error: real-time OI |
|---|---|---|---|
Active contracts across expirations eligible for comparison | 560,829 | 5.12% | 3.03% |
Day before expiration, PM-settled contracts | 20,372 | 46.07% | 9.66% |
The metric is weighted absolute error: the sum of the absolute differences is divided by total official OI. Positive and negative errors do not cancel out. Individual contracts can have larger errors.
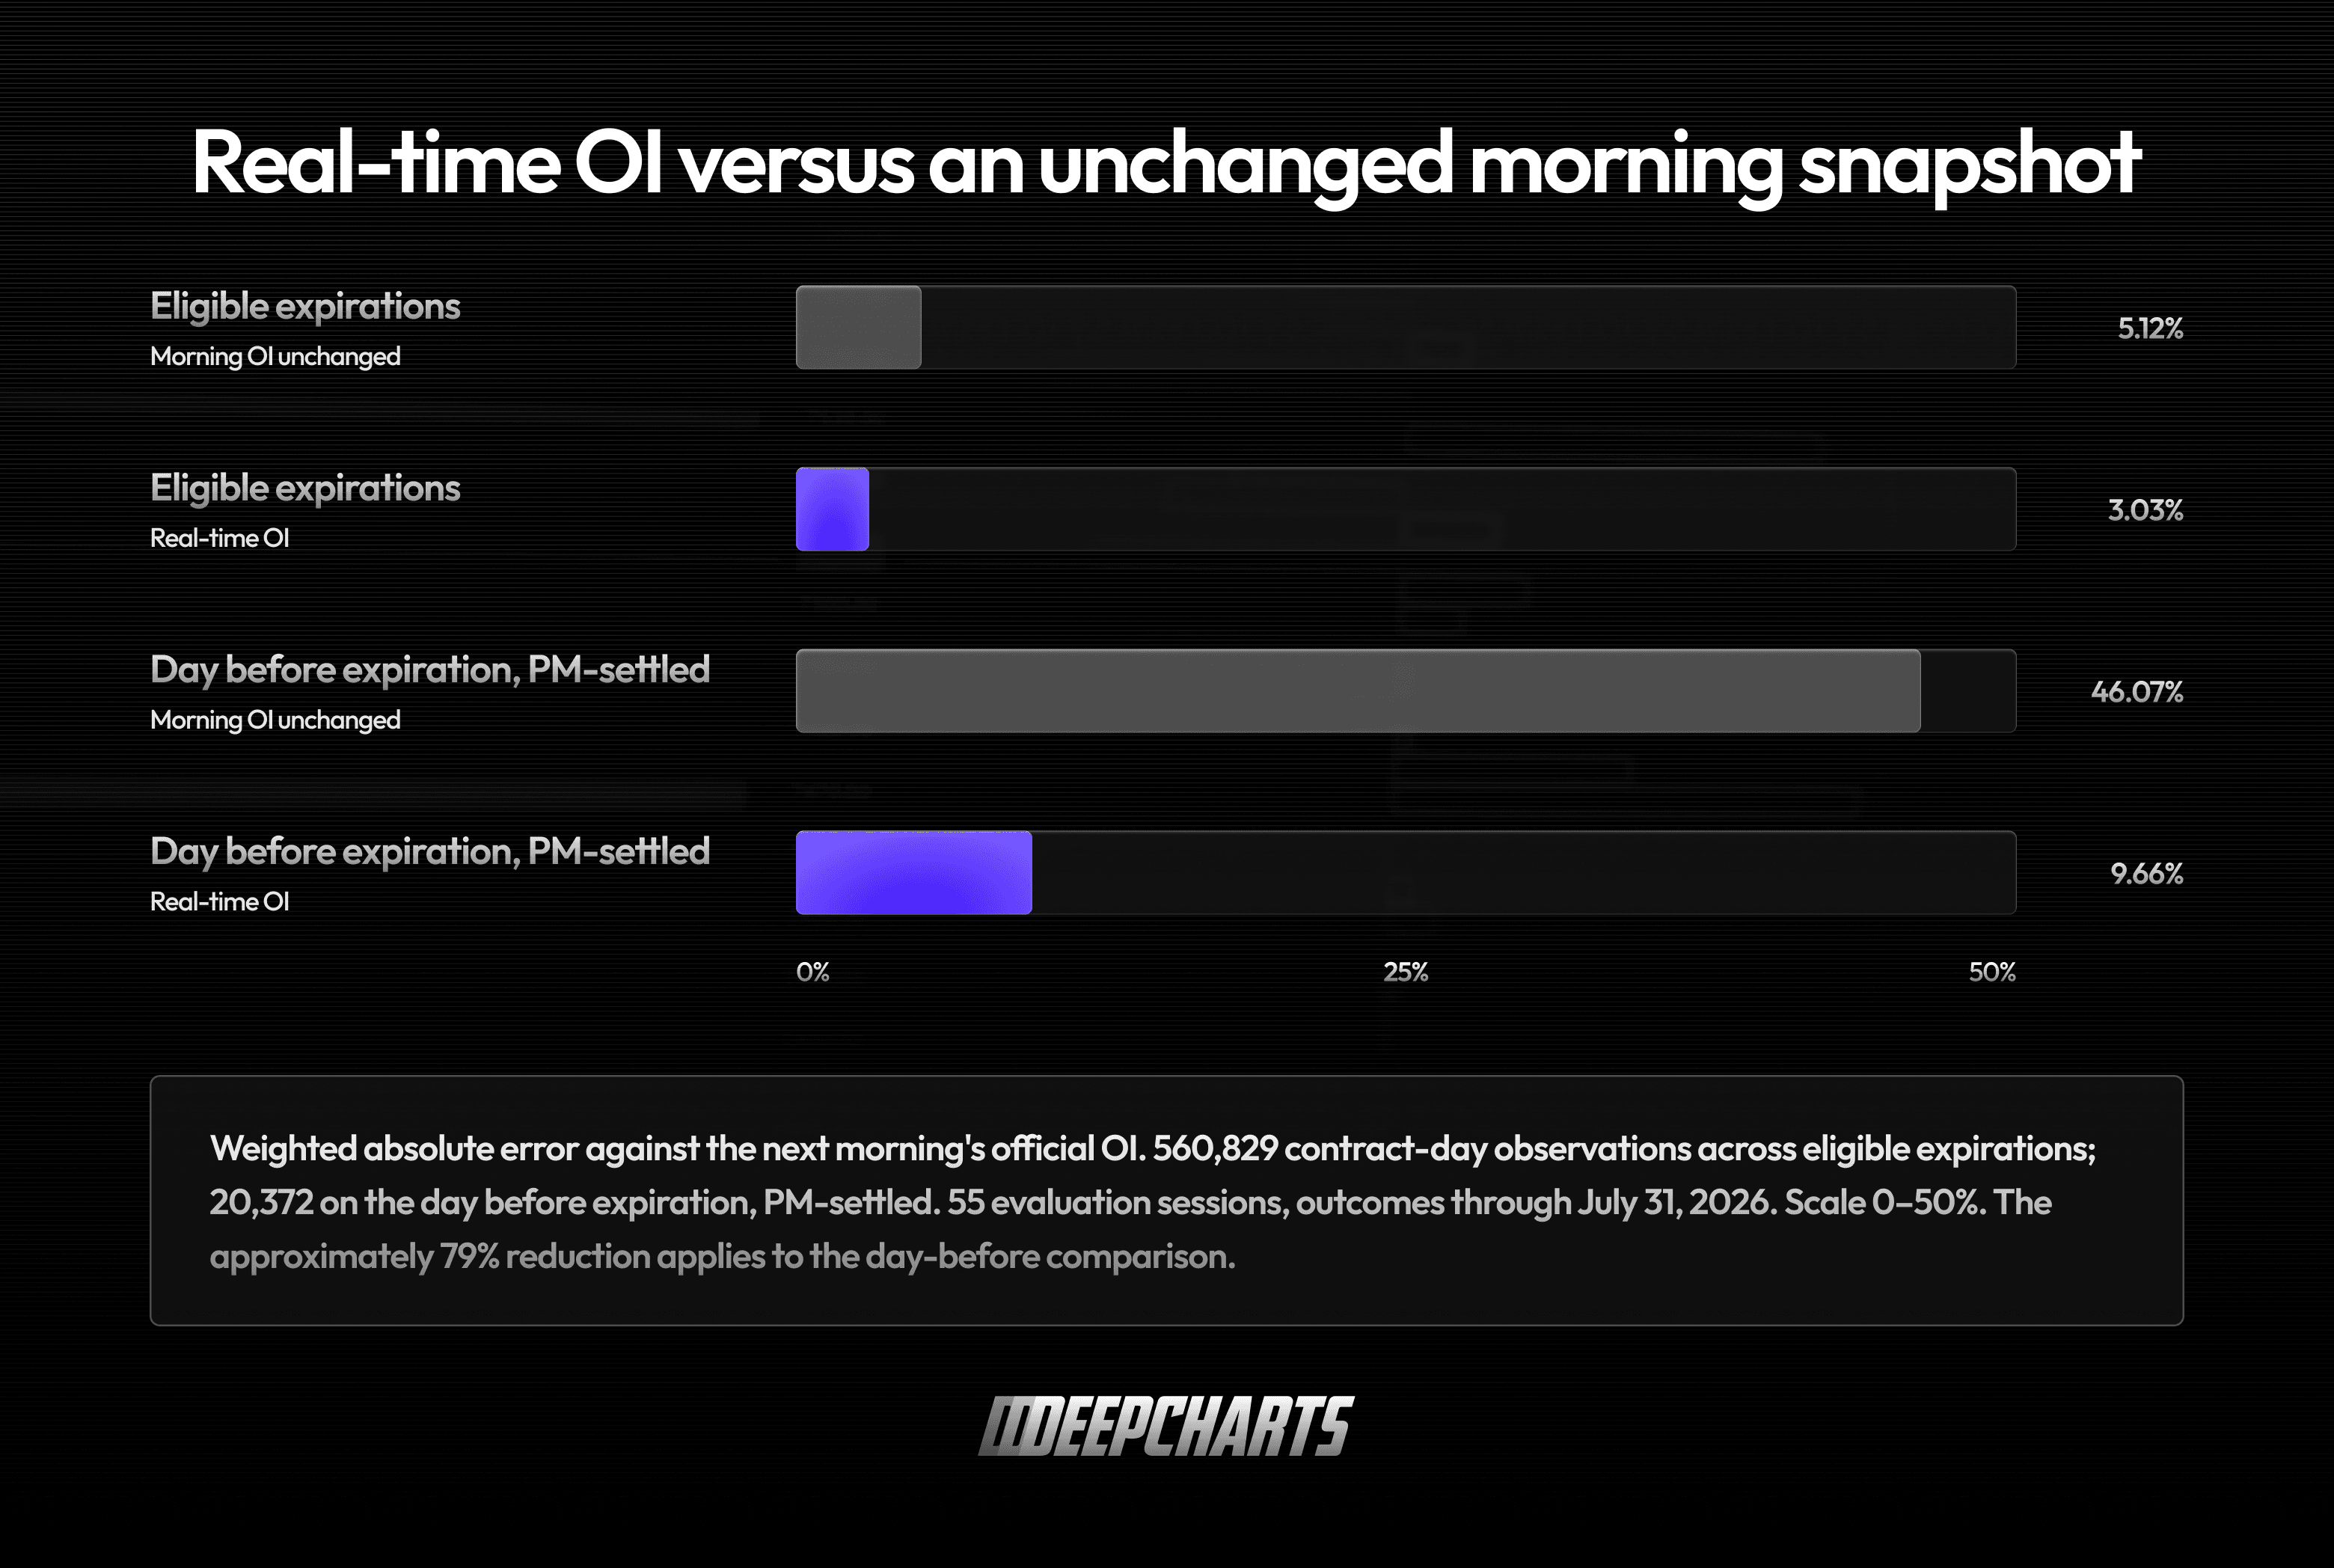
On the day before expiration, updating OI reduced the error by approximately 79% compared with leaving it unchanged. Including closing trades improved the estimate versus using opening trades alone in 54 out of 55 sessions.
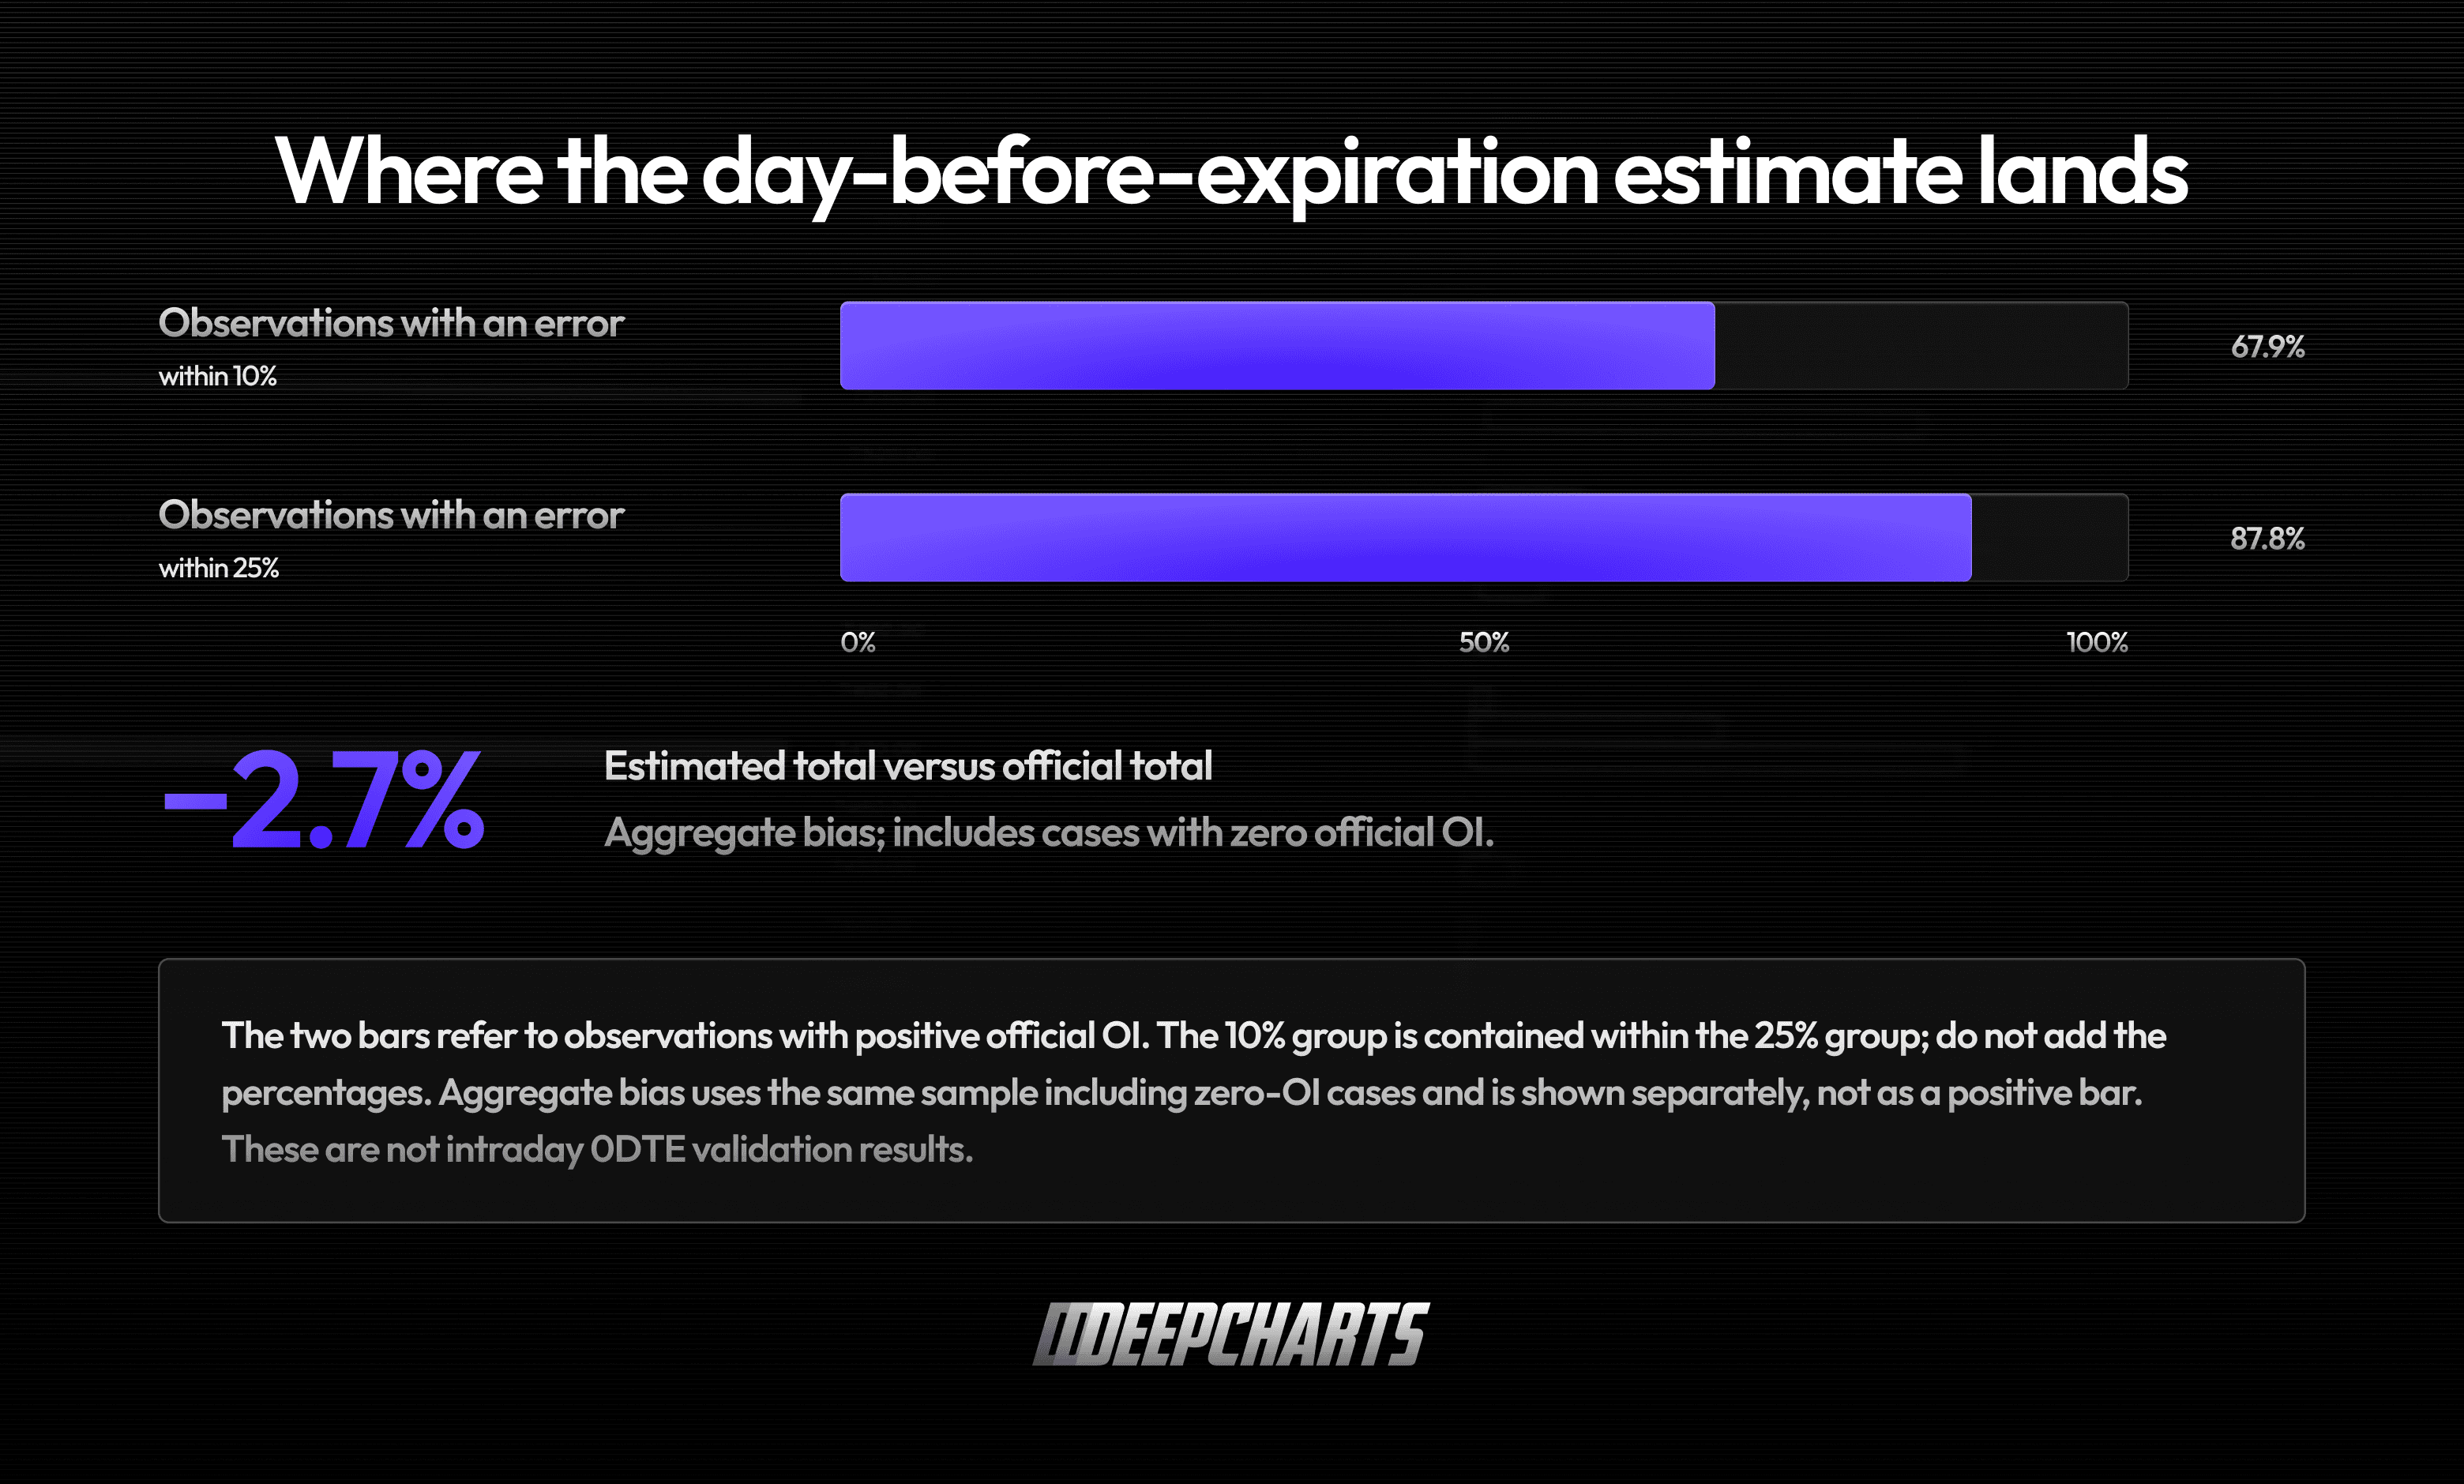
The distribution matters too: among observations on the day before expiration with positive official OI, 67.9% have an error within 10%, and 87.8% within 25%. In the same sample, including cases with zero OI, the estimated total is 2.7% below the official total.

Our 79% is not comparable with the white paper’s 99%: it is an error reduction against a stated baseline, not the same metric or a comparison between products.
The point is how a result is documented: a defined question, a sample, a reference, and a measure of error. Providing this information does not require disclosing proprietary formulas. We have done it above.
Hedge Profile: risk context, not promised orders
DeepGamma’s Hedge Profile starts with the reconstructed positions of the market-maker category. It models how their theoretical hedge changes as price and volatility change, expressing sensitivity in underlying-equivalent units per index point.
For a discretionary trader, the useful question is: in this price area, how much does the risk of the positions we observe change? It is context to use alongside order flow.
Market makers can offset risk elsewhere or choose different hedging methods and timing. The profile does not observe those decisions and does not claim to predict them.
Turning positions into risk scenarios still requires a model, but a model that starts from a recorded side does not have to infer it first.
There is no need to promise a future order to offer a useful reading of risk.
GEX, real-time OI, and Hedge Profile bring this options context into DeepCharts. They complement a discretionary reading of the market without replacing it.
Less faith in isolated percentages. More evidence behind the chart.
A dataset’s limitation does not validate the alternative. Yesterday’s validation does not certify today’s market. An SPX test does not certify other markets. A broader definition of “dealer” is not automatically a more accurate measure. And a percentage, however high, does not explain on its own what has been demonstrated.
Exchange-classified flows. Reconstructed positions. Measured results.
DeepGamma does one thing—SPX—and measures it. It is a choice, not a limitation.
Traders need more than a convincing explanation. They need to know what it rests on.
Documents discussed: Wizard of Ops, Nobody Is Talking About This., September 1, 2026, Substack. Jason D. DeLorenzo, Impact of option dealer flows on equity returns, December 19, 2023; accuracy claim in section 4, PDF page 6 (printed page 5); quotations on PDF pages 3 and 19. White paper copyright: Ad Deum Funds, LLC; the Substack About page identifies the same company as its publisher.
Research scope: internal historical checks on an archive already used in research, November 3, 2025–July 31, 2026; these do not constitute independent certification. The percentages of trades without a market maker, with market makers on both sides, or only between customers are lower bounds derived from quantities by category.
Informational and commercial content, not an investment recommendation. Historical results and reconstruction quality do not guarantee trading results. The observations concerning the accuracy claim address the published explanation examined and may be updated if further details are published.
Rodolfo Sartorello
·
Share this on
