


Institutional traders use specialized algorithmic strategies to split large orders into smaller executions,aiming to balance execution cost and market impact. These algorithms are typically classified into volume-driven and price-driven types. Volume-driven algorithms control the execution pace relative to market volume over an extended period (from tens of minutes up to a trading day), while price-driven algorithms aggressively seek liquidity and can fill an order quickly if market conditions allow.
Each strategy targets a benchmark price (e.g. VWAP, arrival price, or closing auction) and adapts to prevailing market conditions. Below we survey the main algorithms in each class and discuss how a trader using order-flow tools (delta, footprint charts, heatmaps) might recognize them in action.

Volume-Driven Algorithms
Volume-driven algorithms pace execution according to volume benchmarks. They slice a large parent order into "child" orders that follow either historical or real-time volume profiles, with the goal of matching a benchmark price (like VWAP or the close) while minimizing market impact. These strategies typically run over a moderate to long horizon (e.g. 30 minutes to a day).
Key volume-driven algos include:
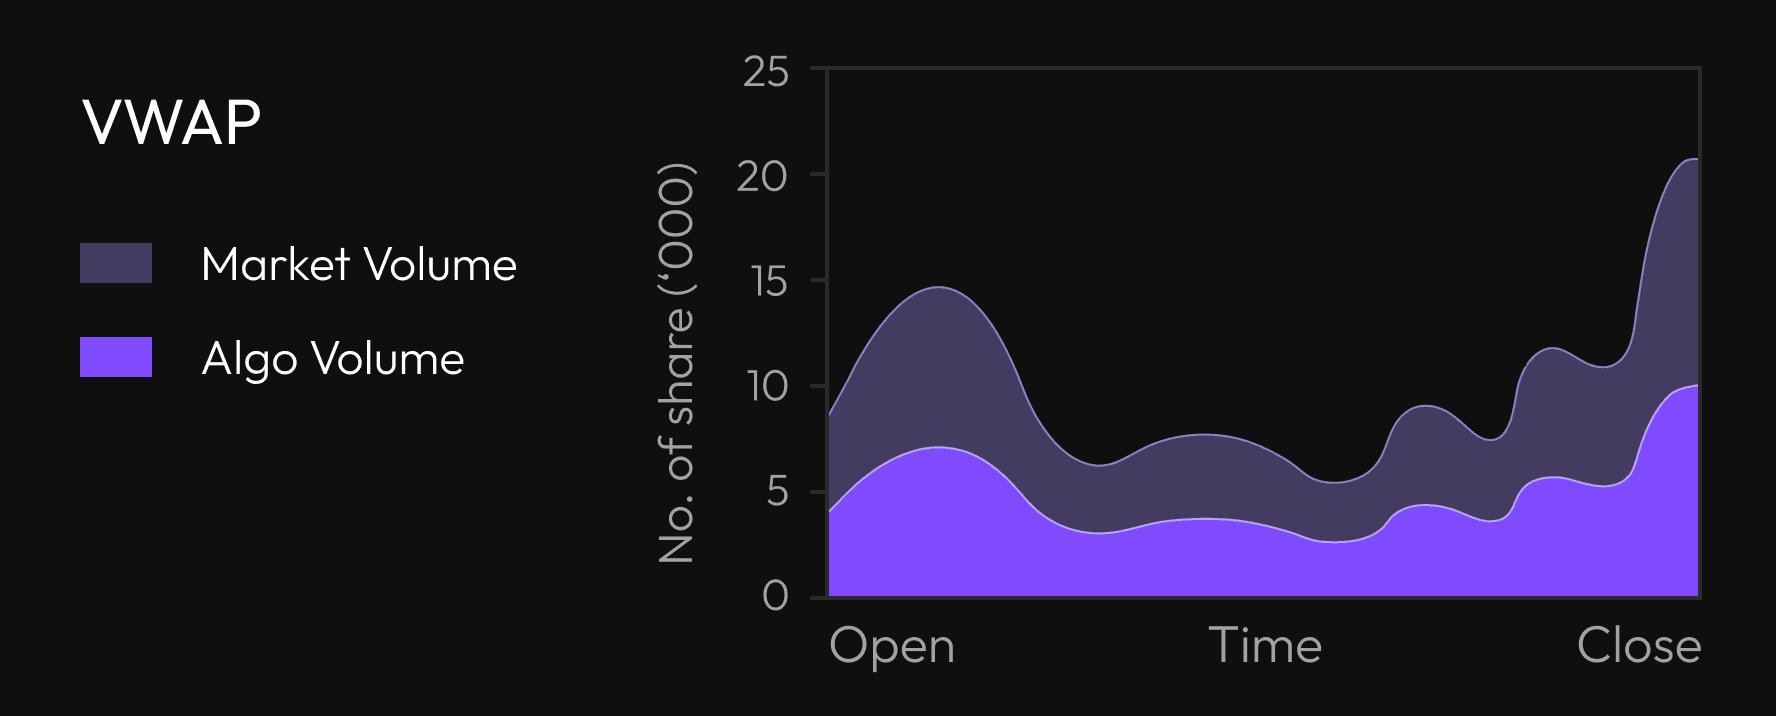
VWAP (Volume-Weighted Average Price): A VWAP algorithm breaks a large order into smaller trades distributed in proportion to the stock's normal volume profile. In effect, it aims to achieve an average execution price close to the day's VWAP. For example, Investopedia notes that VWAP strategies "releases dynamically determined smaller chunks… using stock-specific historical volume profiles" so that the execution price is near the volume-weighted average price.
VWAP is popular because it is a moving, forgiving target – as long as an algorithm roughly follows the volume curve, it will typically achieve the VWAP over the interval. In practice, VWAP is favored for liquid stocks and large orders where a trader is willing to trade with the general market flow. For instance, CME Group explicitly offers VWAP execution for large futures hedges.
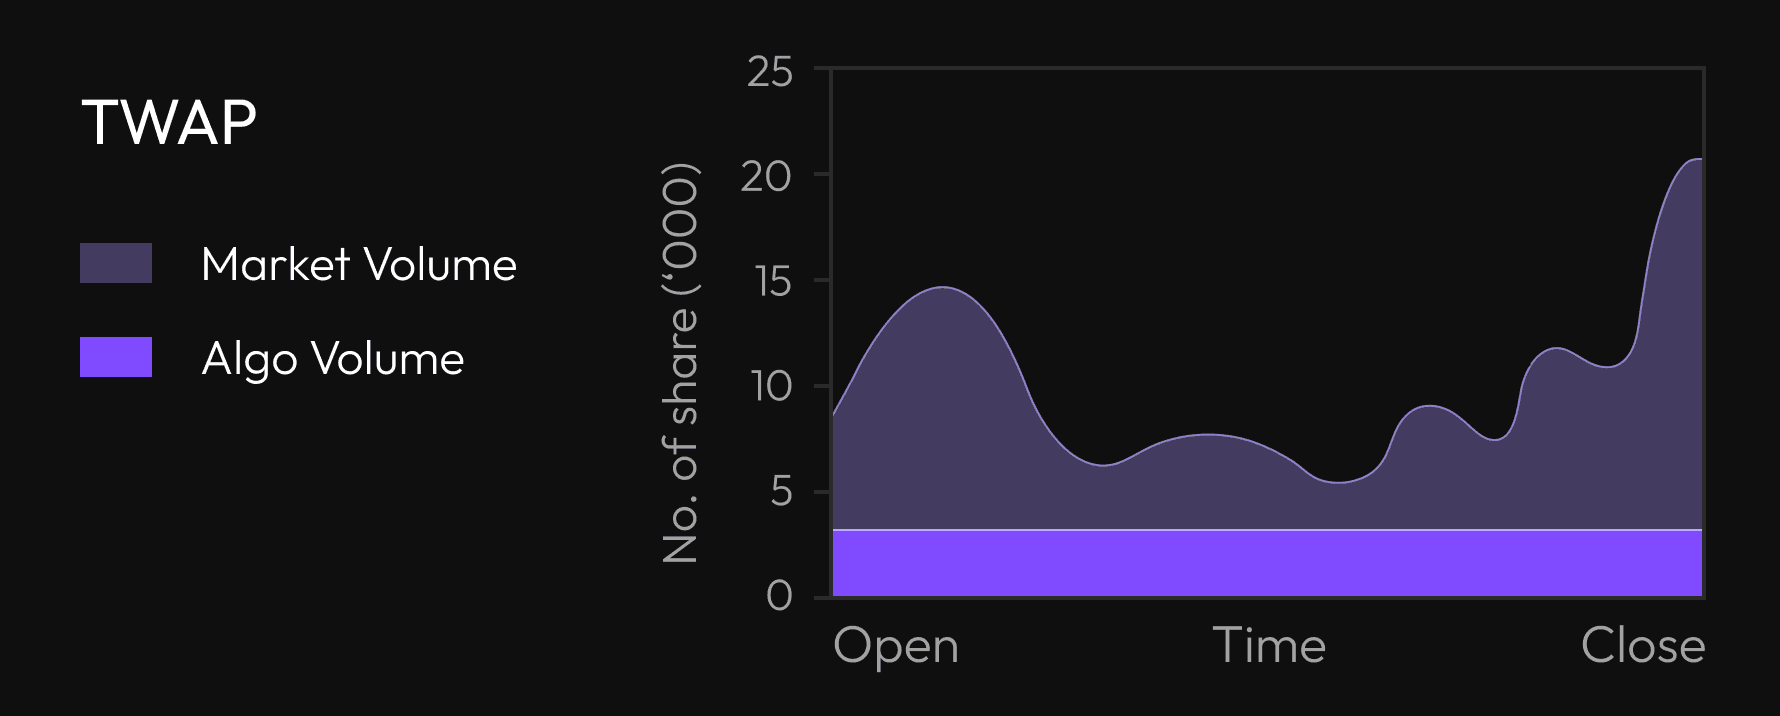
TWAP (Time-Weighted Average Price): A TWAP algorithm slices the order into equal-sized trades over fixed time intervals, regardless of actual volume. The goal is to achieve the average price between start and end times. In other words, it follows a linear trading schedule (even pacing) instead of a volume profile. TWAP is often used when historical volume profiles are unreliable or when traders want a steady execution rate. Investopedia describes TWAP as "releases waves… using evenly divided time slots between a start and end time".
Because TWAP does not adapt to surges in volume, it may be preferable when anticipating irregular volume spikes; for example, if high volume is expected at an adverse price, a pre-programmed even spread can limit impact.
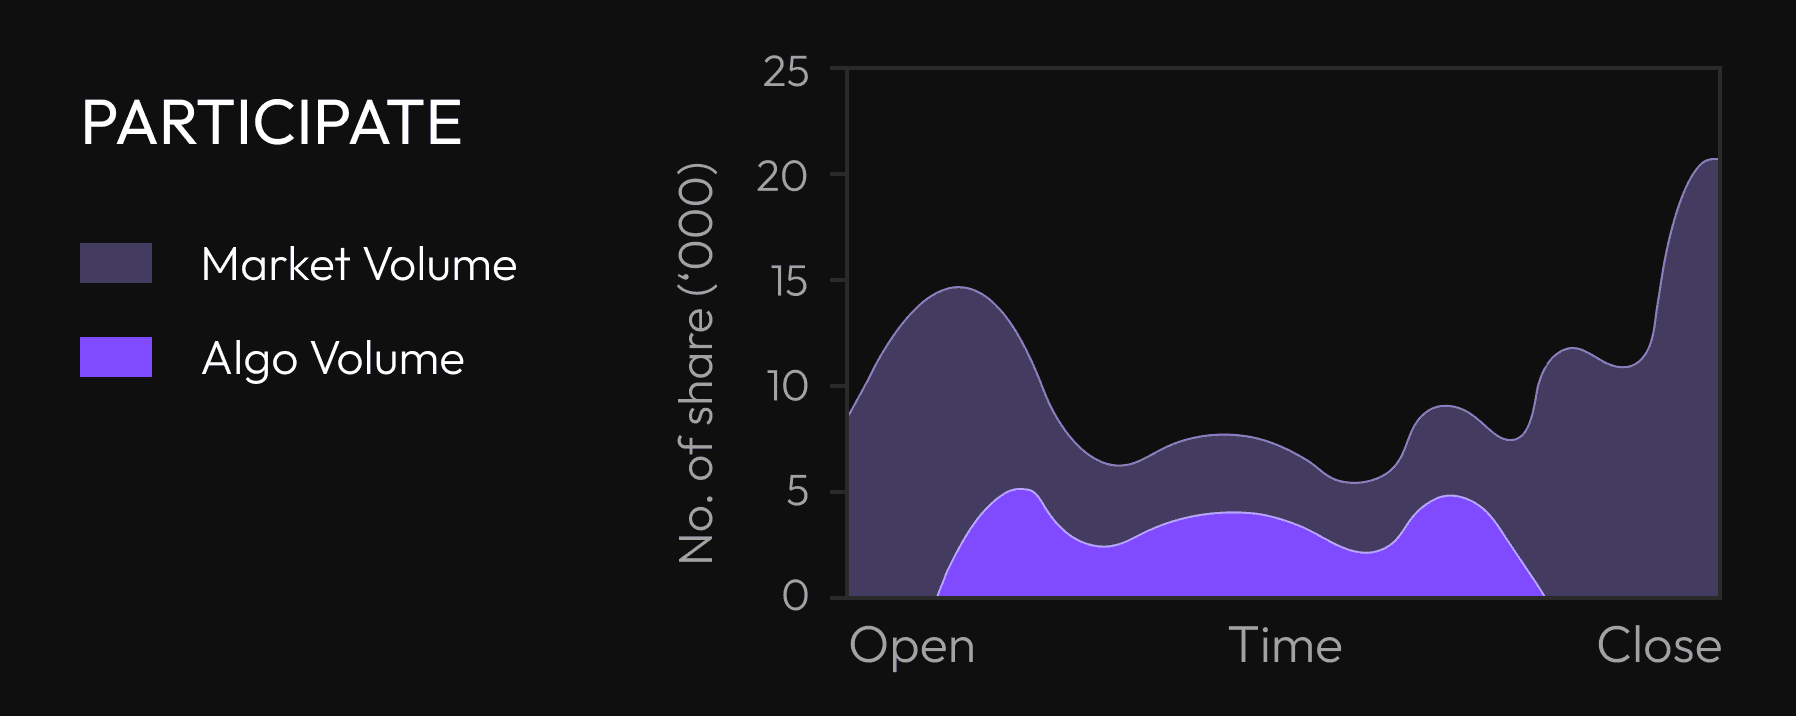
Percentage of Volume (Participate/POV): A participation (POV) algorithm continually sends child orders at a specified fraction of current market volume until the order is filled or time runs out. In effect, it "follows (live) the exchange volumes… by respecting a target level of participation". For example, Binance describes a Volume Participation algo as one that "performs a trade at a pace that approximately matches a portion of the real-time market volume".
The trader sets a participation rate (e.g. 10% of market volume) and the algorithm throttles execution to that level. Investopedia notes that the order "continues sending partial orders according to the defined participation ratio and according to the volume traded". A common variant is the "Steps" strategy, where the participation rate itself is adjusted up or down when the price reaches certain levels. Traders use POV algos when they want to limit impact but still capture available liquidity: for instance, quietly buying a fixed fraction of each incoming volume bar.
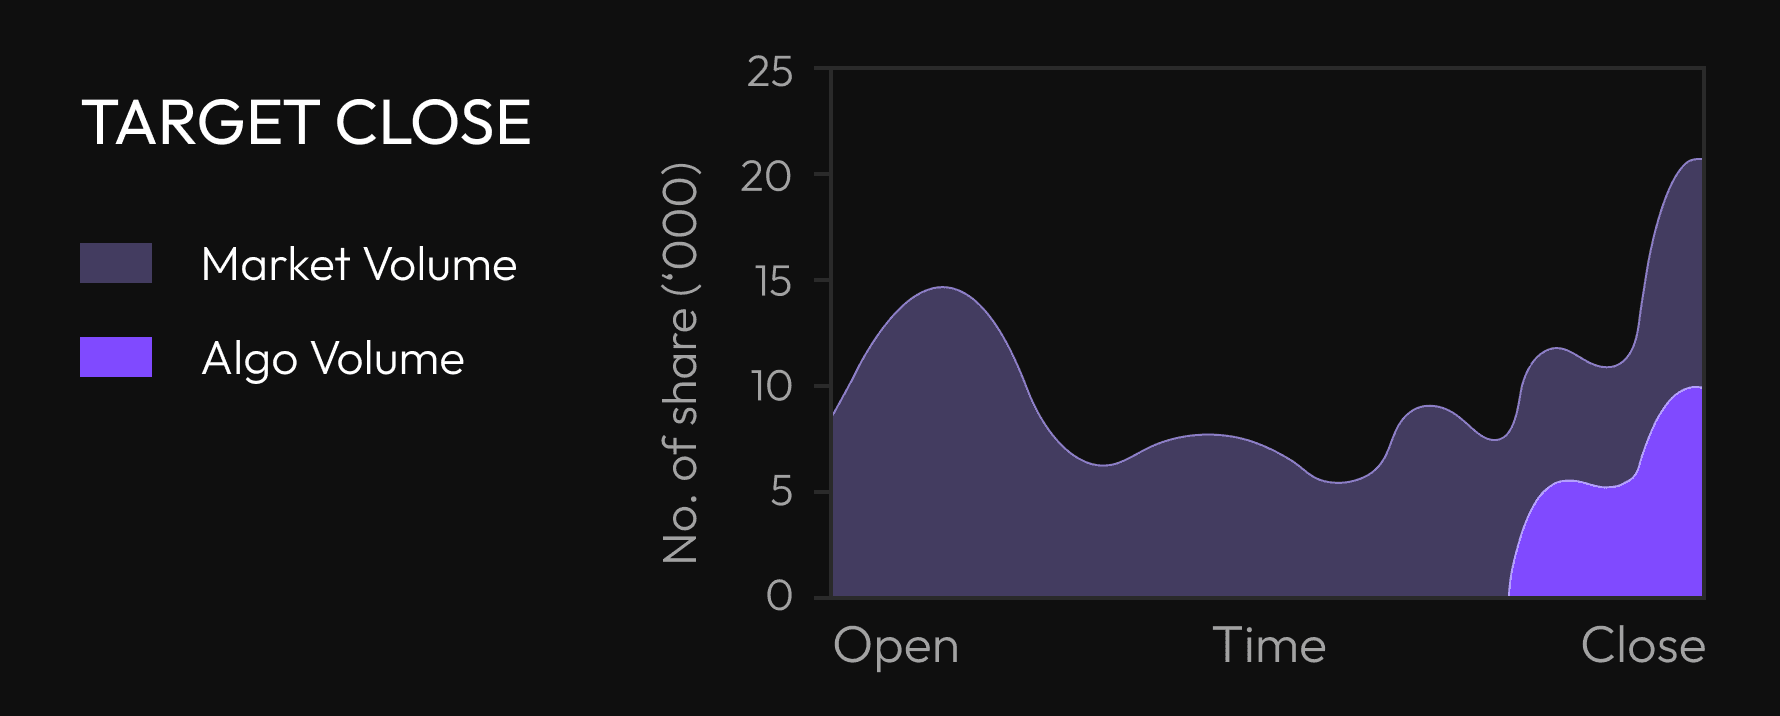
Target Close (TC): A target-close algorithm tries to concentrate executions at the closing auction of the trading day. Its objective is to execute as much of the order as possible at the official close price. Mathematically, a TC strategy finds the optimal start time and trading trajectory to minimize the deviation from the closing price benchmark. In practice, this means trading more aggressively near the end of day. As one practitioner notes, TC "is designed to provide a trader with a lower impact approach to trade with a close price benchmark".
For moderately large orders (often up to a few percent of daily volume) that need to hit the close, a TC algo will delay execution until late and then split the remainder between continuous trading and the closing auction. It balances the trade-off between getting a close price and avoiding being the sole large participant. For example, Deutsche Bank points out that small orders (~<5% ADV) often fill in auctions at minimal cost, while large orders require careful scheduling
In all these volume-driven methods, the trader typically pre-defines a schedule or benchmark, and the algorithm simply follows volume patterns. Market conditions (price swings, liquidity shifts) may cause minor adjustments, but the primary driver is time or volume distribution. These algos usually minimize urgency in favor of low impact. For example, a VWAP or TWAP run will deliberately avoid fast, aggressive fills even if price moves strongly, because the goal is to match average price, not chase every move.
Price-Driven Algorithms
By contrast, price-driven (or opportunistic) algorithms are ready to execute large chunks quickly if market conditions are favorable. They often use marketable orders and price triggers rather than a fixed schedule. Price-driven algos aim to minimize slippage relative to a target price (like the arrival price or intraday high/low) by reacting to price movements. In essence, they put the probability of execution ahead of gradual pacing.
A helpful way to see the distinction is that volume-driven strategies "control the execution rate…over long duration" whereas price-driven strategies can "execute 100% of an order very rapidly if market conditions are compatible".
The main price-driven algorithms include:
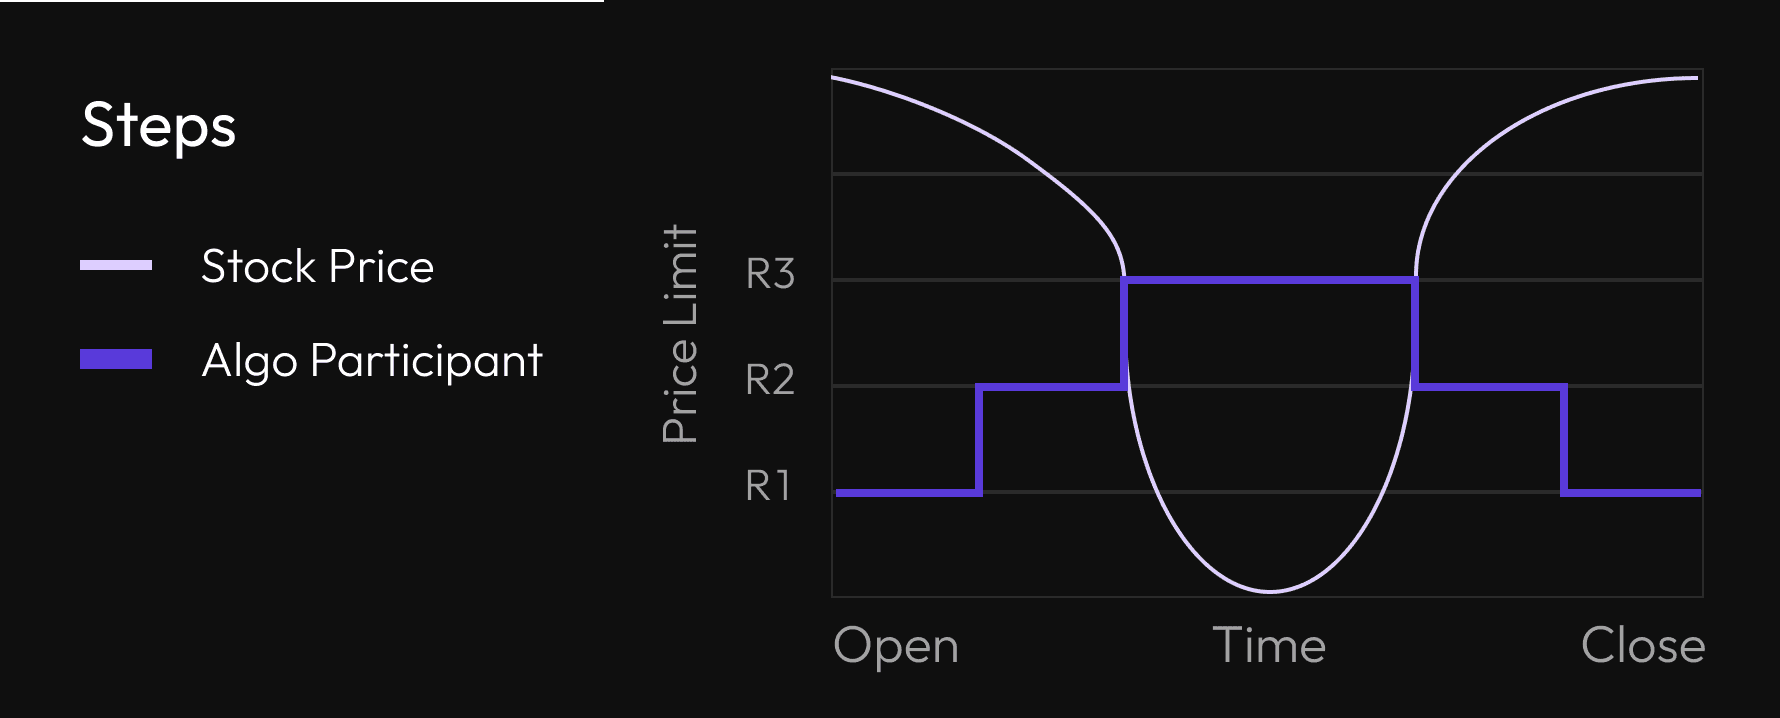
Steps Strategy: The Steps algorithm is essentially a dynamic participation tactic. It begins at a preset participation rate but adjusts that rate when price breaches user-defined thresholds. As Investopedia notes, the "steps strategy sends orders at a user-defined percentage of market volumes and increases or decreases this participation rate when the stock price reaches user-defined levels". In practice, the algo might start passively at, say, 20% of volume, but if price moves favorably it might "step up" to 50%, or if price moves against it, it steps down or pauses. Steps allows the trader to encode both VWAP‐like pacing (via the base participation) and momentum seeking (via the price triggers), all in one rule. It can mimic multiple algorithms (VWAP, IS, momentum) under programmatic control.
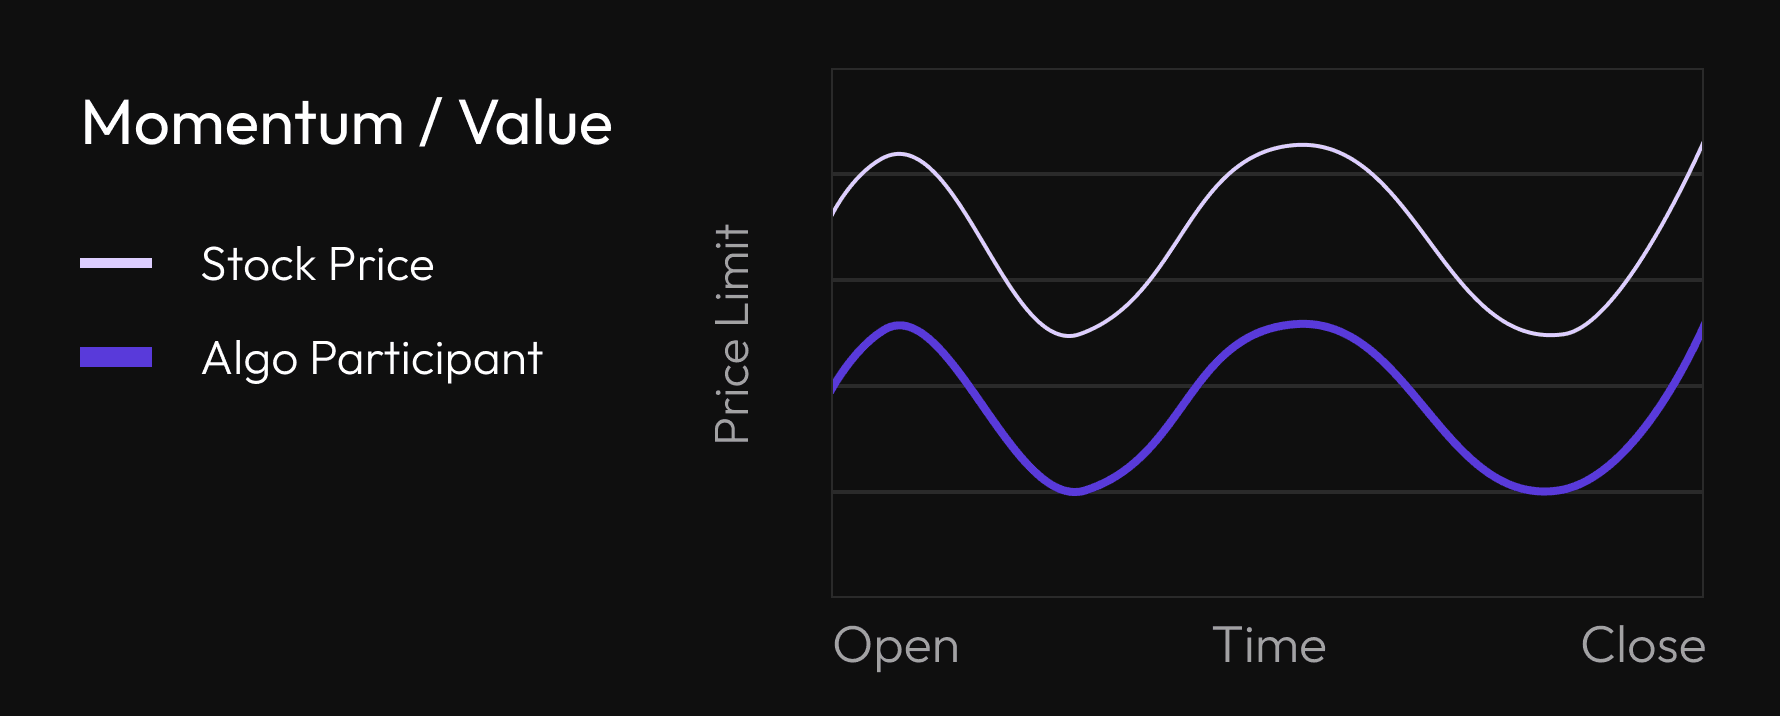
Momentum / Value Strategies: These two related styles adjust execution intensity based on price trend. A momentum execution strategy pushes volume aggressively when the price is moving in the trader's favor (anticipating that a trend will continue), and pulls back or holds if the price moves against the order. A value (mean-reversion) strategy does the opposite – it assumes prices will revert, so it trades less during a favorable move (waiting to catch reversion) and more during adverse moves (taking advantage of dips). In either case, the goal is to "minimize the spread between the execution price and the arrival price" by guessing the short-term price pattern. In practice, an implementation shortfall algorithm often embodies momentum logic: it will increase the participation rate when price moves favorably and decrease it when the price goes against. A pure momentum-type algo might simply take every bid in an uptrend or every offer in a downtrend to ride the wave. These strategies are opportunistic and can be very fast – for instance, if the price suddenly gaps, a momentum algo will try to "steal" liquidity immediately.
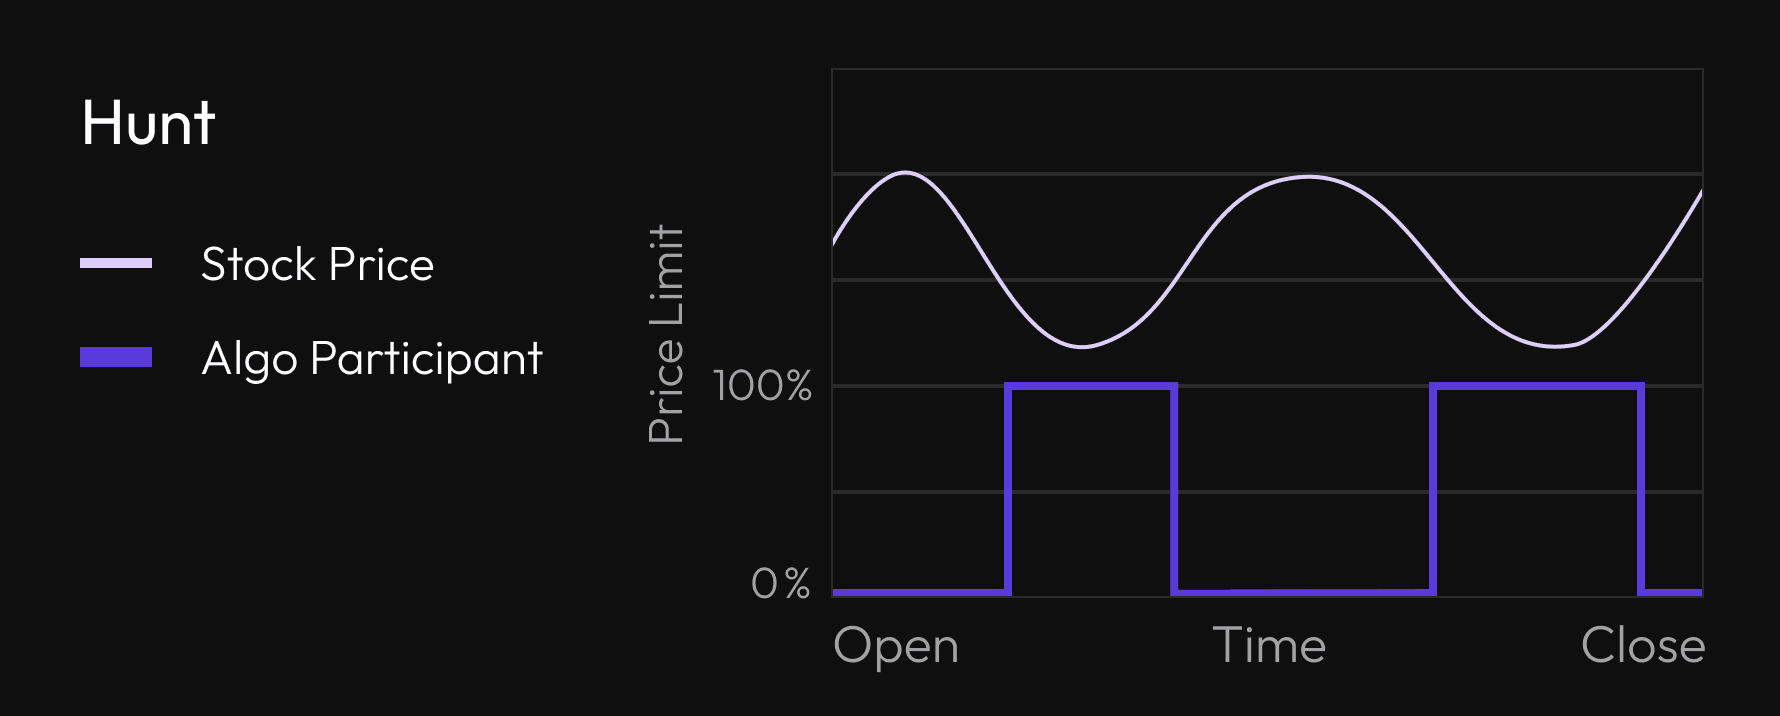
Hunt (Liquidity- or Iceberg-Hunting): The Hunt algorithm is designed for small, illiquid stocks or situations where the trader wants to hide entirely. It does not post visible orders on the book. Instead, it scans for liquidity at the best prices and instantly takes it. As Natixis describes, the Hunt strategy "provides the opportunity to execute an order on the primary exchange and MTFs while never being placed in the market and thus to minimize information leakage".
In other words, it fires marketable limit orders only when it finds resting liquidity (often by pinging the book or using "midpoint" dark mechanisms). Hunt is useful when trading small-cap or thin markets: it aggressively seeks out the hidden liquidity (iceberg orders or dark pools) without revealing a persistent presence. It is "favoured…for illiquid instruments" and is intended "to execute an order at a limit price without being visible to the market". In practice, a Hunt algo might repeatedly place small limit orders at the inside bid or ask, quickly capturing any emerging supply or demand, but cancel them immediately if not filled. This can very rapidly "hunt" through layers of hidden liquidity.
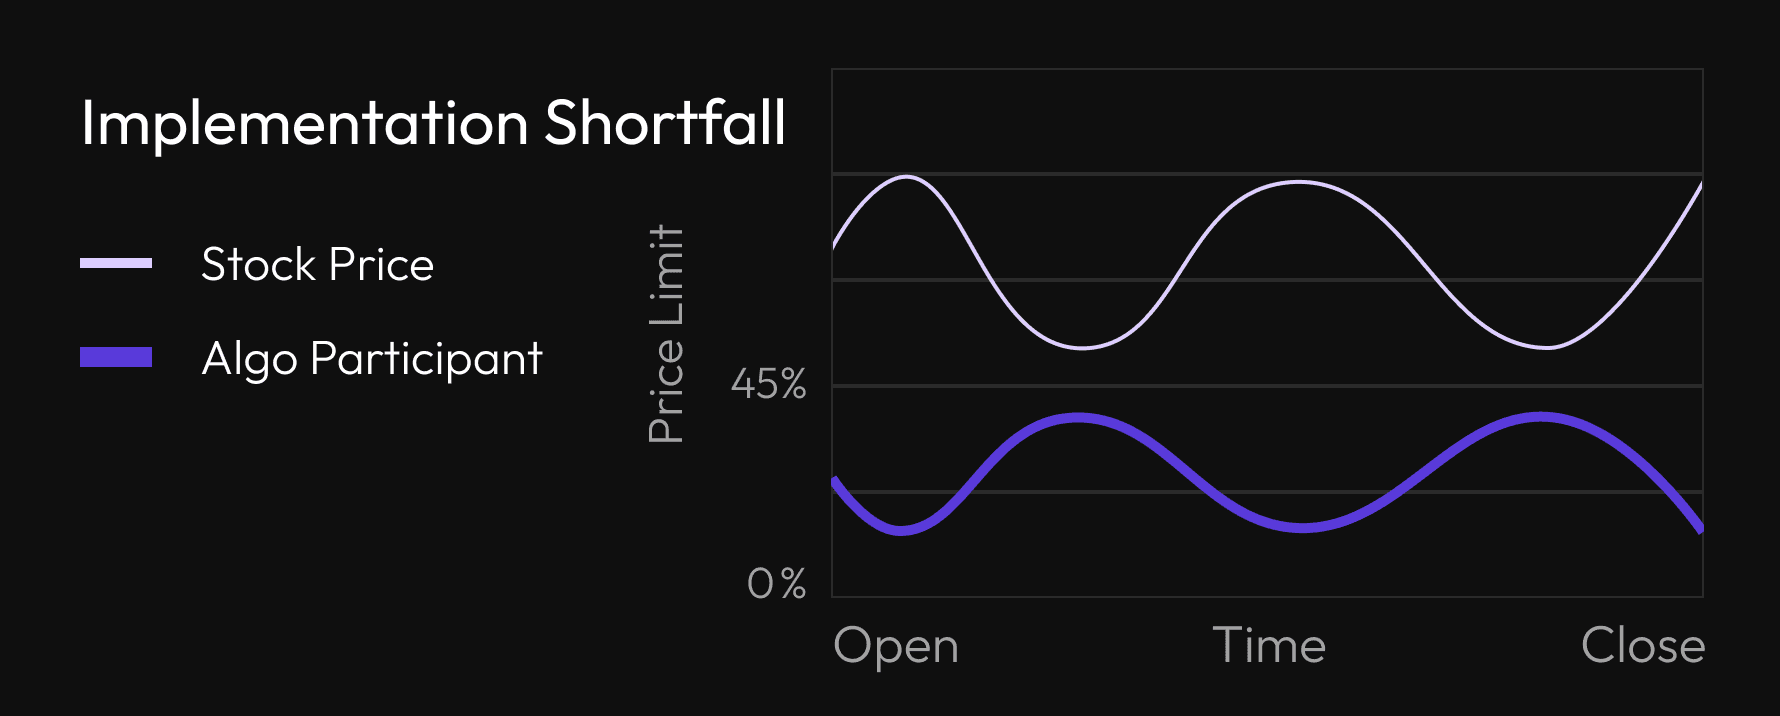
Implementation Shortfall (IS): Named after Andre Perold's classic benchmark, an Implementation Shortfall algorithm explicitly minimizes the total slippage from the decision (arrival) price. The decision price (arrival price) is usually the mid-market or last traded price when the algo starts. An IS algo is opportunistic: it dynamically balances market impact cost against opportunity cost. It will speed up and trade more (increase participation) when the market moves favorably (to capture gains) and slow down when the market moves against (to avoid cost). In effect, IS tries to beat the "arrival" price on average. Importantly, IS is not bound to a fixed schedule – it can fill 100% of the order quickly if liquidity allows.
A standard description is that the strategy "aims at minimizing the execution cost of an order by trading off the real-time market impact cost… and the opportunity cost of delayed execution". In practice this means the algo may swing between passive and aggressive behavior, always aiming to meet or beat the initial benchmark price.
Overall, price-driven algos seek to track real-time price dynamics, whereas volume-driven algos track real-time volume. According to industry sources, volume-driven methods like VWAP/TWAP are best for long-duration, low-impact execution, while price-driven methods (Steps, Momentum, Hunt, IS) can fill orders very rapidly under the right conditions.
Detecting Algorithmic Execution via Order Flow
Traders can often identify the footprints of these algorithms by analyzing high-resolution order-flow data. Tools like cumulative delta (buy volume minus sell volume), footprint charts (volume traded at each price and whether lifted or hit), and heatmaps of the order book make institutional activity visible. For instance, a VWAP algorithm generally produces a stream of smaller orders tracking the overall volume curve – one would see steady buying (or selling) volume that often matches the intraday profile.
A TWAP produces uniform-sized trades spaced evenly in time. A participation algo produces child trades in rough proportion to any surge in market volume. In contrast, an IS or momentum algo produces bursts of aggressive orders whenever price conditions are met (e.g. big buys hitting the ask during an uptrend). A Hunt algo might manifest as repeated small limit fills without any resting orders, i.e. one sees many one-off fills at best bid/ask. A target-close algo will concentrate volume right before the close auction.
Practically, one looks for tell-tale patterns. Heatmap charts (which color-code executed volume by price and time) reveal "areas of high order activity" or liquidity clusters. For example, a sustained sequence of buys at incrementally higher prices (hot colors on the heatmap) suggests a buy-side algorithm walking the book.
Footprint bars show bid/ask splits of volume at each price – a VWAP strategy might show a balanced footprint aligned with normal volume spikes, whereas an IS/momentum algo might show large footprints on one side when price breaks. Cumulative Delta (the running total of buy-initiated minus sell-initiated volume) can spike sharply if an algorithm is aggressively buying (large positive delta) or selling (negative delta) in short order.
Experts note that institutional trading often leaves distinct patterns in the order flow. For example, large traders "slice up million-dollar orders into stealthy chunks," causing "waves" in the order flow. These waves appear as clusters of large trades at regular intervals (e.g. a steady stream of 10‐lot buys every few seconds) that would stand out on a footprint chart. A good order-flow imbalance indicator can "pick up on these subtle shifts" – for instance, sudden clusters of small buy orders overwhelming the sell side.
Large block trades may also leave traces: even if an order is hidden, it will briefly consume visible liquidity, creating a momentary imbalance. A classic sign is a price level that is instantly swept out (one side of the book vanishes) followed by normal flow. As one trader analogy puts it, while retail orders tweak the book lightly, "institutions…dump entire stacks onto the plate at once. These block orders create sudden, glaring imbalances" that can be detected.
In summary, institutional algorithms can be inferred by correlating order-flow signals with trade execution. Sudden spikes in traded volume that do not correspond to any obvious price-moving news, persistent one-sided pressure (e.g. consistently aggressive buys), or unusual depth-of-book dynamics (like repeated pops of hidden liquidity) all point to algorithmic execution.
Specific patterns include "sudden spikes in volume that don't match the prevailing price action," one-sided book imbalance (e.g. buy-side very strong, sell-side thin), or "time & sales patterns where large orders get split into smaller chunks". A savvy trader watching a footprint chart or cumulative delta will see these footprints of "smart money" and can infer the presence of VWAP runs, momentum sweeps, or liquidity-hunting algos.
Deepcharts Team
·
Share this on
