




Every morning the same screenshots go around: “call wall at 6,050, put wall at 5,900” — numbers delivered with the confidence of load-bearing architecture. Sometimes price respects them to the tick. Sometimes it slices through like they were never there. This episode explains what a wall actually is, who builds one, why hedging pressure really does concentrate there — and the honest version of what these levels can and cannot promise. Episode 8 of our Greeks series: the one where we finally read the whole board.
From the book to the board
For seven episodes we’ve lived inside one dealer’s book: one position, one delta, one hedge chasing it. Time to zoom out, because the real market is every book at once — and unlike a single dealer’s inventory, the raw material for reading it is public.
Open interest — how many contracts exist at each strike and expiry — is published daily. And here’s the thing about options that makes maps possible at all: exposure isn’t spread evenly. Real flow herds. Yield programs sell the same round-number calls month after month. Protection buyers cluster their puts at the same handful of strikes below the market (Episode 4’s structural buyers, leaving structural footprints). Round numbers attract everyone.
Where contracts concentrate, gamma concentrates (Episode 3’s bells, stacked thousands deep). And where gamma concentrates, the hedging we’ve spent seven episodes studying concentrates too — at specific, knowable prices. Multiply each strike’s gamma by its open contracts, make an assumption about who holds what (hold that thought — it’s the load-bearing assumption of this whole subject), and you get the board’s gamma profile: a skyline of exposure, strike by strike.
The tallest towers of that skyline have names. The biggest concentration above the market: the call wall. The biggest below: the put wall.

Figure 1 · The map lives on the price axis
How the map gets drawn: four pictures of one board
Before going further, fix one practical point — because it changes how you’ll look at every exposure chart from now on. Walls are not naturally an x-axis object. Strikes are prices, and prices live on the vertical axis of the chart you already trade. So every serious rendering of this map is plotted horizontally, aligned with the underlying’s price scale — the same grammar as a volume profile: the skyline from Figure 1, lying on its side beside the candles, its towers sitting exactly at heights you can trade. Four renderings dominate, in increasing order of information.
One — key levels. The minimalist version: horizontal lines at the handful of strikes that matter — call wall, put wall, and the zero-gamma flip (next episode’s whole subject). This is what circulates in screenshots, and it’s genuinely useful mid-session: three heights to keep on the chart, zero clutter. The cost: all the shape is thrown away. You see where the tallest towers are — not how tall, how lonely, or how crowded the neighborhood around them is.
Two — the exposure profile. The full skyline, rotated onto the price axis: one horizontal bar per strike, length proportional to estimated exposure, drawn beside the chart. Two conventions coexist, and they answer different questions. Gross, two-sided: call bars and put bars drawn separately (usually opposite directions or colors) — richer, because you see the composition of each level: a strike that’s all calls behaves differently from one where calls and puts pile together. Net, signed: one bar per strike, calls netted against puts — cleaner, because you see the balance at a glance. Same data, two lenses.
Three — the net gamma curve. Instead of bars per strike, sum the whole board’s estimated dealer gamma as a function of price: “if the index were here, aggregate gamma would be this.” The result is a single curve winding up the price scale — positive through one region, negative through another. It’s the most abstract rendering and the most conceptually loaded, because its shape tells you how the hedging regime would change as price travels — and the price where the curve crosses zero is the most quoted level on the entire map. Episode 9 is devoted to it.
Four — the heatmap. Add time: strikes on one axis, sessions on the other, brightness for exposure. Walls stop being lines and become bands — persisting for weeks, migrating as positions roll, going dark at expirations. It’s the only rendering that shows the map’s history, which is exactly what a single-morning snapshot can’t: whether today’s wall is an institution or a tourist.
None of these is “the right one”. Levels answer where do I pay attention today? The profile answers what does the neighborhood look like? The curve answers how does the regime change with price? The heatmap answers how is the geography evolving? A trader fluent in this map usually keeps the levels on the chart and consults the rest.

Figure 2 · Four drawings of the same board
The recipe behind every plot
One more layer of literacy, and it’s the one that saves you from Twitter arguments: two charts labeled “gamma profile” can disagree completely, and neither is broken. Building the map takes decisions, and every builder makes them differently.
Which expirations? All listed ones, the front month, or 0DTE only? Each is a defensible map of a different thing. Short-dated exposure carries far more gamma per contract (Episode 3) but dies by the close; a wall dominating the all-expiry view can be irrelevant intraday, and an intraday 0DTE wall can be invisible in the monthly picture. Net or gross? Whether calls and puts at the same strike cancel changes both the height and sometimes the sign of a level. Which units? Contracts of gamma versus dollar gamma per 1% move — dollar terms re-weight the whole skyline. Which inventory? Open-interest snapshots describe yesterday’s board; intraday volume estimates chase today’s flow; and every choice sits on top of the holder assumption we’ll dissect below.
The practical rule follows immediately: never read a wall without knowing the recipe that produced it. Same market, different kitchens, different maps — and now you know which questions to ask of any of them.
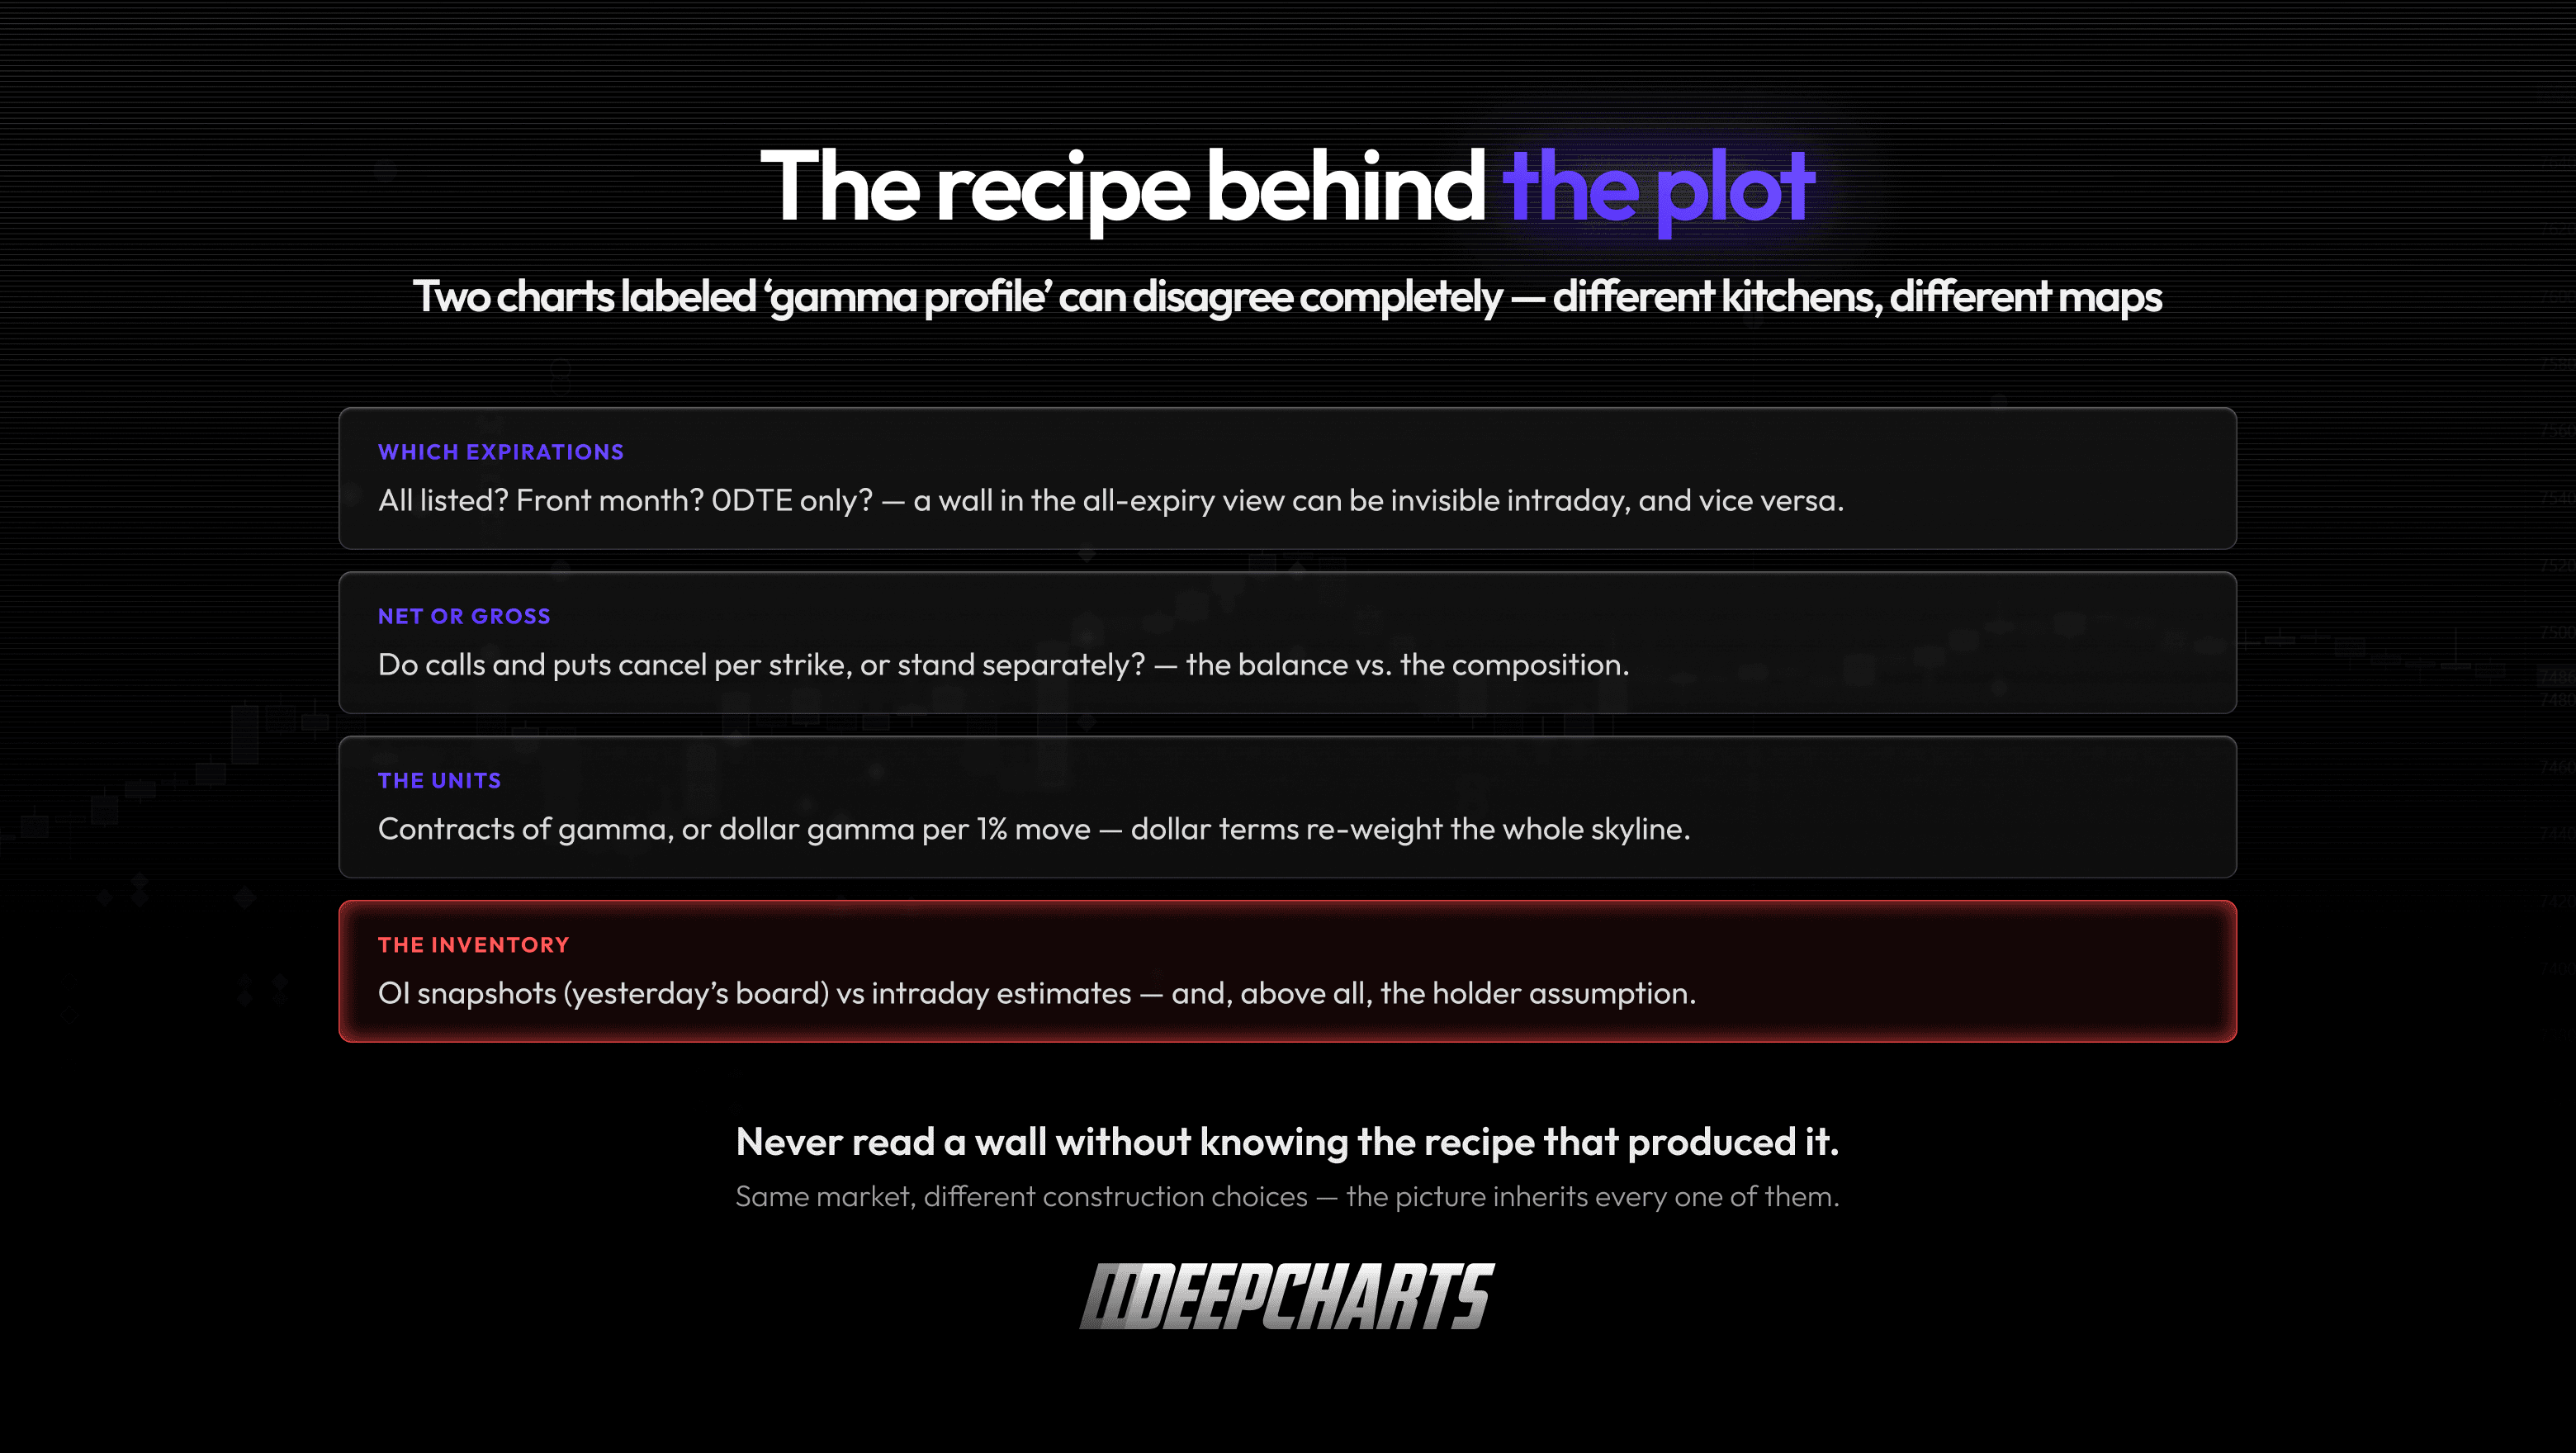
Figure 3 · The recipe behind the plot
How a call wall gets built
Walls aren’t placed by anyone. They accrete — as the by-product of thousands of unrelated decisions that happen to rhyme. Walk through the standard build, with the index at 6,000.
All year, income funds and covered-call programs sell calls above the market to collect premium — Episode 4’s rent collectors, working at industrial scale. They like round numbers and “safe” distances: 6,050 gets sold, again and again, by desks that have never met. Open interest piles up.
The dealers on the other side end up long those 6,050 calls — and long options means long gamma (Episode 3): at that strike, dealer books are in the counter-current seat. Now watch what their hedging does as price climbs from 6,000 toward 6,050. The calls’ delta grows — gamma is maximal near the strike — so dealer books get longer, automatically, tick by tick. Dealers don’t want the length. They sell futures into the rally, more aggressively the closer price gets to the concentration.
That’s the entire mechanism of a call wall: not an order sitting at 6,050, not an institution “defending” a level — a gradient of mechanical selling that steepens as price approaches the strike where long-gamma exposure piles up. The rally doesn’t hit a wall; it wades into progressively deeper mud.
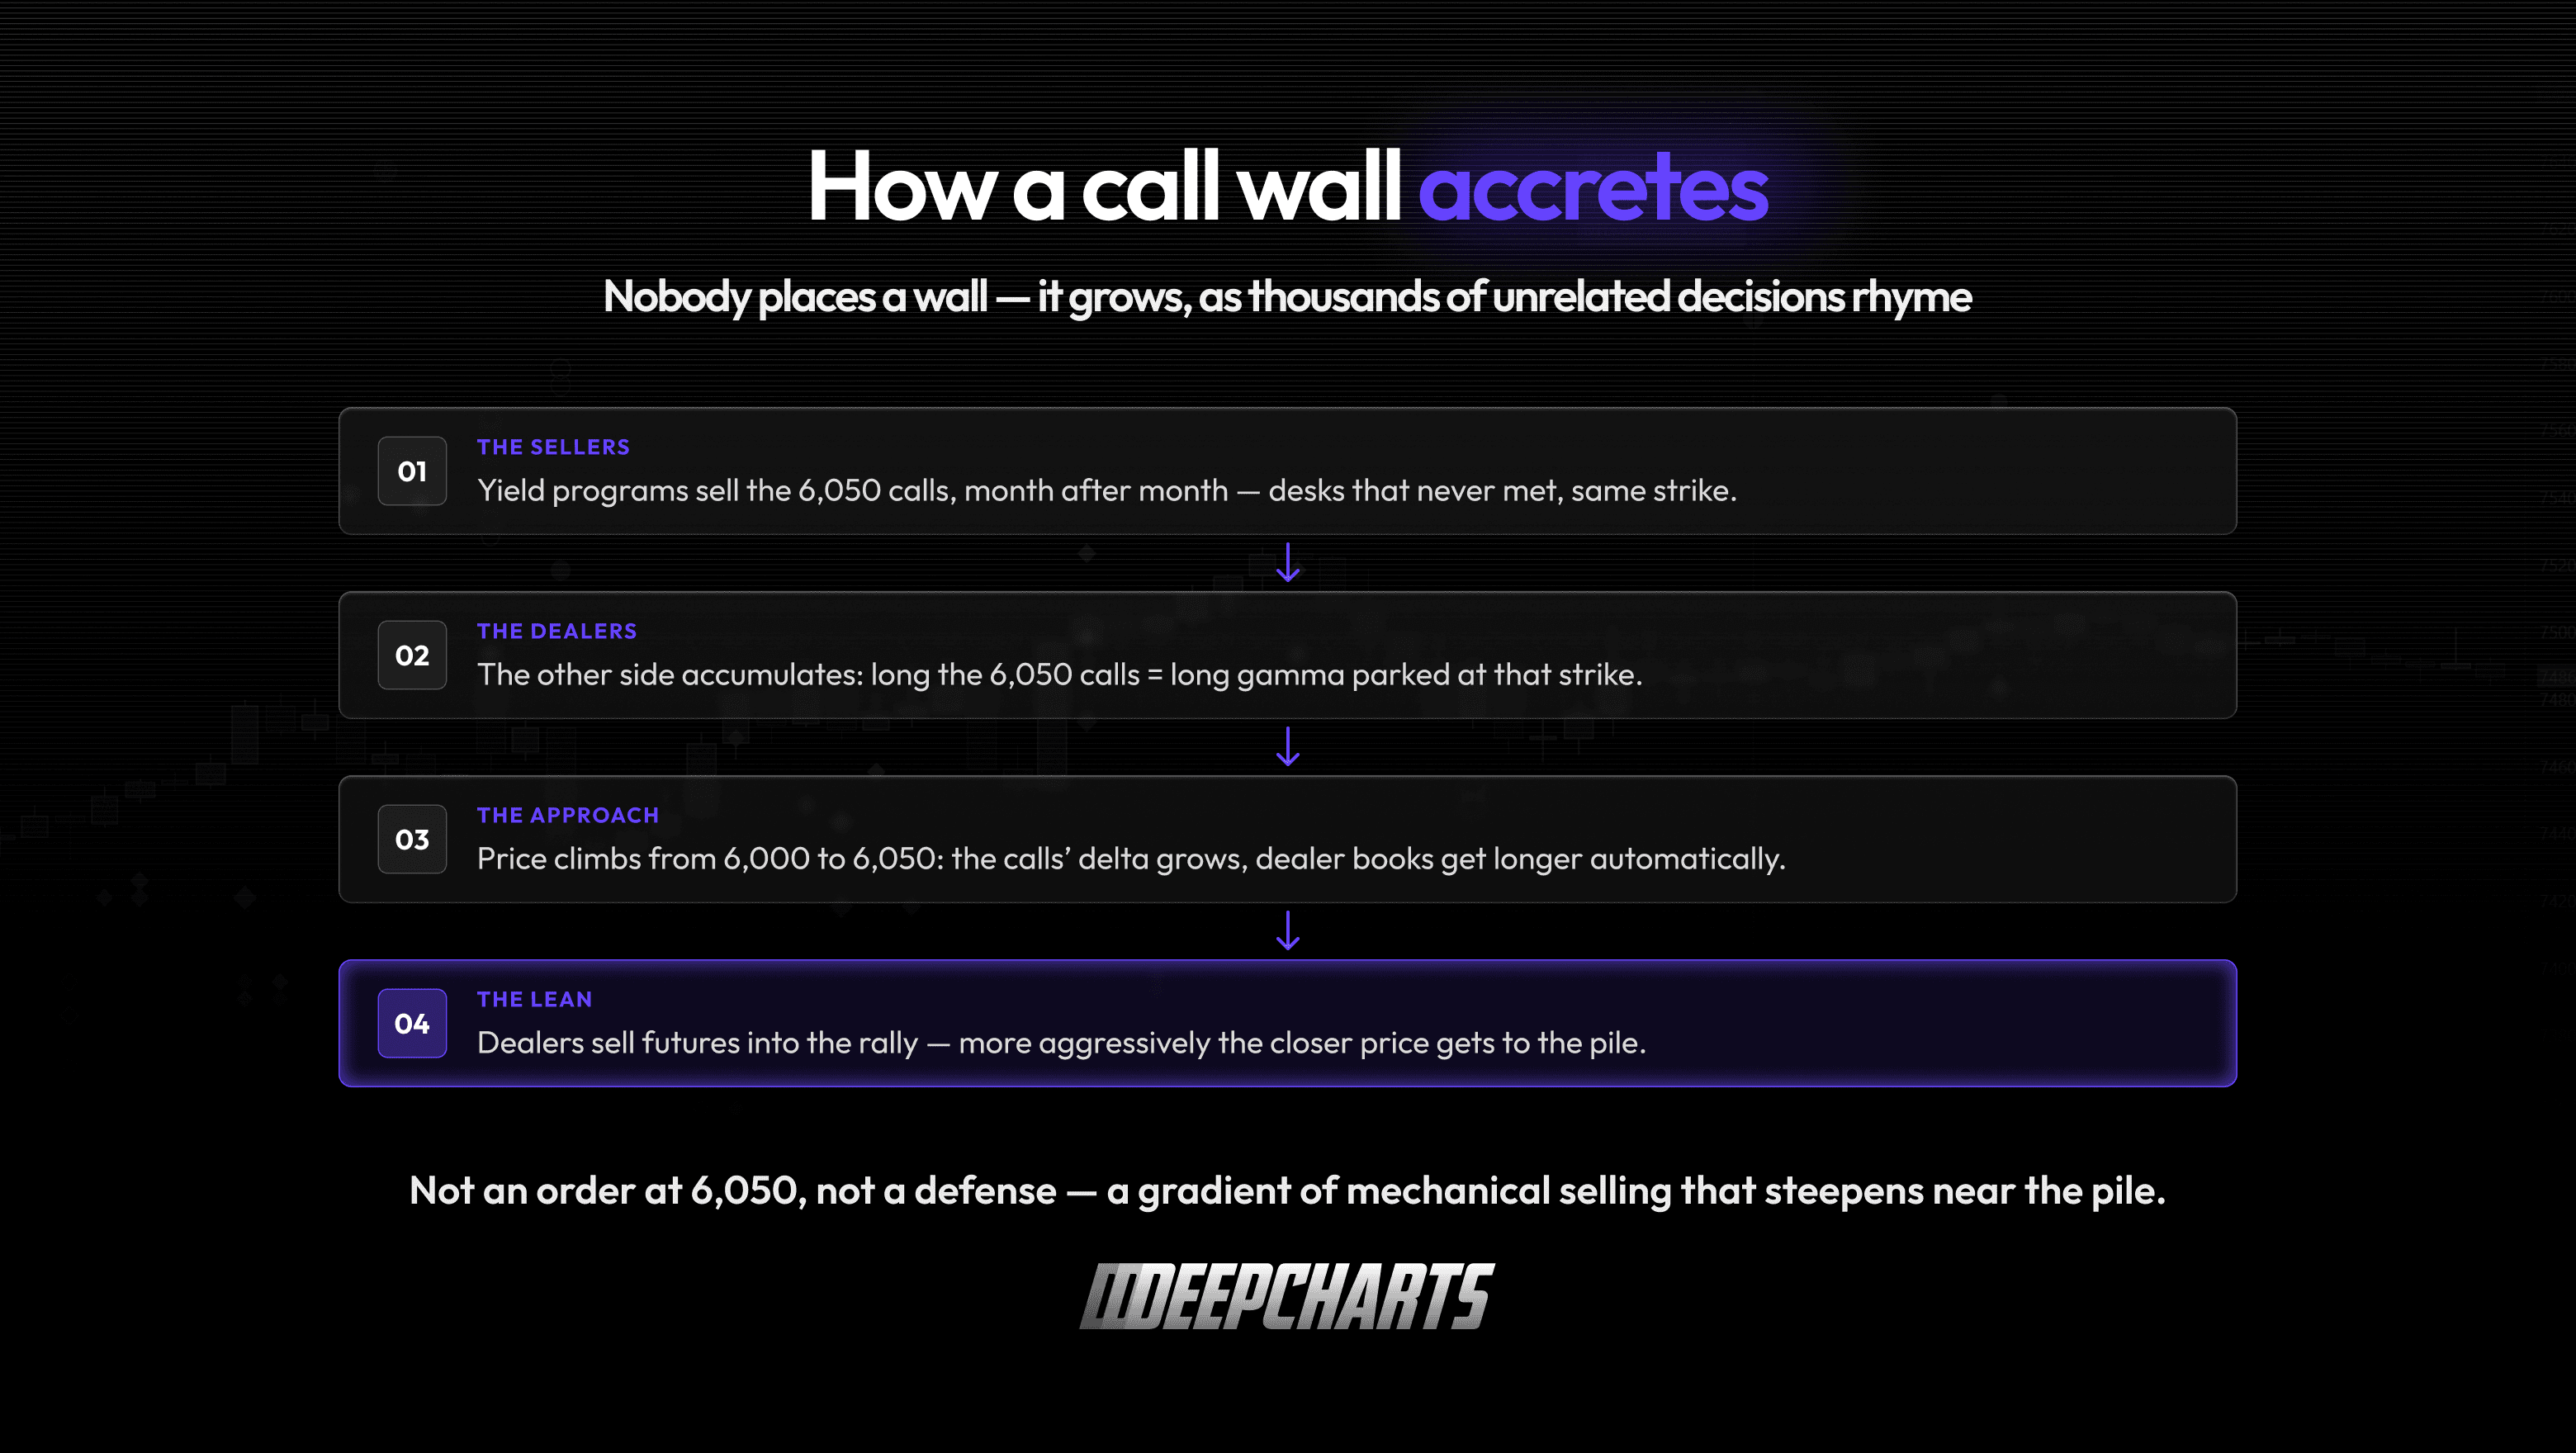
Figure 4 · How a call wall accretes
And here’s how this series teaches you to say it, precisely: a call wall marks a strike where the map shows concentrated exposure, with the estimated hedging pressure leaning against the move. That makes it a zone worth watching — not a level expected to reject price. How the tape behaves on arrival tells you more than the label ever will. Absorption appearing right where the mud should be? The map earned its keep. Price slicing through on expanding volume? Also information — about the flow, or about the map.
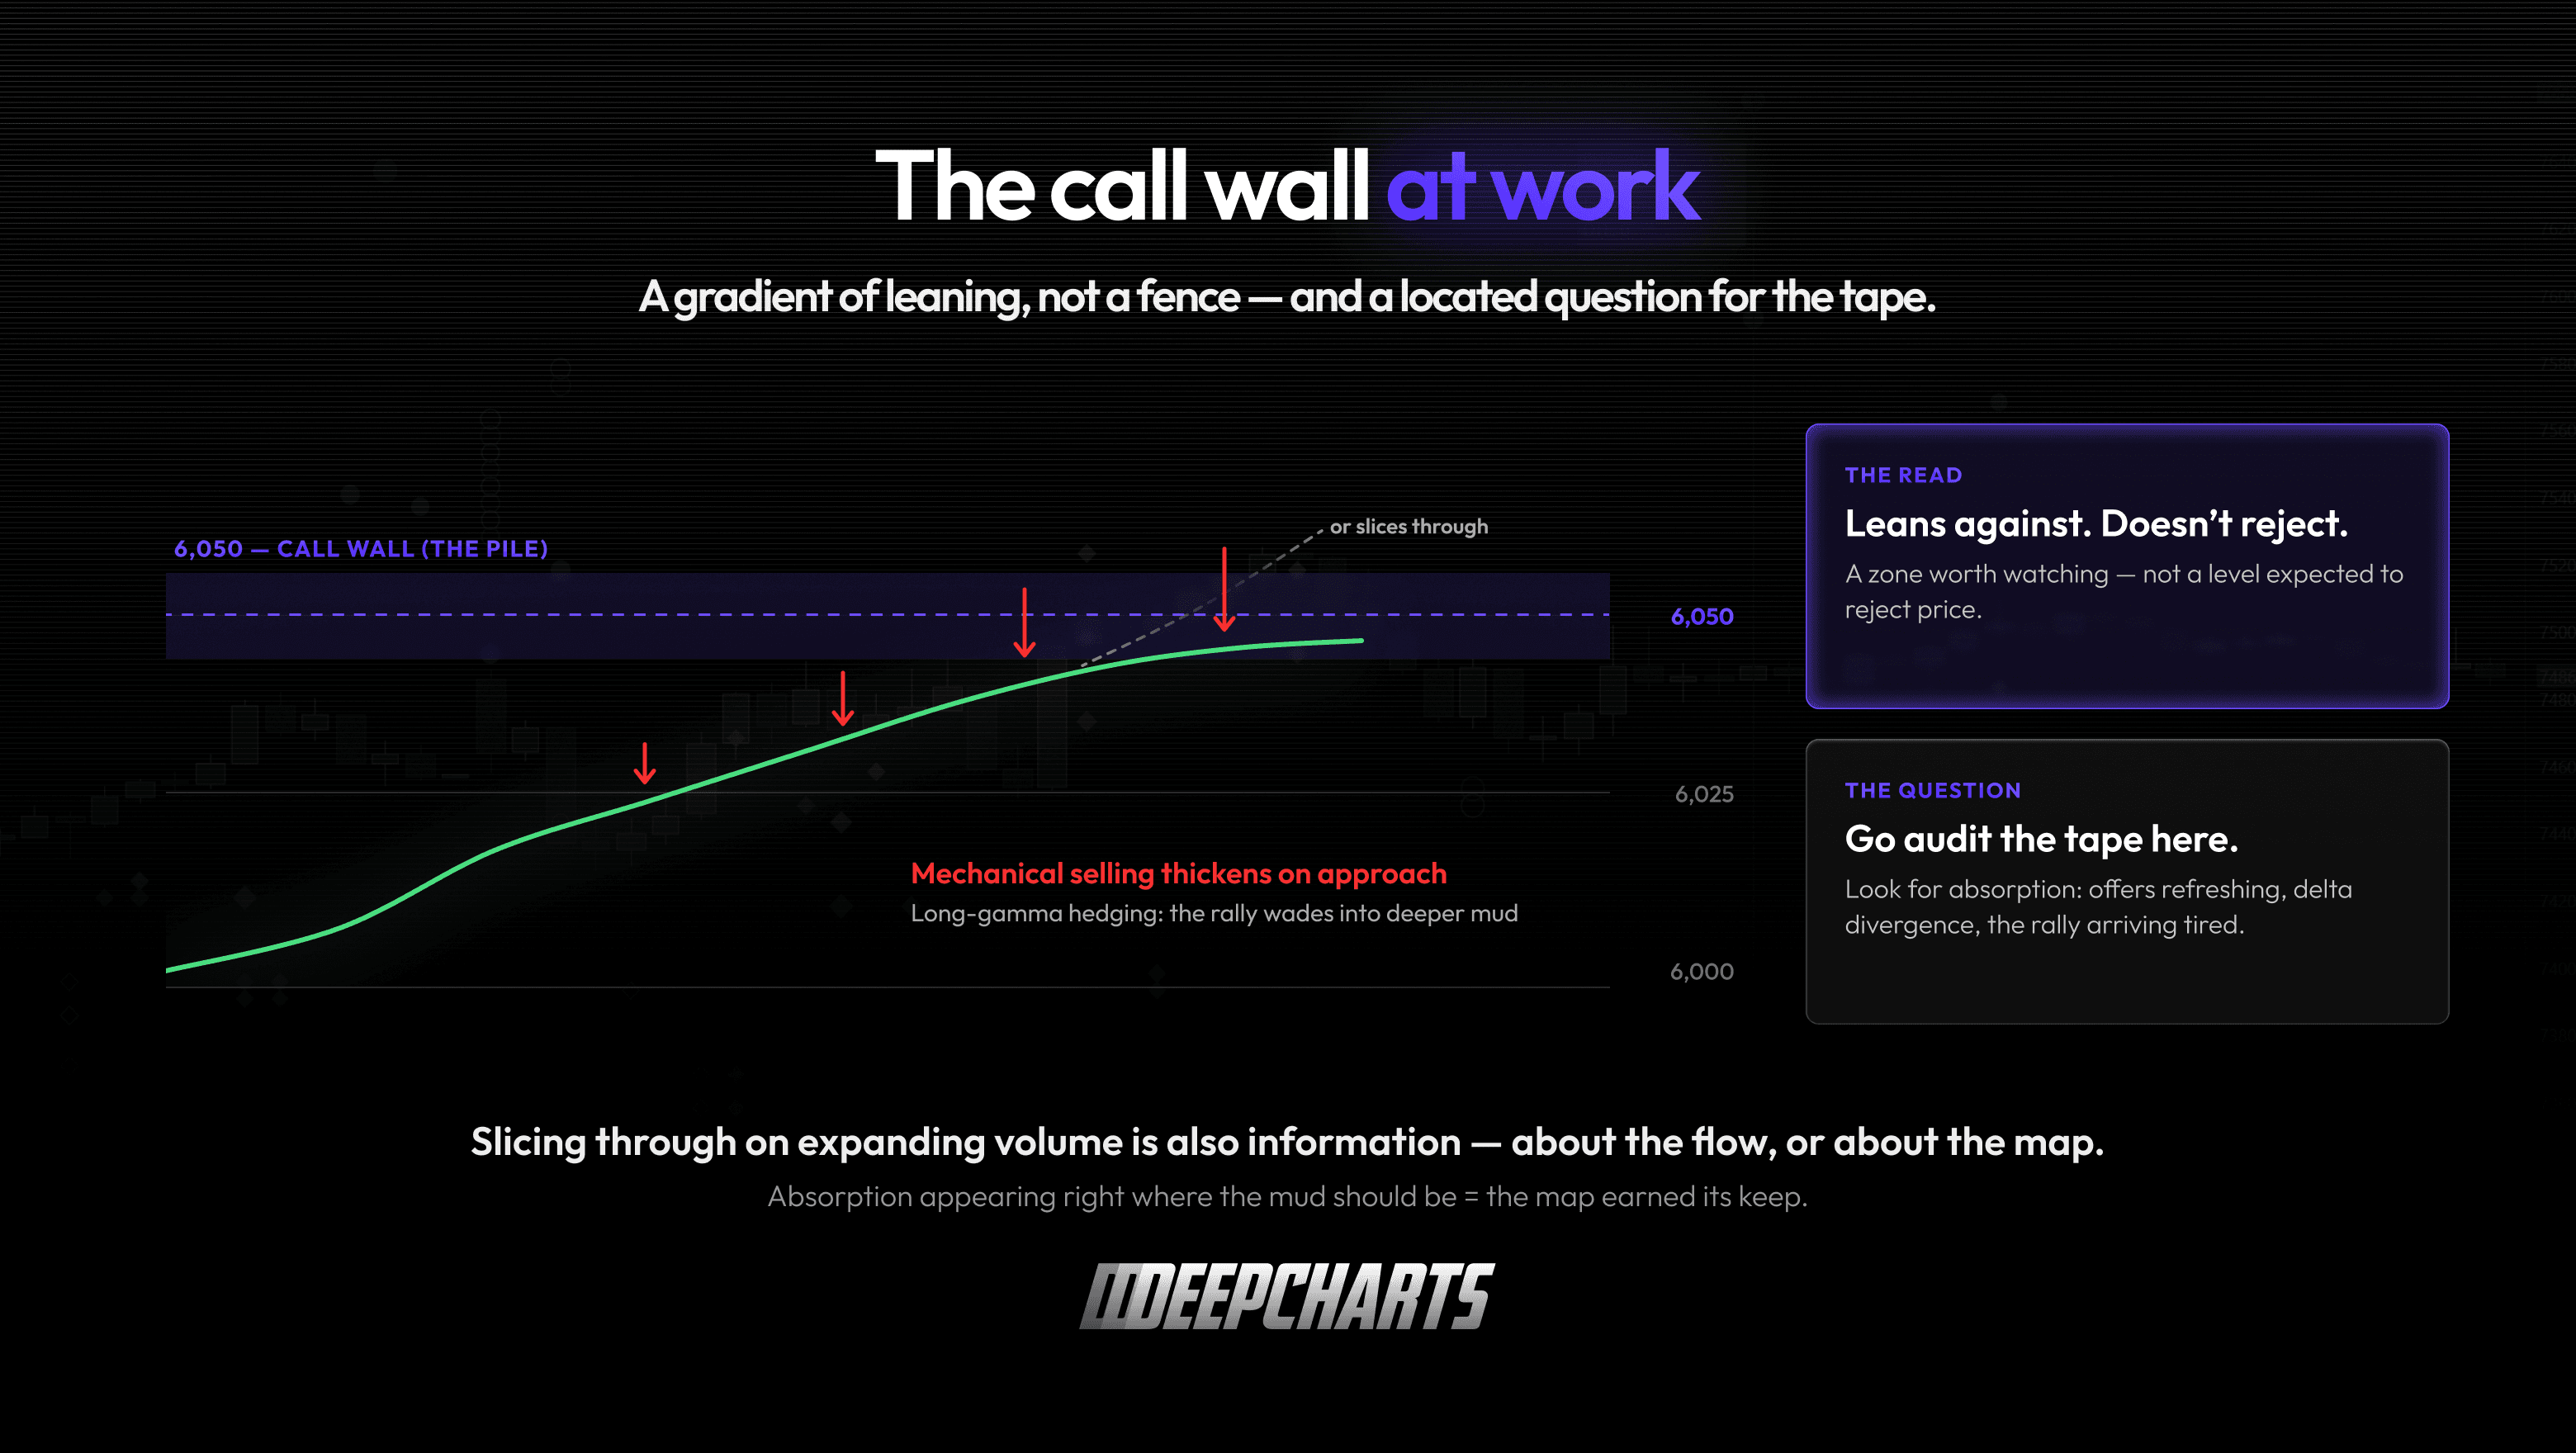
Figure 5 · The call wall at work
The put wall’s two faces
The put wall is where the folklore gets sloppy, because the standard story — “put wall = support” — flattens a mechanism that genuinely pulls in two directions. This is the most useful thing this article can teach you.
Face one: the accelerant. The put wall exists because protection buyers concentrated their puts at, say, 5,900 — which means dealers are typically short those puts: short gamma, the pro-cyclical seat. As price falls toward 5,900, those puts’ deltas deepen, dealer books get long faster than their hedges, and the fix is selling futures into the decline. Read that again: on pure gamma mechanics, the approach to a put wall is an amplification zone. It’s why breaks toward heavy put strikes so often feel like trapdoors — the mechanical flow is running with the fall, not against it. A put wall is not a net under the market. On the way down, it’s closer to a slope that steepens.
Face two: the stabilizer. So why does price so often finally stop at these strikes? Because two other flows switch on there. First, monetization: the funds that own those 5,900 puts didn’t buy them to hold to zero — they bought insurance, and at the strike the insurance is worth selling. When they take profits, dealers who were short those puts buy them back, shrink their short-gamma exposure, and buy back the futures they’d sold as hedge. Second, the quiet Greeks from Episode 7: panics that exhaust see implied vol come off its spike, and vanna turns dealer hedging into further buy-backs; each passing hour, charm bleeds the now-famous puts too. When the selling pressure exhausts, the reversal flows at a put wall can be violent — the same concentration that amplified the fall now fuels the snap-back.
Put the two faces together and the honest sentence writes itself: the put wall isn’t where the market bounces — it’s where the fight happens. Amplification into it, potential stabilization at it, and which face wins on a given day is decided on the tape, not on the map. What the map contributes is the address of the fight — which, if you’ve followed this series, you’ll recognize as everything a map can honestly promise.
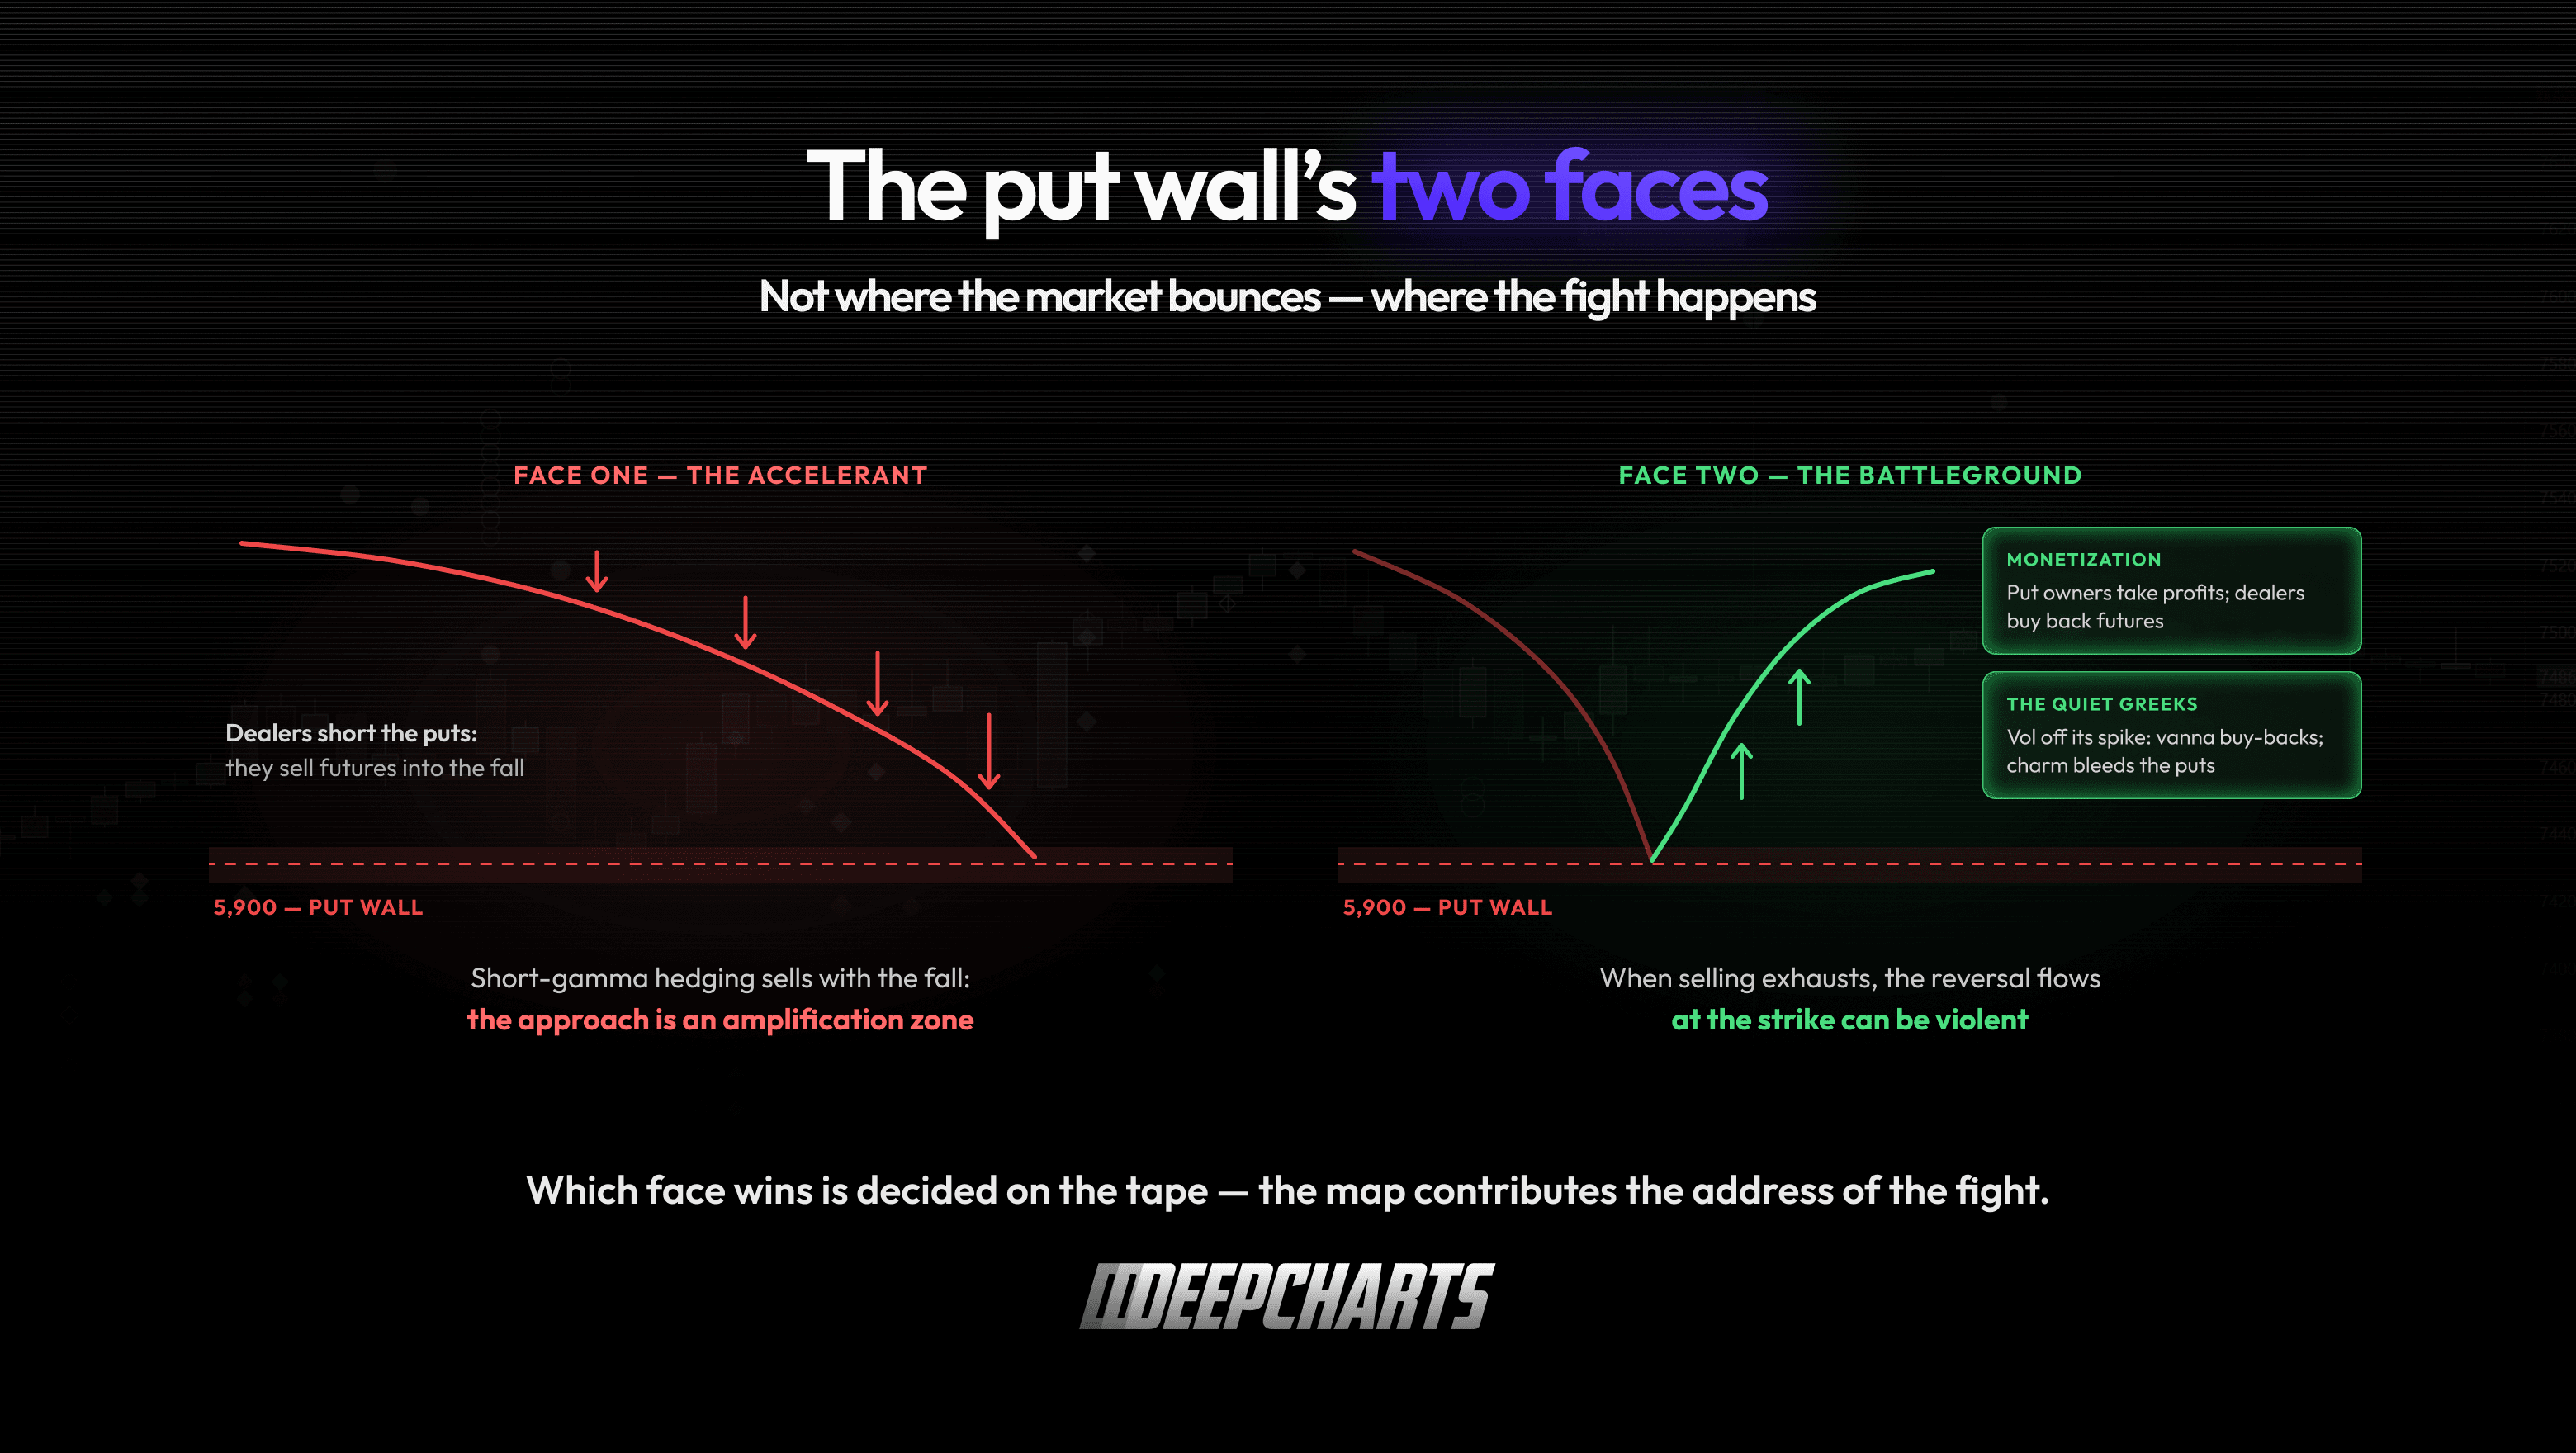
Figure 6 · The put wall’s two faces
The corridor: a session, pre-mapped
Assemble the pieces into the way a positioning-literate trader actually starts a morning. Index at 6,000. The map says: call wall 6,050, put wall 5,900, heavy open interest at both. Before the open, you already hold three structured expectations — all of them tendencies, all of them checkable:
Between the walls, dealer books (long gamma above via the calls, with the put-driven short gamma mattering more on approach below) lean toward dampening: pushes tend to get sold, dips tend to get bought, range behavior is the base case. Approaching 6,050, the mud thickens: this is where you go looking for absorption on the tape — offers refreshing, delta divergence, the rally arriving tired. You’re not fading it blind; you’re auditing a hypothesis at its address. Approaching 5,900, respect the two faces: expect acceleration risk into the strike, and watch for the monetization signature at it — the fight, not the floor.
None of this predicts the day’s direction — the oldest disclaimer in this series, and still the most important. What it does is convert a blank chart into a set of located questions. Traders who work this way aren’t asking “will the market go up?”; they’re asking “when price reaches the address where mechanical selling should live, does the tape actually show it?” That’s a question with an answer.
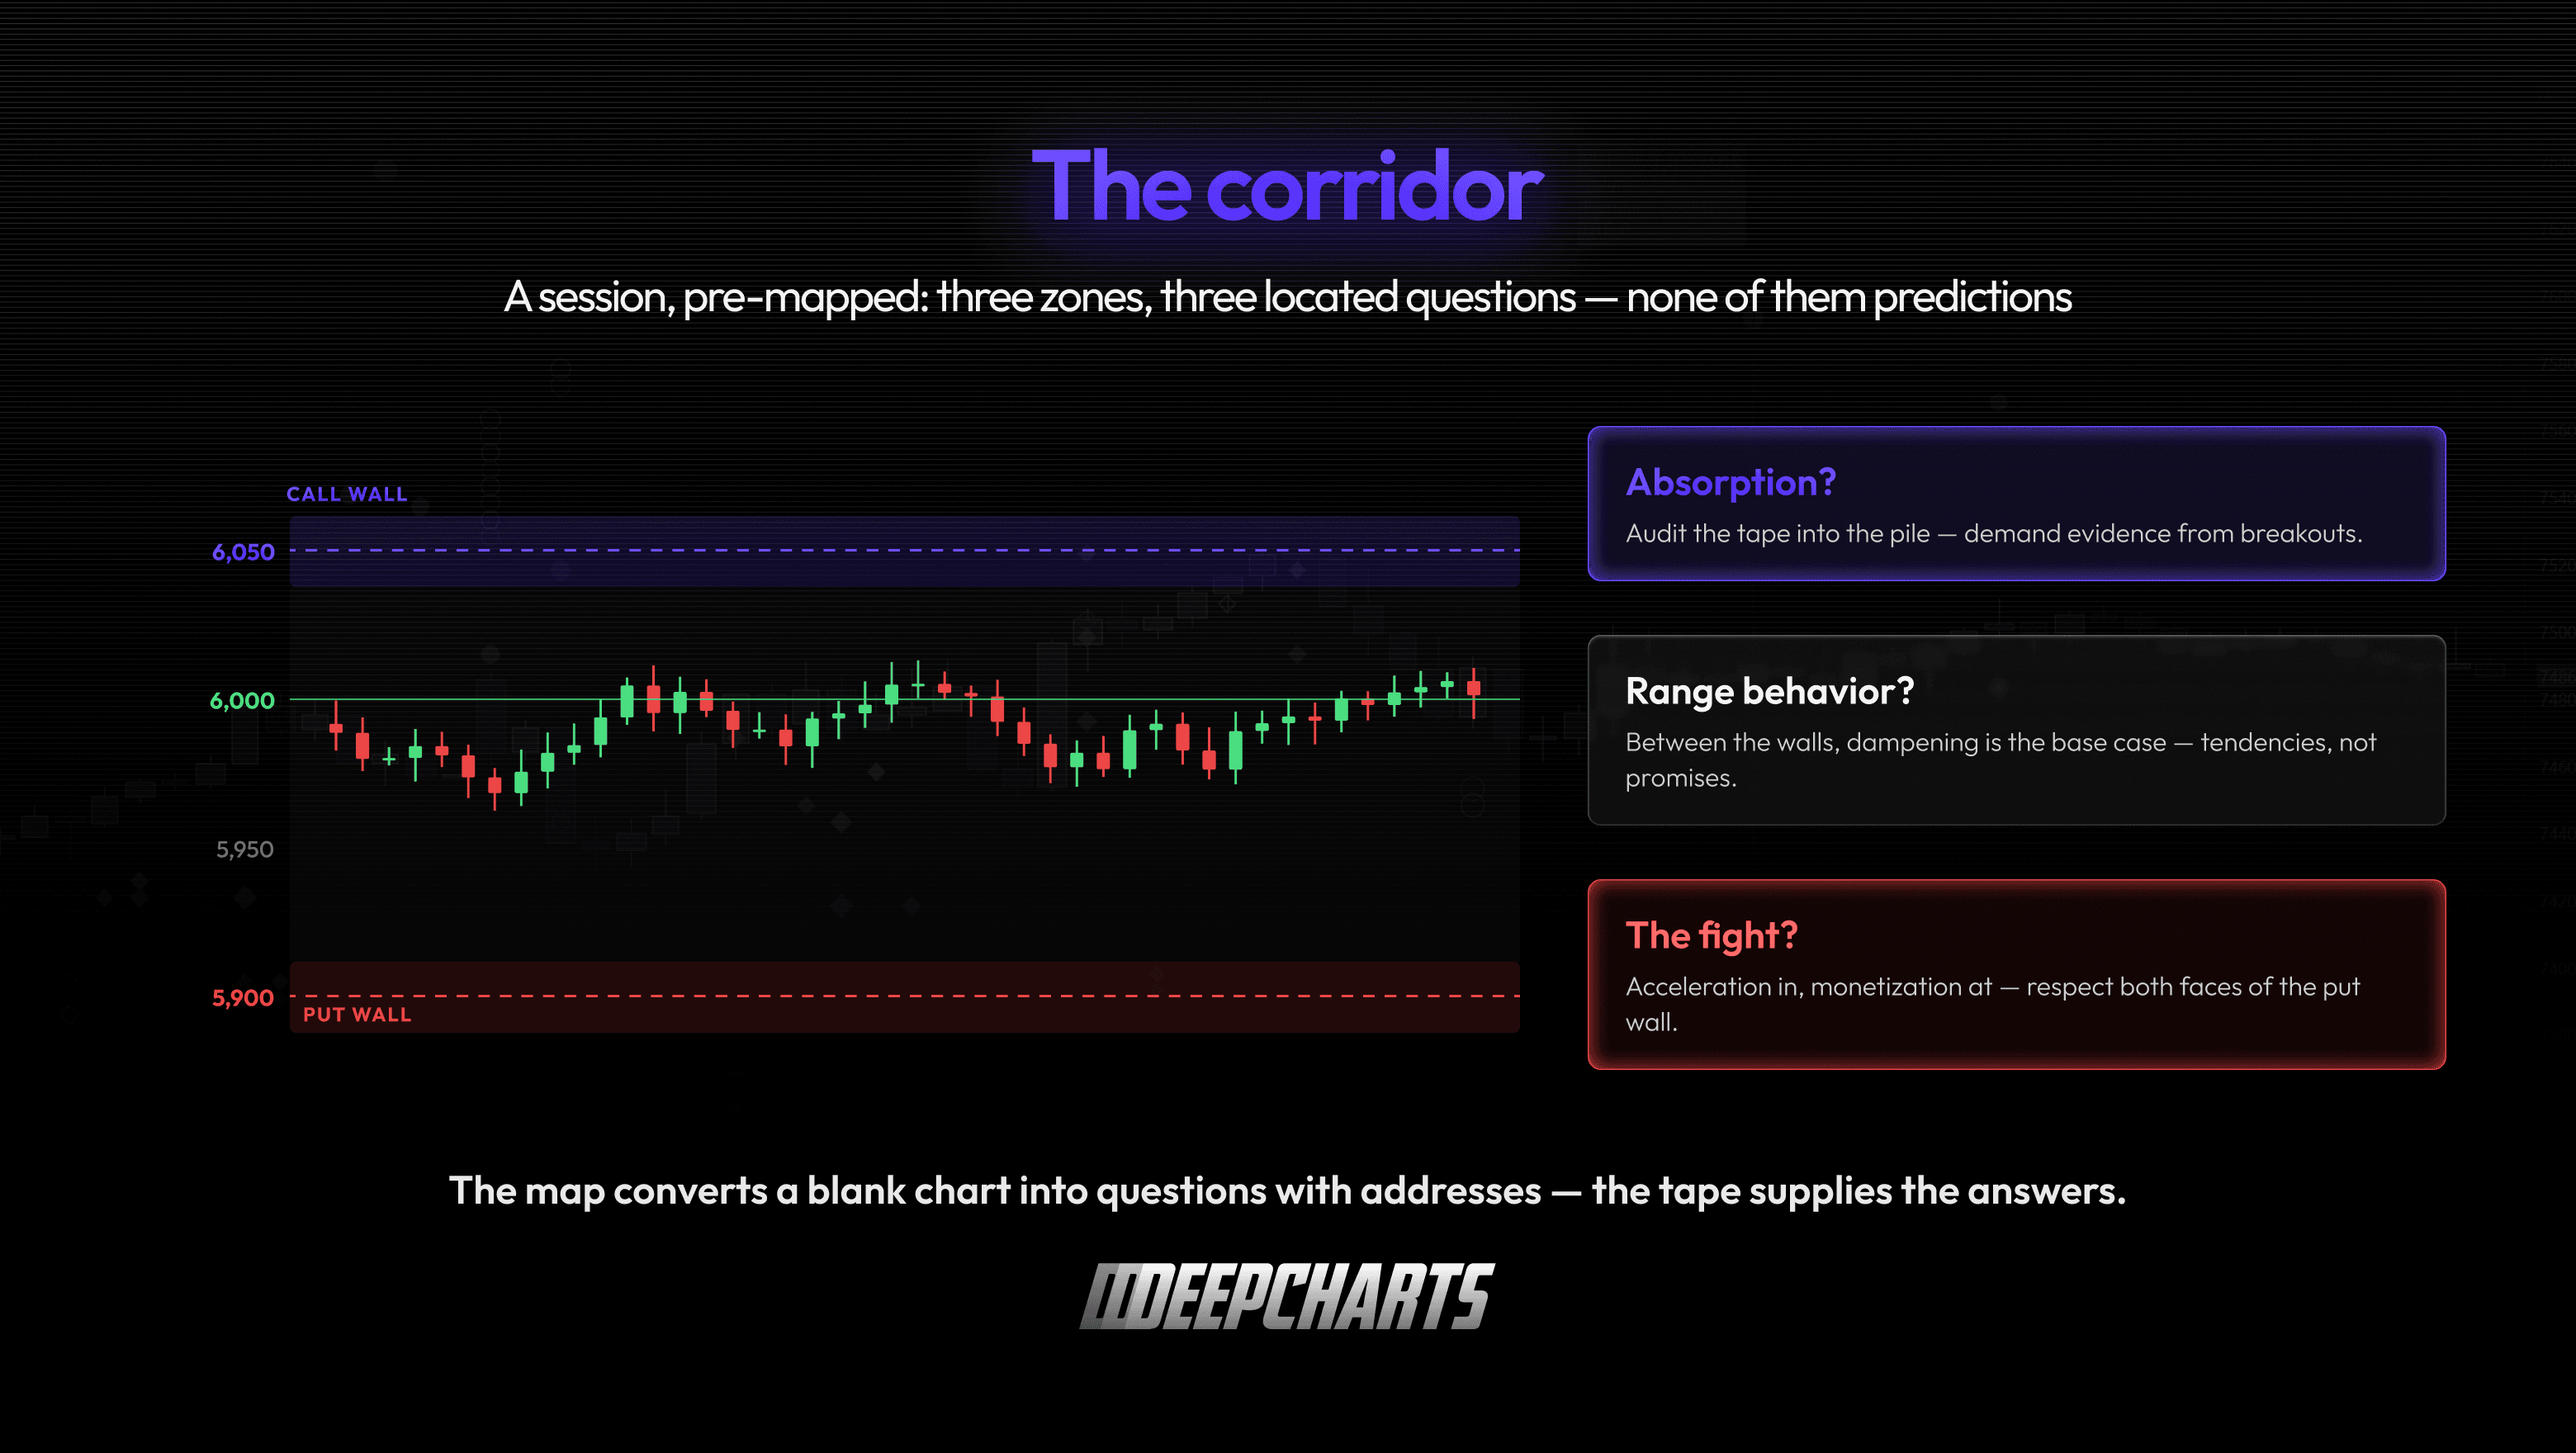
Figure 7 · The corridor
Walls move, walls expire, walls lie
Three properties keep wall-reading honest — skip these and the map becomes a superstition.
Walls are rebuilt daily. Open interest changes every session: positions roll, programs re-strike, new flow lands. Yesterday’s wall is a starting hypothesis, not an heirloom. And in the 0DTE era (Episode 3), intraday concentrations appear and vanish within hours — walls with a lifespan of a lunch break, invisible on any morning screenshot.
Expiration clears the board. At OPEX, the towers you’ve been watching all month simply leave (Episode 4). Exposure gets removed, rolled or replaced, and the skyline can look completely different on Monday. The days after big expirations are precisely when old walls stop mattering and the market has to renegotiate its geography.
And the sign of a wall depends on who’s holding. Here is the load-bearing assumption, out in the open. Everything above assumed the classic pattern — public sells the calls, buys the puts, dealers hold the mirror. That’s the industry-standard convention, and it’s built on a stated assumption about behavior that is usually reasonable at index level and on monthly tenors. But it remains an assumption, and it’s most fragile exactly where modern flow lives: on 0DTE, positioning builds and unwinds within hours, and no static rule about who is holding what survives the session. Get the holder wrong and the wall doesn’t weaken — it changes sign. A strike you read as a dampening zone may actually be an acceleration zone. The most dangerous wall isn’t the one that fails; it’s the one you had backwards.
So the full chain behind every wall on every screenshot: open interest is observed (published, real). The holder’s side is assumed — or, with better data, estimated. The gamma is modeled. And the behavior at the level is a hypothesis. The wall inherits the weakest link in that chain — worth remembering every time a level arrives on your feed wearing more confidence than its inputs deserve.
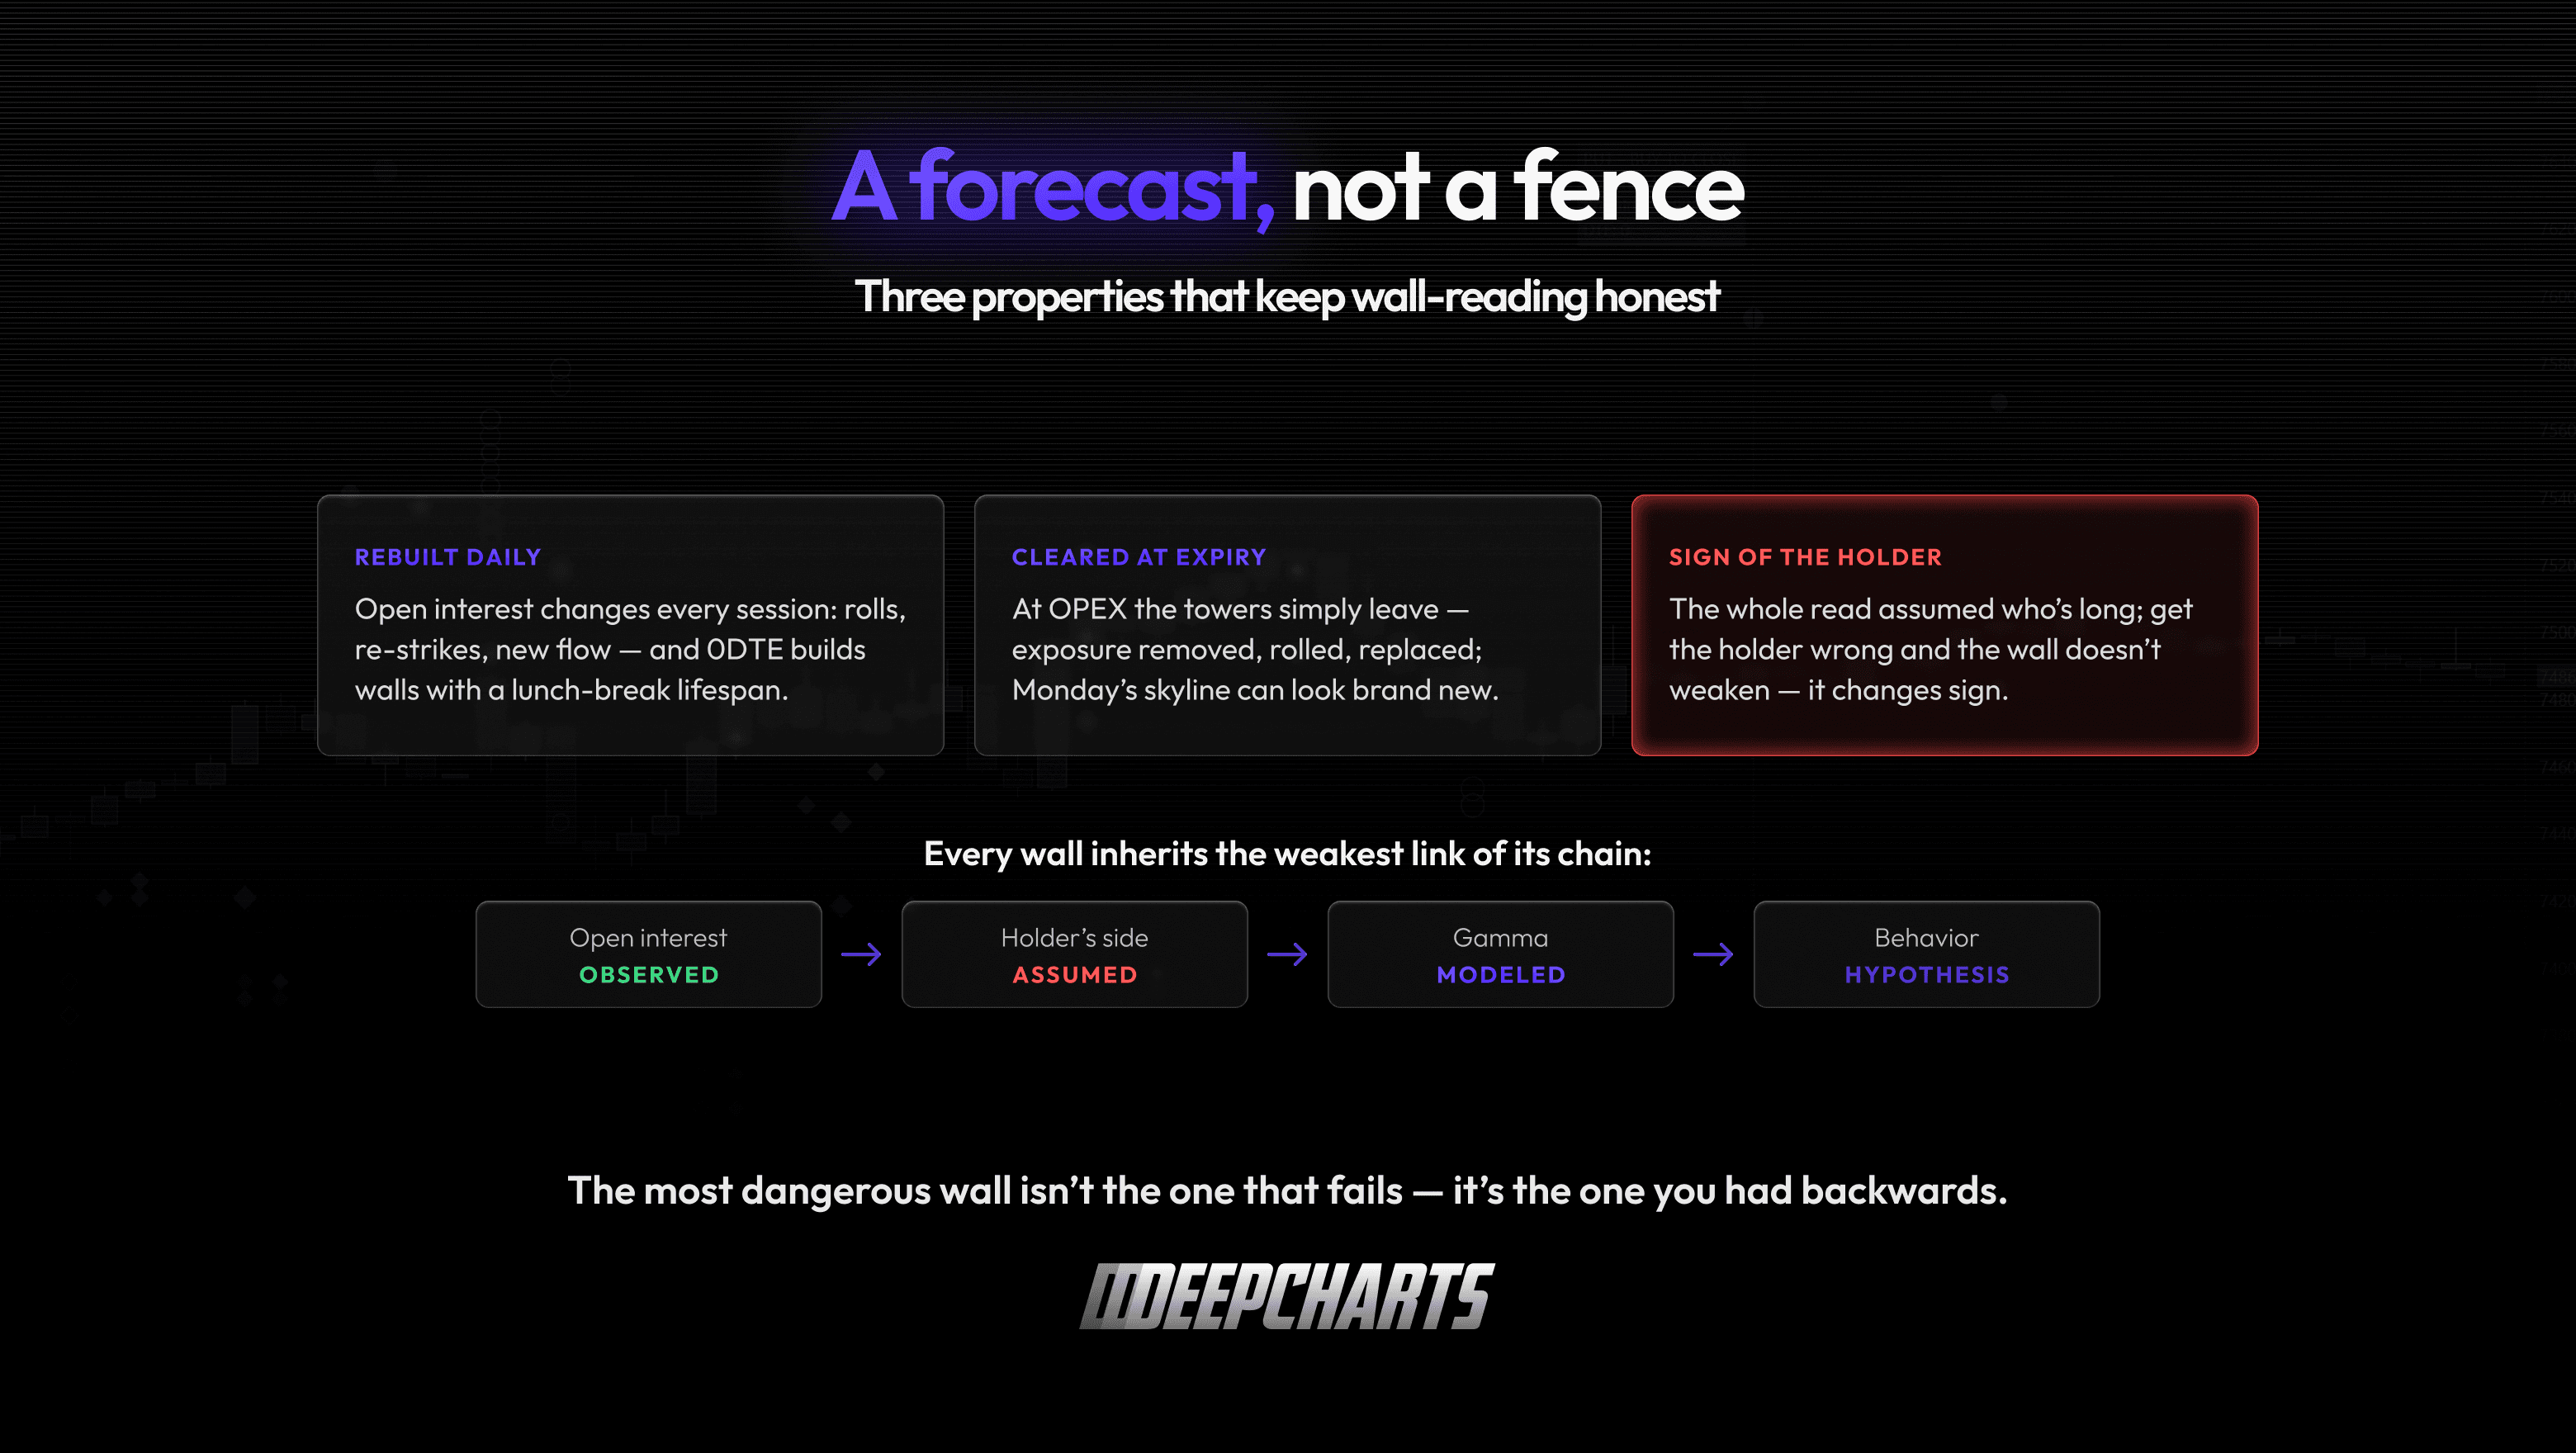
Figure 8 · A forecast, not a fence
Why futures traders care
If you trade index futures, walls matter for one compact set of reasons — all of them variations on knowing where to pay attention.
They pre-locate the fights. The corridor’s edges are where mechanical flow should thicken — where absorption tests, failed breakouts and trapdoor breaks disproportionately live. Arriving at those prices with your full attention (and smaller size) is a structural edge over arriving at random ones.
They calibrate breakout skepticism asymmetrically. A push into a heavy call wall carries a mechanical headwind — breakouts there tend to need real flow to survive, so demand more evidence from the tape. A break toward a heavy put wall carries a mechanical tailwind — moves there tend to extend, so fading them early is fighting the current with the current’s own map in your hand.
They explain the pins. Into expiry, with charm and gamma both peaking (Episodes 4 and 7), price grinding around a monster strike for an afternoon isn’t mysterious — it’s consistent with hedging flow leaning against every excursion from a level where exposure towers.
And they price the map correctly. Walls are context — the estimated geography of forced flow. The trade decision still belongs to the tape: who absorbs, who initiates, what happens at the address. A map that tells you where to look is worth a great deal. A map you obey blind is worth less than no map at all.
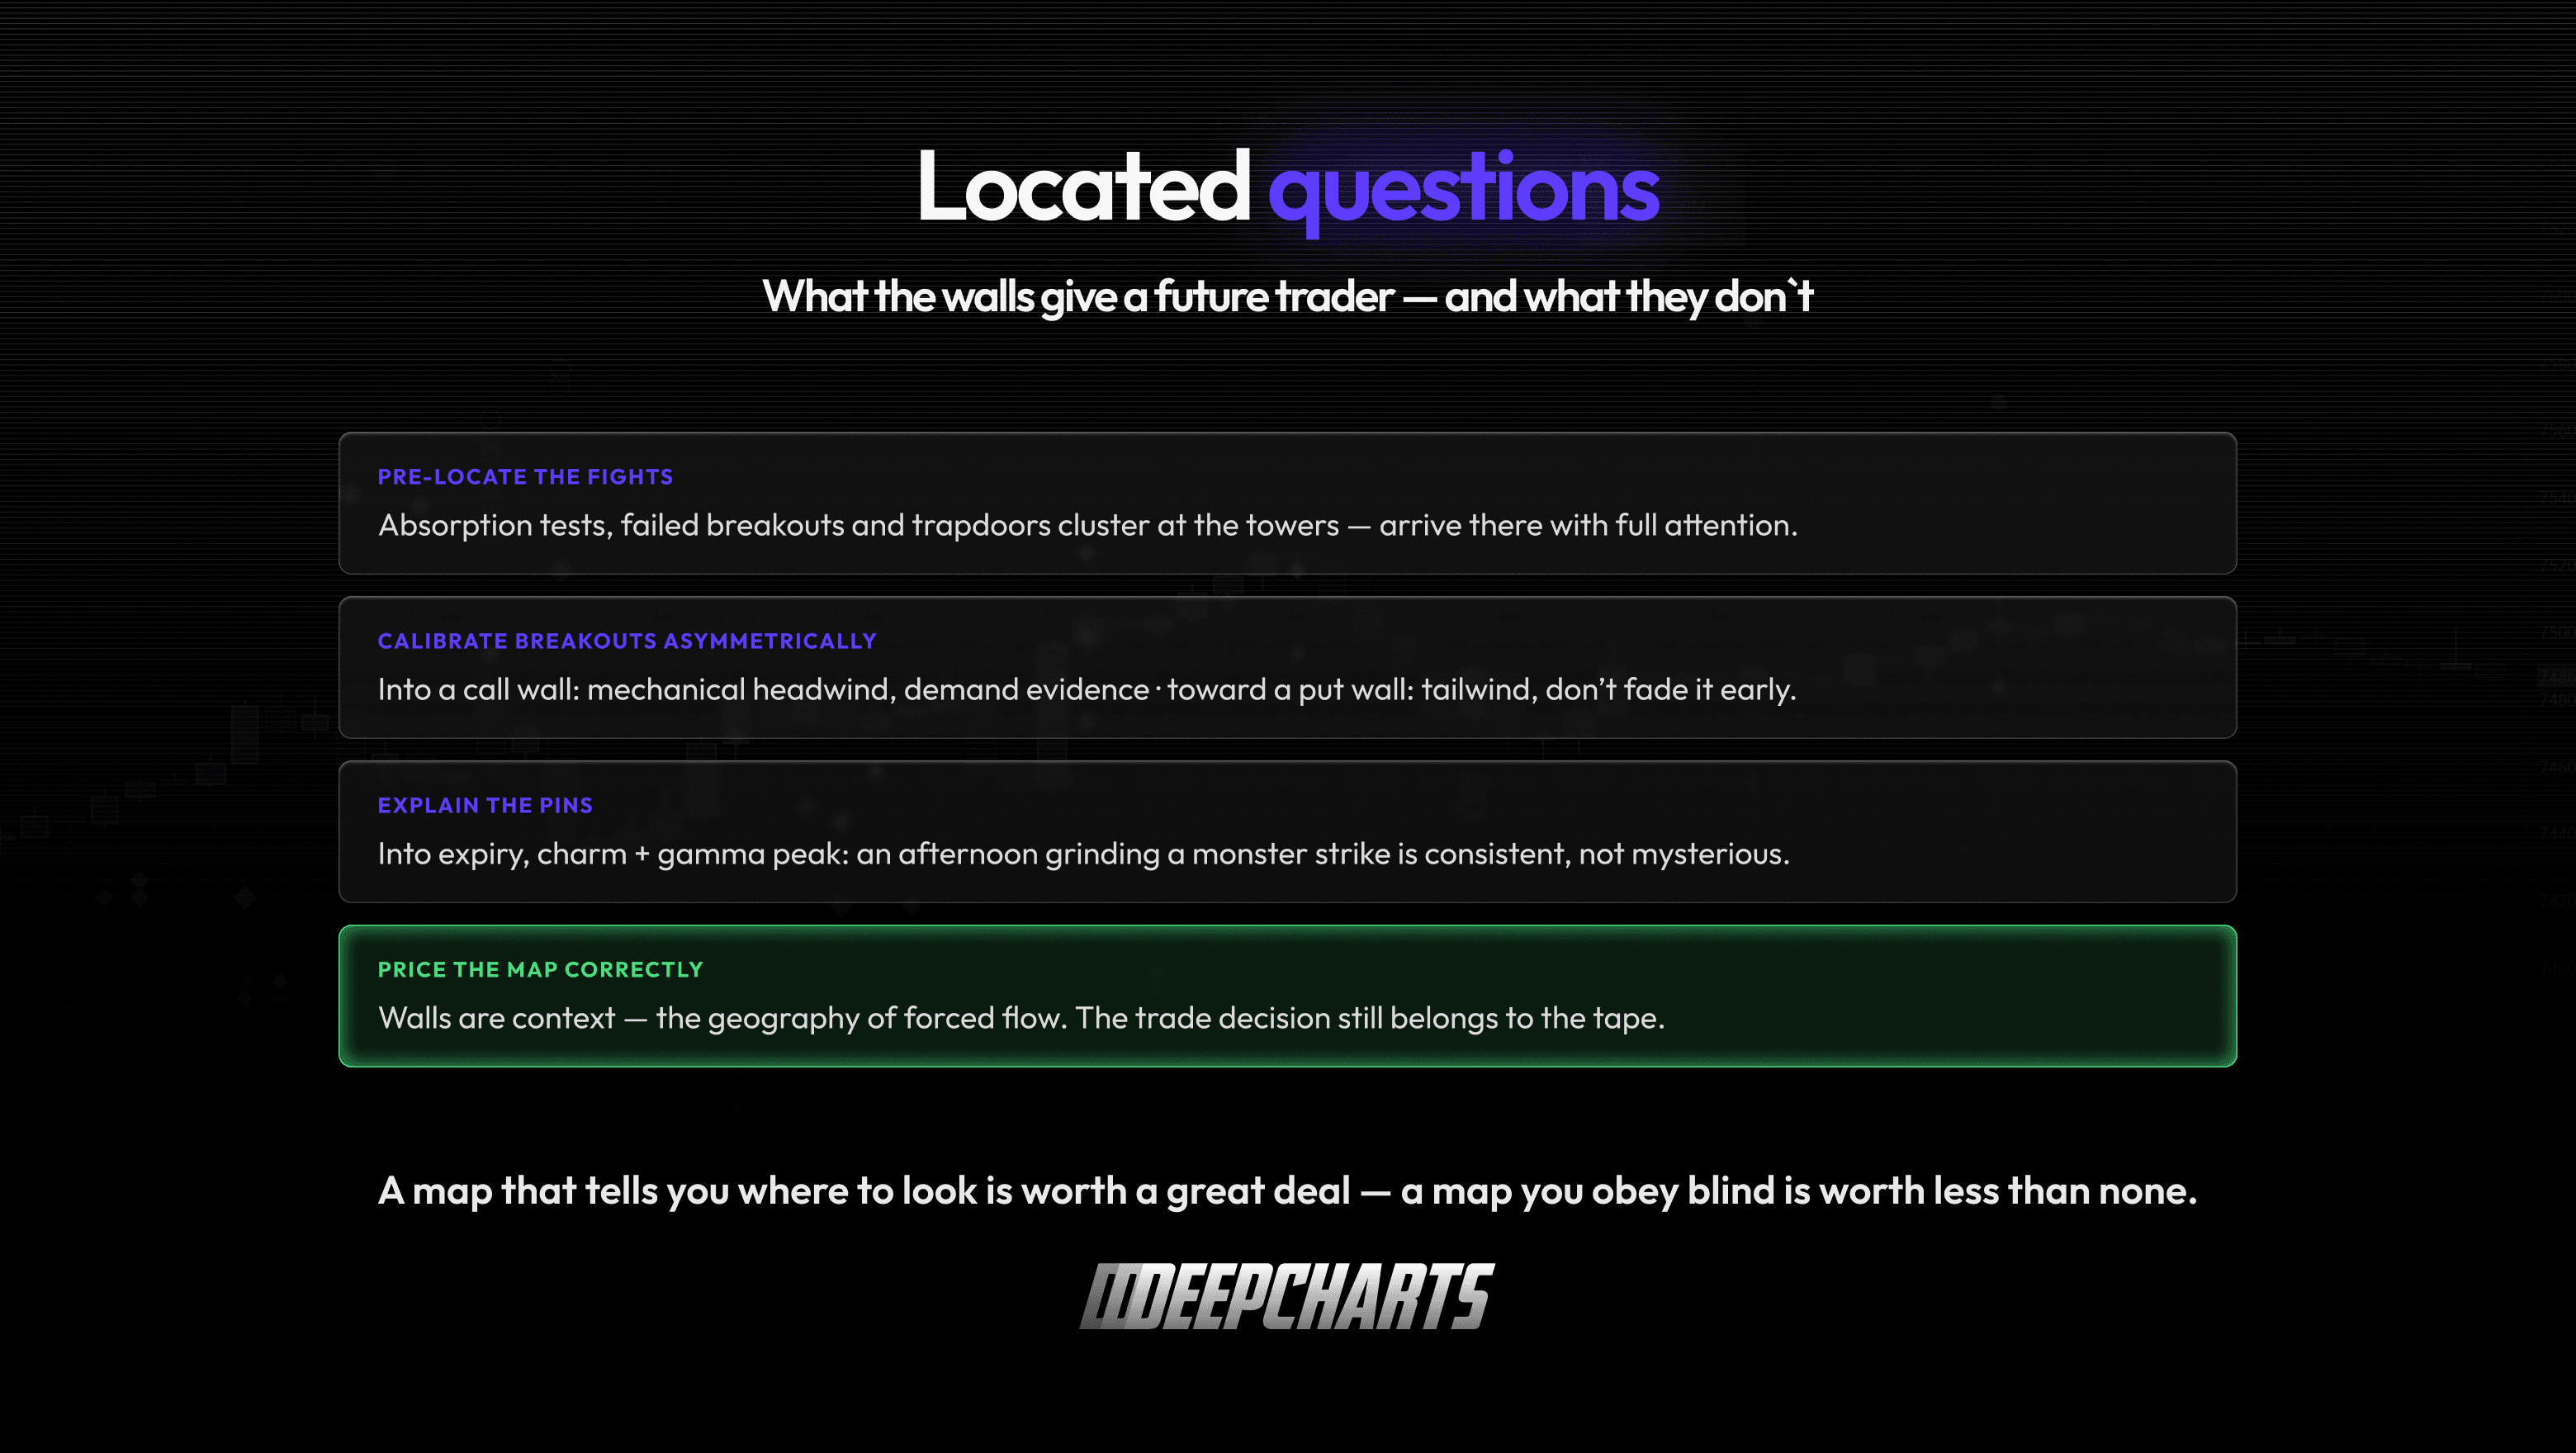
Figure 9 · Located questions
FAQ
What is a call wall?
The strike above the market with the largest concentration of call open interest and estimated dealer gamma exposure. As price approaches it, dealer hedging (typically long gamma there) tends to lean against the advance — making it a zone worth watching, not a level expected to reject price.
What is a put wall?
The mirror image below the market: the strike with the heaviest put concentration. Mechanics pull both ways there — dealer short-gamma hedging can amplify moves into it, while put monetization and post-spike vol effects can stabilize price at it. It marks where the fight happens, not a guaranteed floor.
Is the put wall a support level?
Not in the naive sense. The approach to it is often an acceleration zone; the strike itself is where stabilizing flows (profit-taking on puts, vanna buy-backs) can switch on. Whether “support” appears is decided on the tape, day by day.
Why do walls sometimes fail completely?
Because the leaning flow was overwhelmed by real directional flow, because the positioning changed since the map was drawn, or because the holder assumption was wrong — in which case the wall’s effect may have had the opposite sign all along.
Do walls move during the day?
Yes. Open interest is rebuilt daily, positions roll, and 0DTE flow can create meaningful intraday concentrations that appear and vanish within hours. Expirations clear the board entirely.
How are call and put walls calculated?
From published open interest per strike, an assumption (or estimate) of which side dealers hold, and a model turning contracts into gamma exposure. Observed, assumed, modeled — in that order — which is why walls are best treated as hypotheses with addresses.
Episode 9 goes to the single most-quoted level on the whole map — zero gamma, the flip line where the market’s regime is supposed to change — and asks the uncomfortable question: whose map are you trusting to draw it?
Deepcharts Team
·
Share this on
