Indicators
Updated:
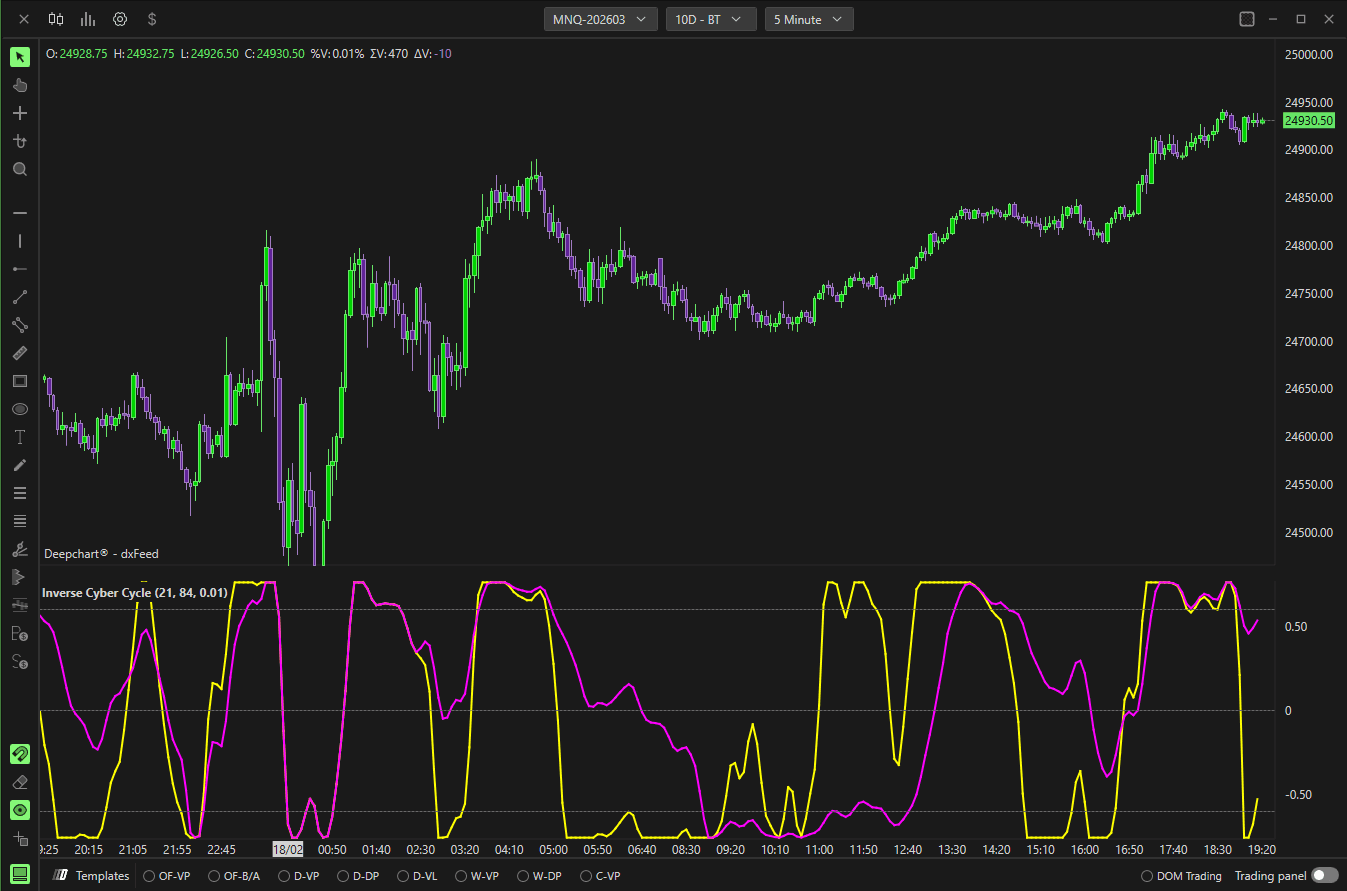
The Inverse Cyber Cycle is a cycle-based oscillator designed to identify turning points and cyclical momentum shifts.
It plots two cycle lines:
Cycle A – Faster cycle
Cycle B – Slower cycle
The indicator oscillates around a zero level.
Settings
Chart Area
Horizontal – Displays the oscillator in a separate panel.
Vertical – Displays vertically (if supported).
Panel selector – Chooses which panel the indicator appears in.
Use sec. axis – Enables secondary scaling.
Parameters
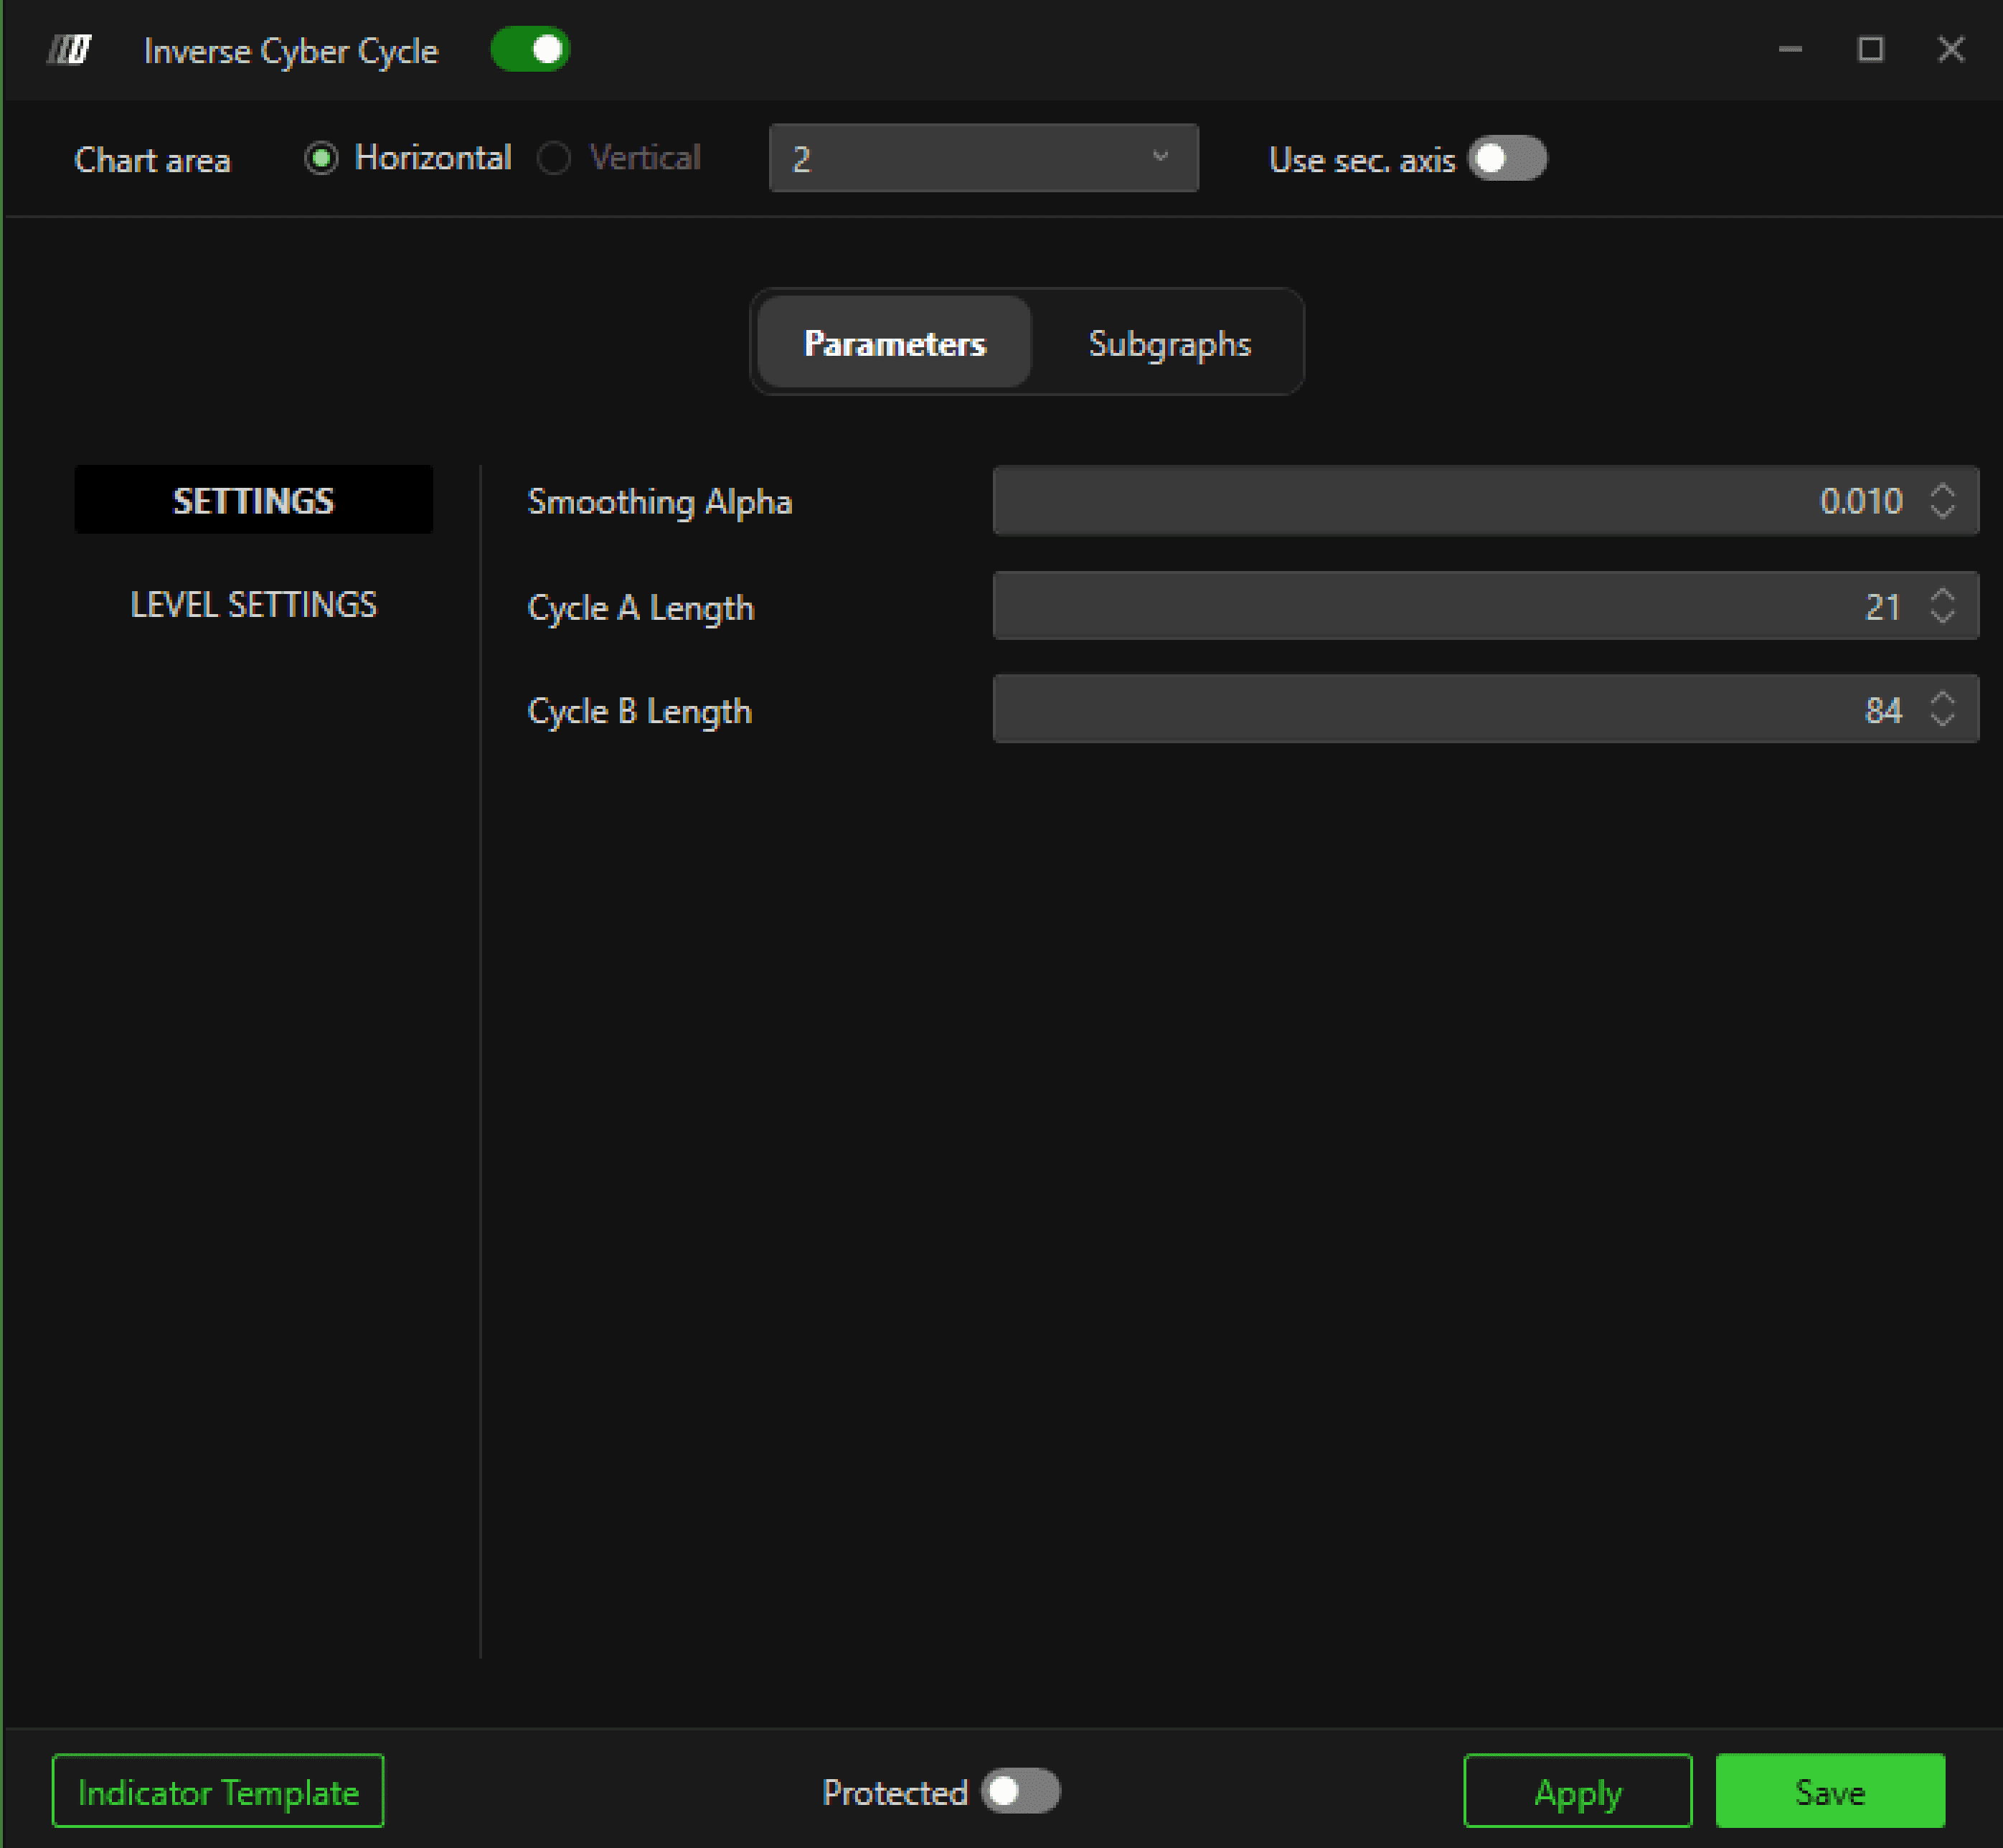
Smoothing Alpha
Controls how aggressively the cycle is smoothed.
Lower values = smoother but slower reaction.
Higher values = faster but more sensitive.
Cycle A Length
Defines the period of the faster cycle.
Shorter length reacts quicker to price swings.
Cycle B Length
Defines the period of the slower cycle.
Longer length captures broader market rhythm.
Level Settings
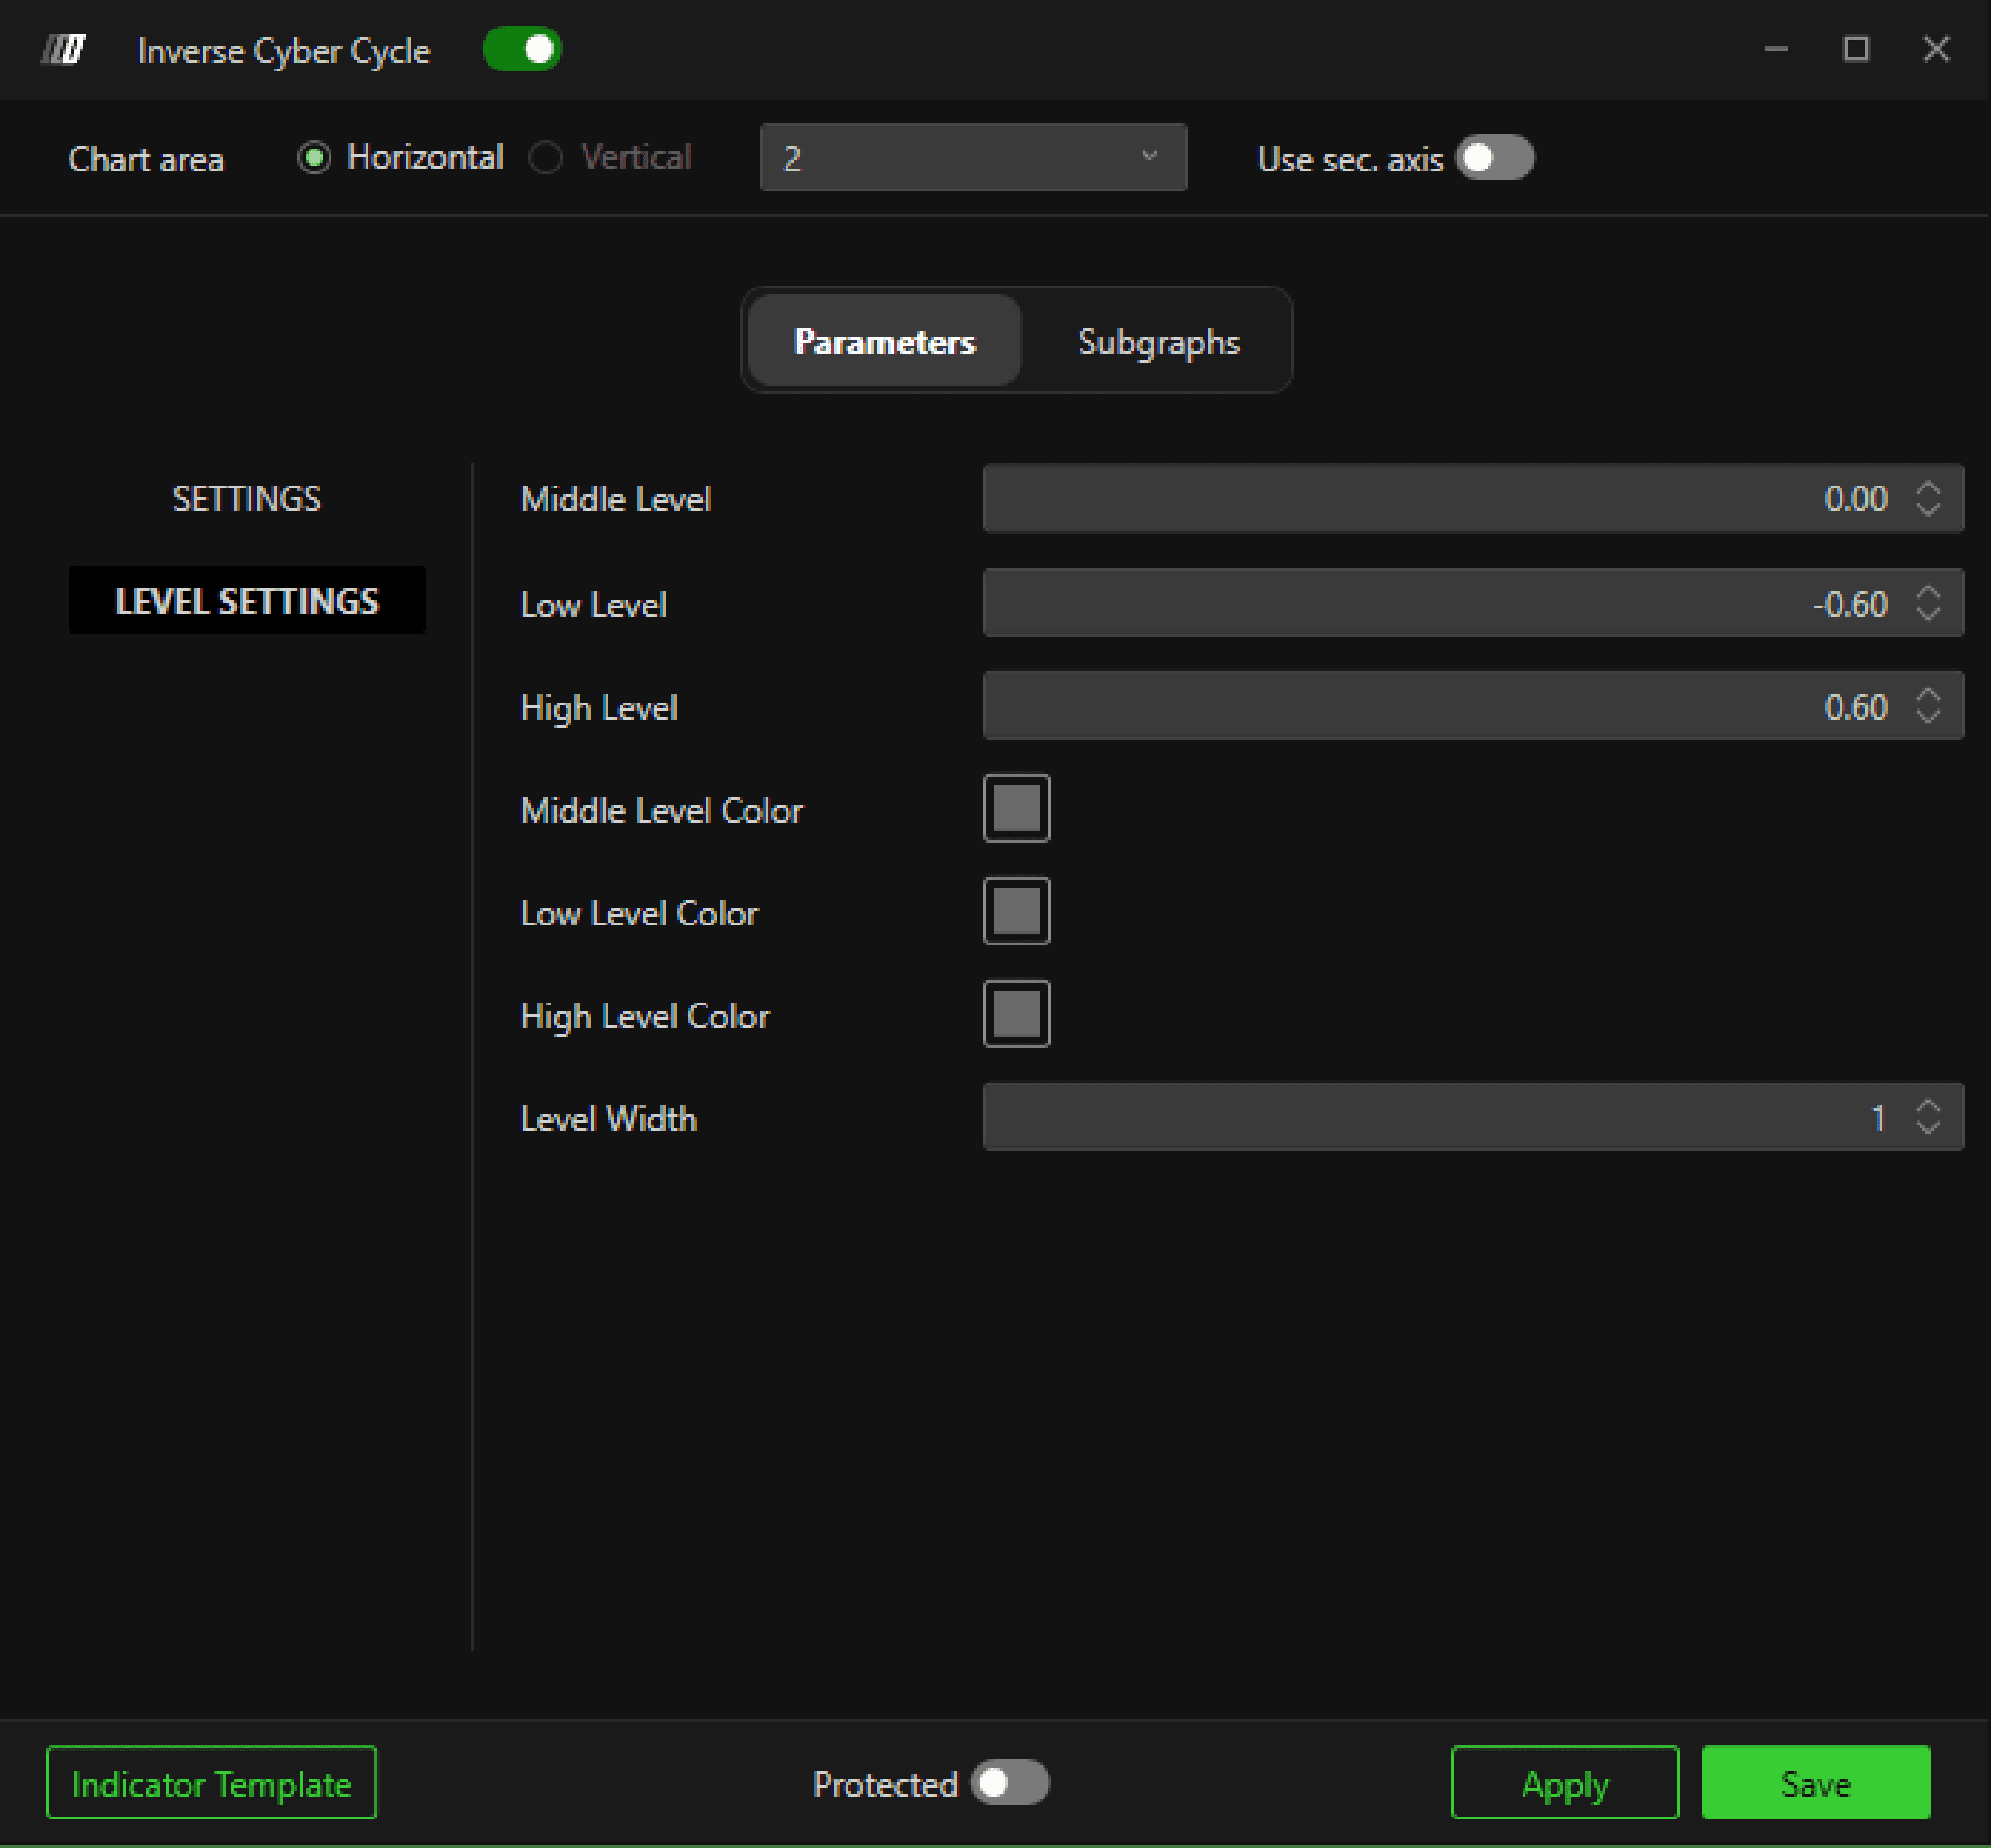
Middle Level
Defines the neutral reference line (typically zero).
Low Level
Sets the lower threshold used to identify oversold or extreme negative cycle conditions.
High Level
Sets the upper threshold used to identify overbought or extreme positive cycle conditions.
Level Colors
Customize visual appearance of each reference level.
Level Width
Adjusts thickness of level lines.
Subgraphs
Inverse Cyber Cycle A
Controls the visual style of the faster cycle line:
Line color
Line style
Line width
Auto color behavior
Label display
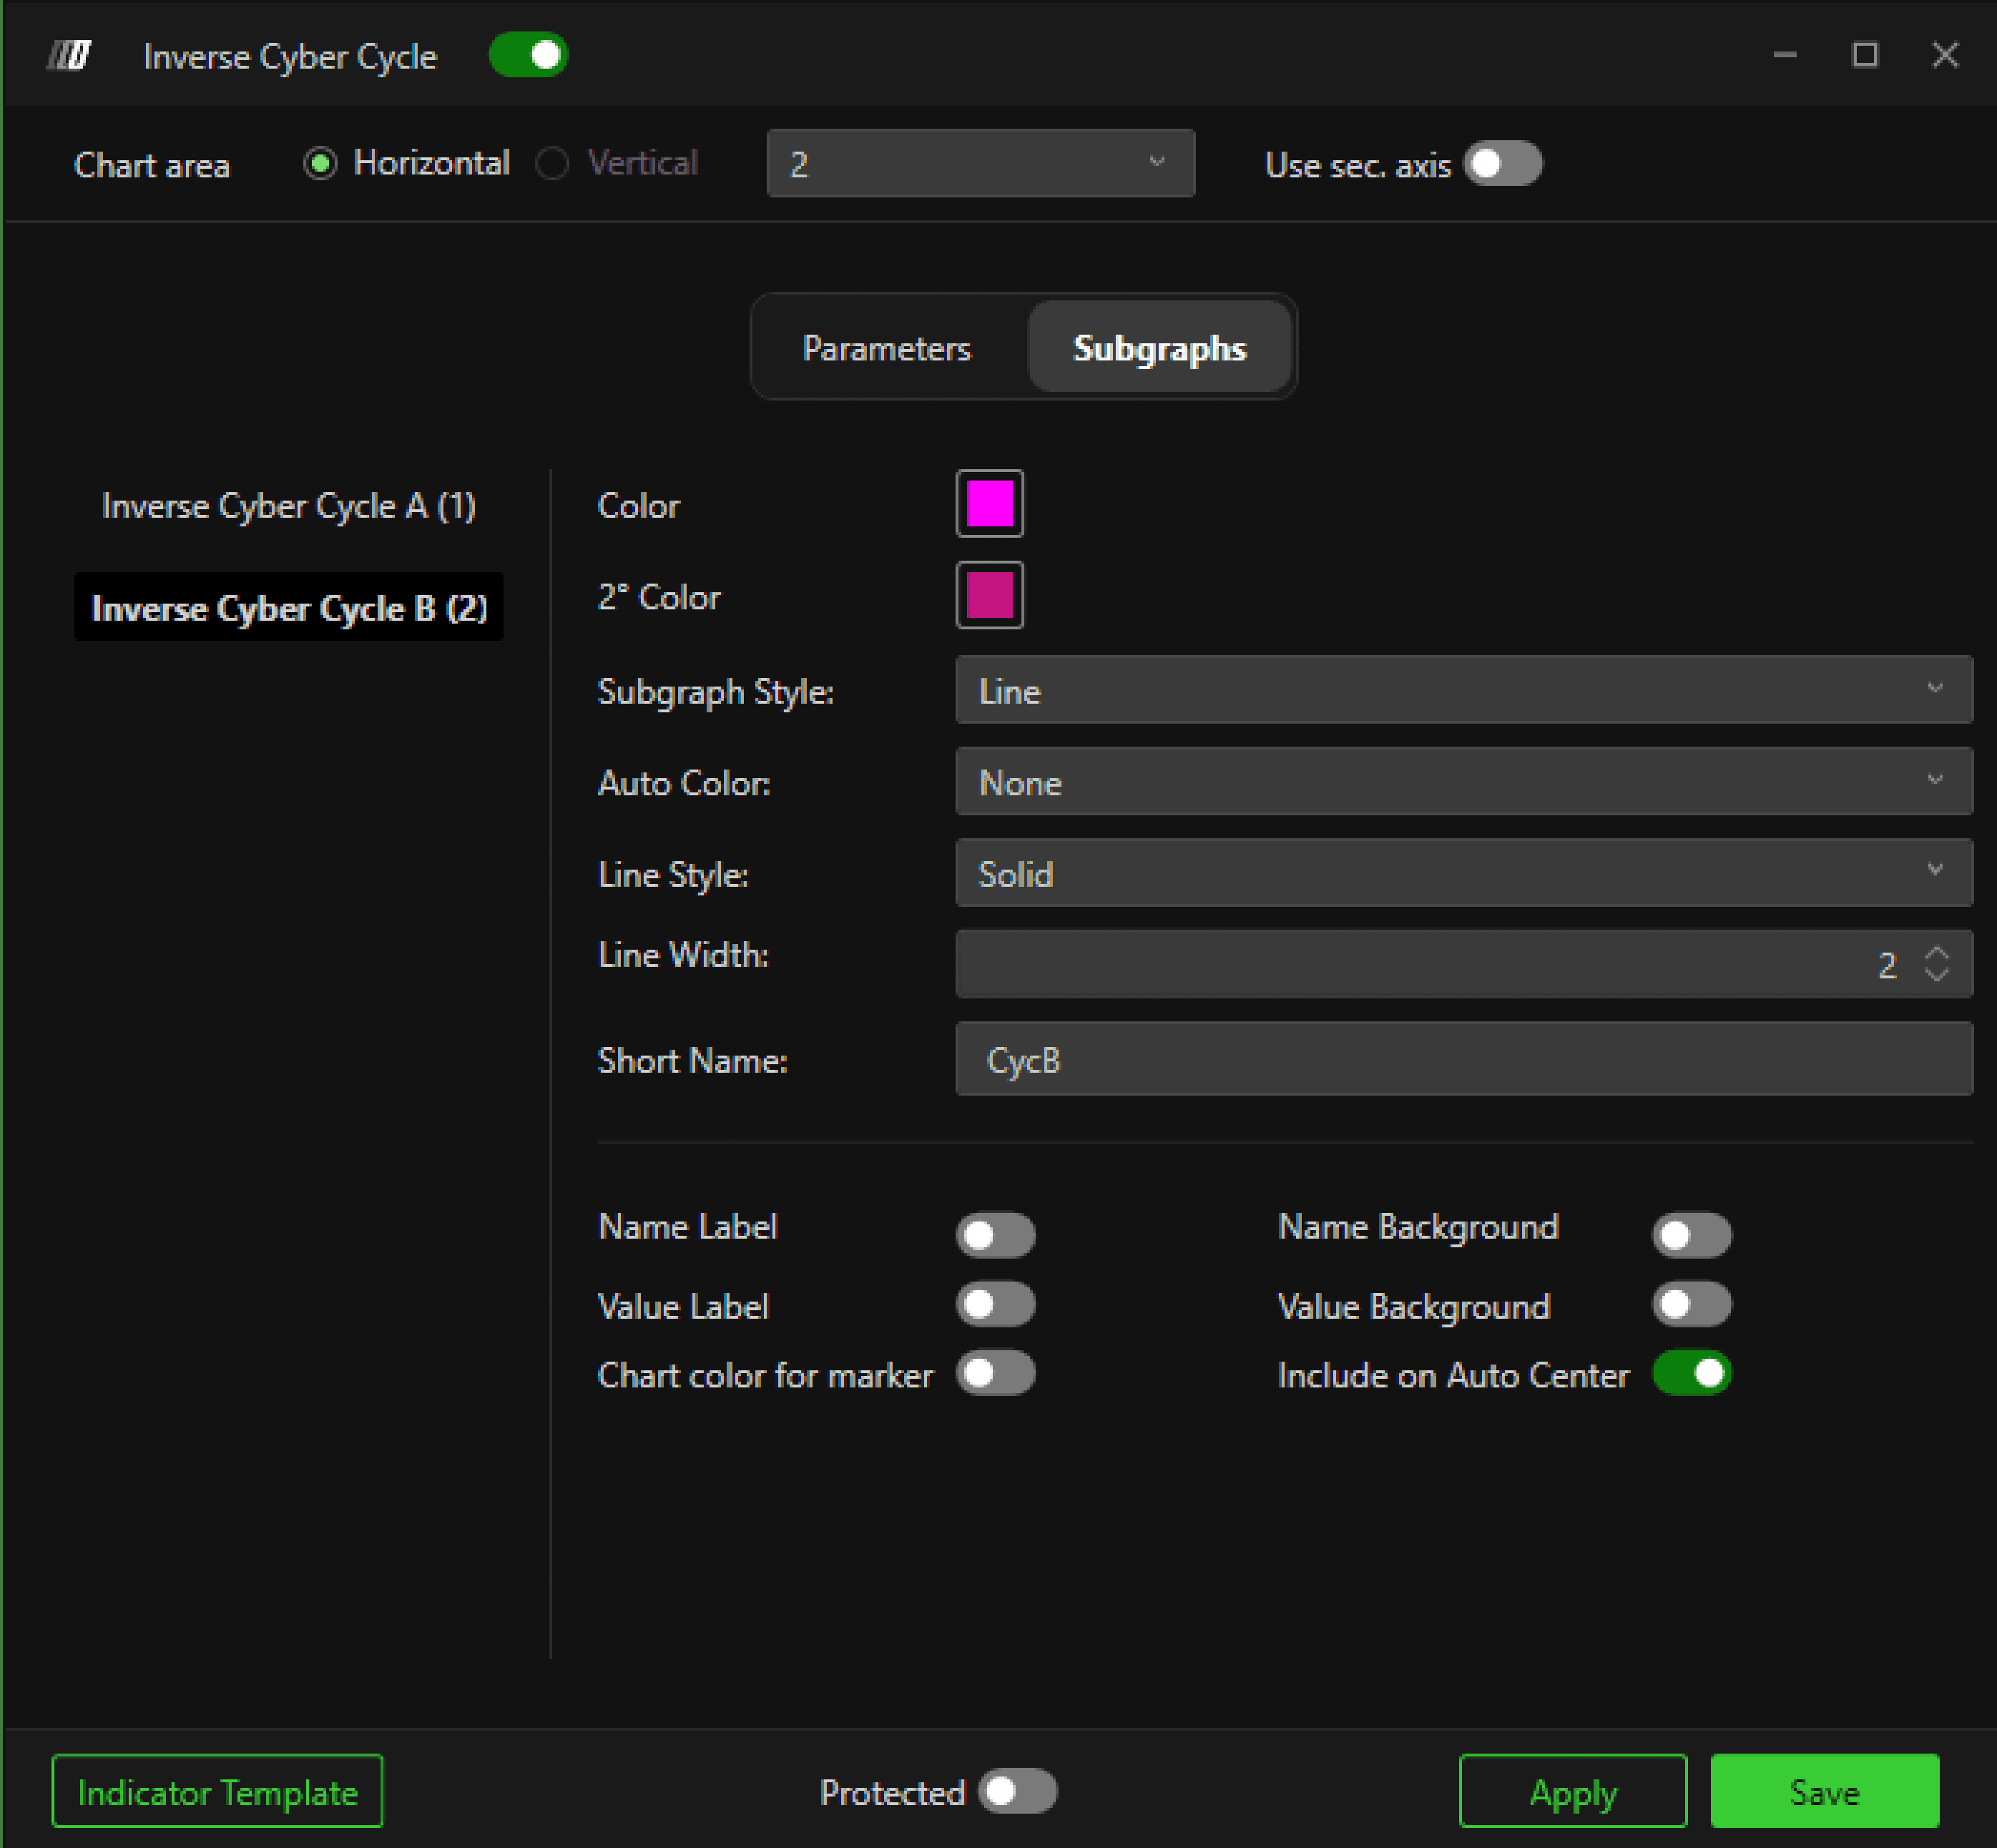
Inverse Cyber Cycle B
Controls the visual style of the slower cycle line:
Line color
Line style
Line width
Auto color behavior
Label display
Display Options (Both Lines)
Name Label – Shows indicator name.
Value Label – Displays current value.
Name Background – Background behind name.
Value Background – Background behind value.
Include on Auto Center – Includes indicator in auto-scaling.
Chart color for marker – Uses chart color for markers.
How It Works
Crossovers between Cycle A and Cycle B may signal momentum shifts.
Moves above the High Level suggest cyclical strength.
Moves below the Low Level suggest cyclical weakness.
Best used to identify turning points within trends.