Updated:
Option Levels plots key strike levels directly on your price chart as horizontal lines, based on options volume, gamma exposure, or open interest. These levels highlight where the most significant options activity is concentrated, helping you identify potential call walls, put walls, and other structurally important price zones.

Note: Option Levels is available on NDX, QQQ, SPY, and SPX.

How to Add Option Levels
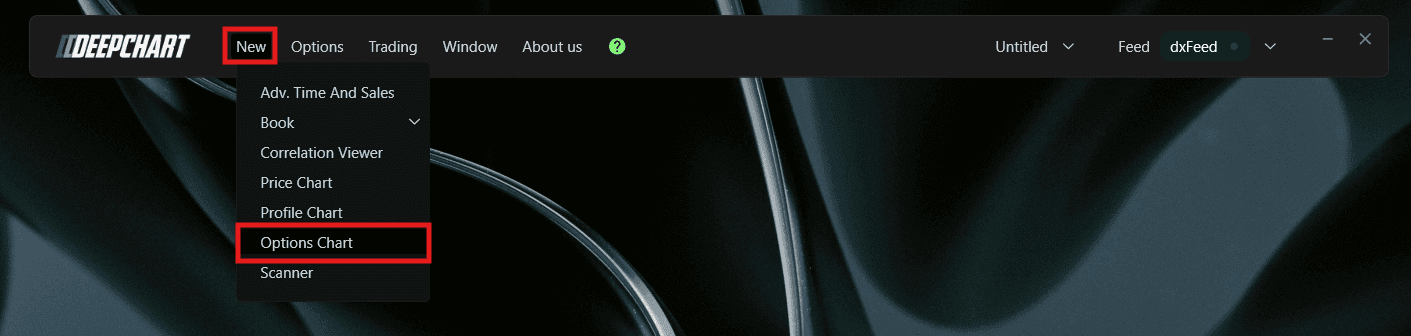
Go to New in the top menu
Click on Option Chart
A Select Instrument dialog will appear with the following options:
NDX - Symbol: NQ-CME, Exchange: CME
QQQ - Symbol: NQ-CME, Exchange: CME
SPX - Symbol: ES-CME, Exchange: CME
SPY - Symbol: ES-CME, Exchange: CME
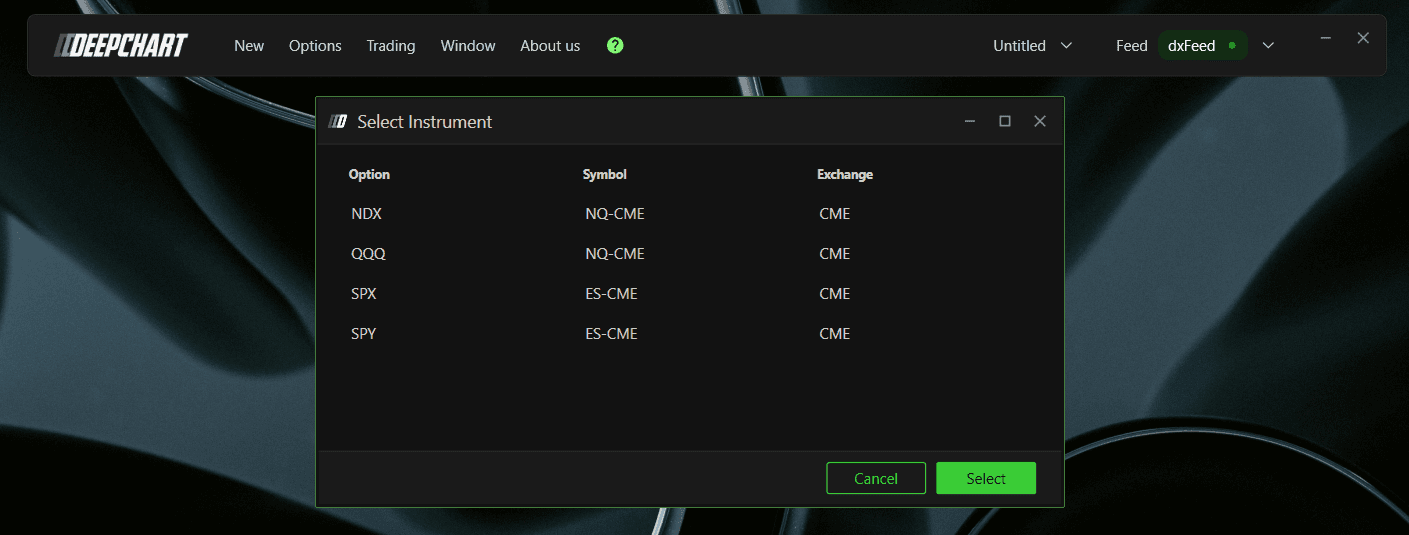
Select your preferred instrument and click to open the chart
Once the Option Chart is loaded, click the Indicator Add button on the chart toolbar
Search for Option Levels and click + to add it
Click the settings icon to open the configuration window

Understanding the Indicator
Option Levels plots horizontal lines directly on your price chart, based on your selected data source. The number of levels shown depends on your Number of levels setting, and each one is ranked by strength using triangle markers, more triangles indicate a stronger concentration at that strike.
Each level is labeled based on your selected data source and expiration filter. Green levels with downward triangles represent positive values, while red levels with upward triangles represent negative values.
In addition to the ranked strike levels, Option Levels also plots the Zero Gamma level as a static horizontal line, shown in yellow by default. Unlike the ranked levels, this line is not tied to the Number of levels setting, it always represents the single price point where dealer gamma exposure flips from positive to negative, the same concept used in Option Envelopes, just shown here as a flat reference line instead of a shifting envelope.

Understanding Key Terms
Before choosing a data source, it helps to understand a few core options concepts:
Call - An option that gives the buyer the right to buy the underlying at a set price. Traders buy calls when they expect price to go up
Put - An option that gives the buyer the right to sell the underlying at a set price. Traders buy puts when they expect price to go down
Gamma - A measure of how much an option's delta changes as price moves. High gamma means dealers need to hedge more aggressively as price approaches a strike, which is why gamma concentrations often act as support or resistance
OI (Open Interest) - The total number of option contracts currently open and not yet closed or expired
Gamma (Call - Put) - Net gamma exposure calculated using the standard assumption that market makers are long calls and short puts
Call/Put Σ - Raw call and put options volume, with no gamma weighting
Settings
Parameters
General
Data source - Choose how the levels are calculated. Options available:
Gamma (Call - Put) (default) - calculates levels based on net gamma exposure, showing where dealer hedging pressure is most concentrated.
Use this when: you want a gamma-weighted read on positioning and market regime, similar to what you would use to read Option EnvelopesCall/Put Σ - calculates levels based on total call and put volume, showing classic call wall and put wall levels.
Use this when: you want a simple read on where the most contracts are trading, regardless of gamma weightingOI (Eod) - calculates levels using the prior session's end of day open interest data, showing structural levels based on standing positions rather than the current session's live trading activity.
Use this when: you want a structural view based on standing positions from the previous session's close, rather than live intraday trading activityGamma (Call OI-E - Put OI-E) - calculates levels based on the difference between call and put end of day open interest multiplied by the gamma greek, giving a gamma-weighted read on standing positions rather than live volume.
Use this when: you want a gamma-weighted view of dealer exposure based on standing open interest instead of current session trading activity
Expiration - Filter levels by expiration. Options available: 0 DTE, <= 1d, <= 7d, <= 31d, <= 91d, All expirations. Default is All expirations
Include Carry or Open Interest - When enabled, includes open interest carried over from previous sessions into the calculation, giving you a broader view of total positioning. When disabled, only the current session data is considered. Default is disabled
Number of Strikes (0 - unlimited) - Sets how many strikes out from the current price to include in the calculation. A value of 0 includes an unlimited number of strikes. Default is 0

Plot Settings
Extension
Number of sessions - Set how many previous sessions the levels are extended across. Default is 1
Number of levels - Set how many levels are plotted on the chart. Default is 2. Each level plotted is ranked by strength using triangle markers, more levels shown means more strikes are ranked and compared against each other

Extension mode - Choose how the level lines are extended. Options available:
None - no extension, levels are plotted only for the current session
Till interaction (default) - extends the line until price interacts with it
Till end window - extends the line to the end of the visible chart window
Label
Text size - Set the font size for the level labels. Default is 11
Custom header - Add a custom label text to the levels if needed
Align previous values on right - When enabled, aligns labels for previous session values to the right side of the chart. Default is enabled
Align current values on right - When enabled, aligns labels for current session values to the right side of the chart. Default is disabled
Lines
Positive color - Set the color for positive levels. Default is green
Negative color - Set the color for negative levels. Default is red
Zero color - Set the color for the Zero Gamma static line. Default is yellow
Lines width - Set the thickness of the lines. Default is 1
Lines style - Choose the line style. Options available: Solid, Dash, Dot, Dash dot, Dash dot dot. Default is Dash

Example - How to Use Option Levels
Once added to your chart, you will see horizontal lines plotted at key strike levels, each ranked by strength using the triangle markers. Here is a simple way to use them:
The number of triangles tells you how significant that level is relative to the others on your chart. A level with more triangles represents a stronger concentration than one with fewer
The Zero Gamma line gives you the broader regime context, price above it tends to mean a calmer, more compressed market, while price below it tends to mean a more volatile, directional one, the same reading you would apply to Zero Gamma on Option Envelopes
How price reacts at a level depends on the direction it is approaching from and which side of the market that level represents. Watch for a slowdown, reversal, or acceleration as price reaches the level, rather than assuming a fixed outcome
Switching the data source between Gamma, Call/Put volume, and open interest can give you different perspectives on the same price action, since each highlights a different type of positioning
Combine Option Levels with Option Profile to see the full distribution behind the levels, since Option Levels only shows you the top ranked strikes rather than the complete picture
Tip: Use Option Levels alongside Option Envelopes for a fuller picture. Envelopes show you the broader zero gamma regime, while Option Levels highlights the specific strikes where activity is concentrated.
Any Questions?
Our support team is available 24/7 and ready to help you with any question.
When reaching out, please include:
Screenshot (if any)
Briefly describe the assistance or support you require
DeepCharts Live Support - Chat with our agents directly using the live chat box on www.deepcharts.com, or click here for 24/7 Live Chat for immediate access.
Email Support - Reach us at support@deepcharts.com - please note that email responses may take a little longer than a live support chat.
