Indicators
Updated:
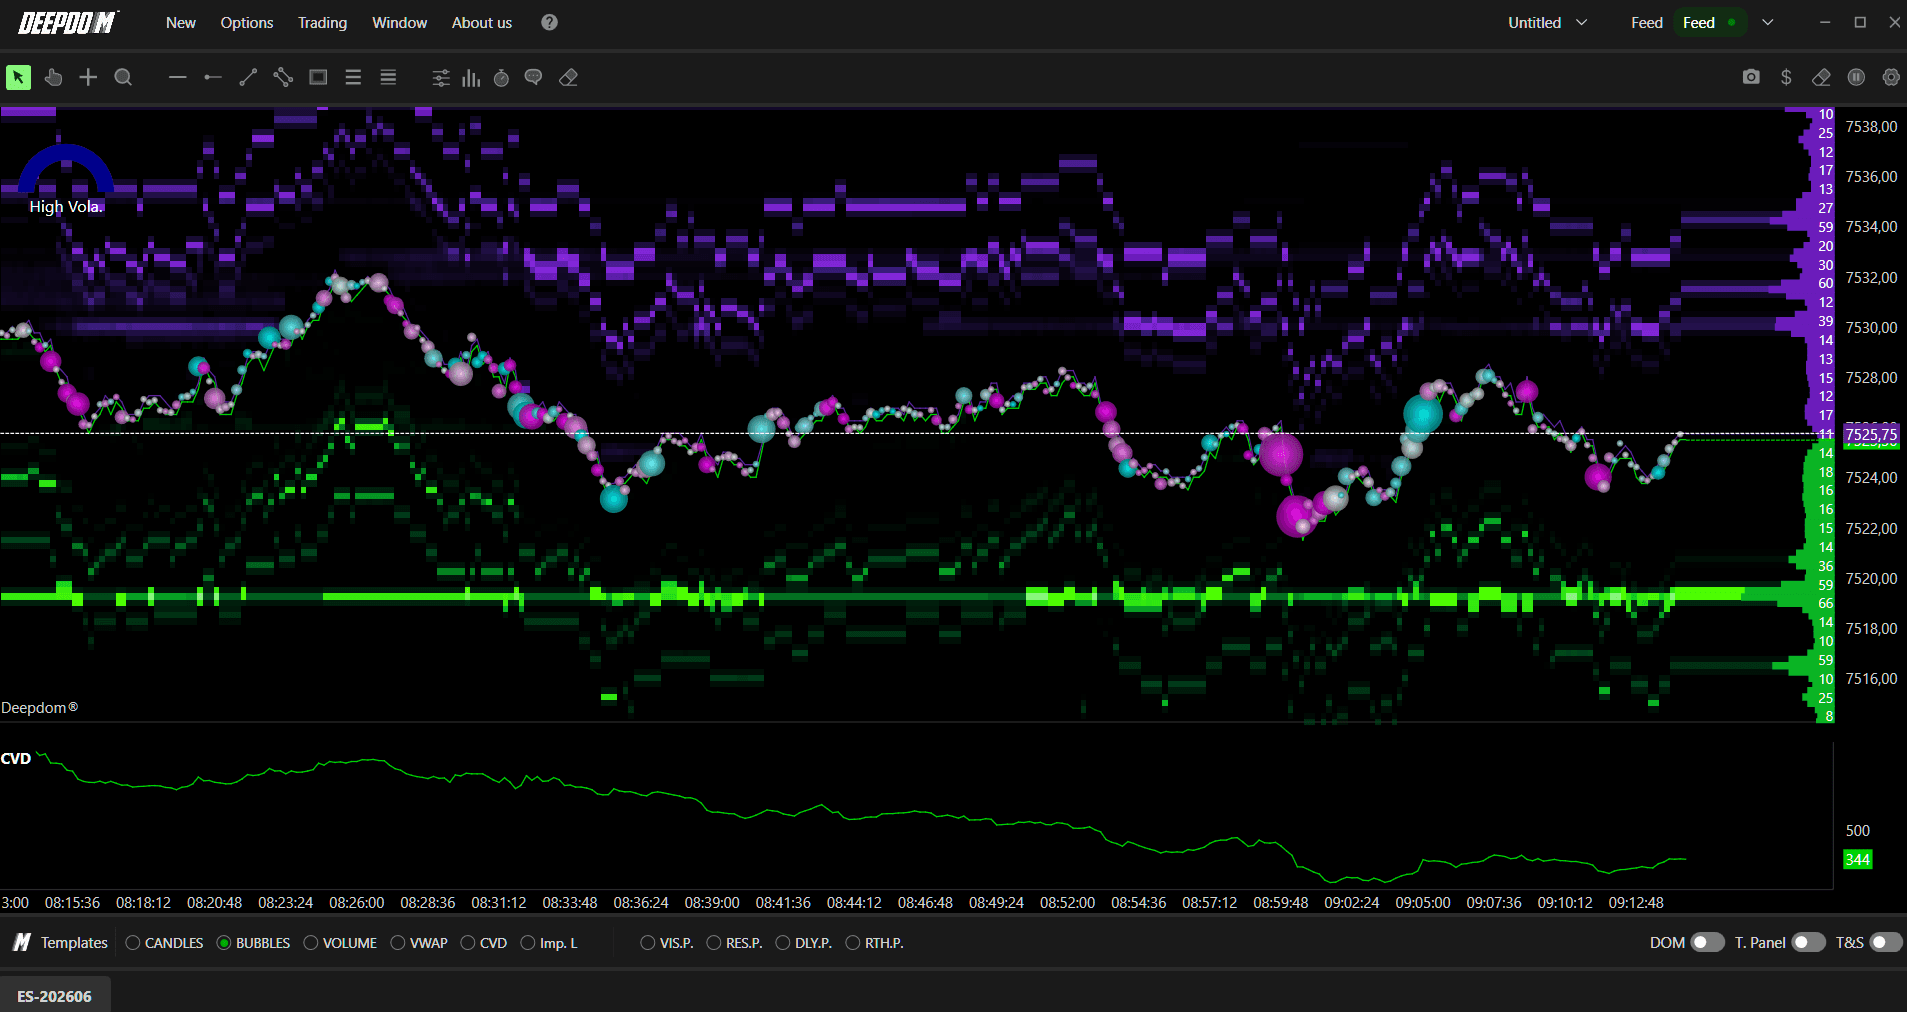
Cumulative Volume Delta (CVD) shows tick‑by‑tick cumulative delta over a user‑defined period, measuring the difference between buy‑market and sell‑market volume to reveal sustained buying or selling pressure.
Settings of Use
Right-click on the chart and select Indicators.
Search for the desired indicator and add it to your workspace by clicking the "+" button.
Open the indicator's settings panel, customize the parameters according to your preferences, and confirm the changes by clicking Save.

General Settings

Period Mode and Value
The Period Mode defines the reference period for the CVD calculation. You can choose between Days, Minutes, Seconds, or Order.
Period Value sets the numeric parameter for the chosen mode (for example, 1 day or 30 minutes).
Show volumes Bid/Ask
Enable this option to display, in addition to the CVD line, separate lines for volume executed at Ask and at Bid.
Plot Settings
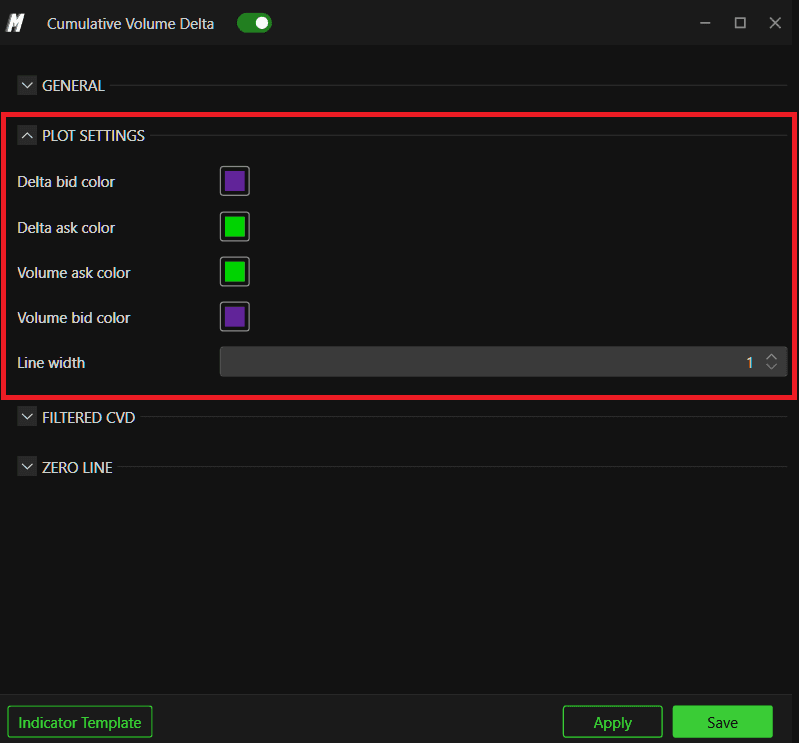
Customize the appearance of the CVD and volume lines:
Set colors for negative CVD (delta Bid color) and positive CVD (delta Ask color).
Choose colors for volumes executed at Ask and Bid.
Adjust the line thickness to improve readability.
Filtered CVD

Enable Filtered CVD
Turn on Filtered CVD to apply volume filters and optionally plot it on a separate axis from the main CVD.
Use separate axes – if enabled, draws filtered CVD using a different vertical scale.
Vol. <= filter – applies a minimum volume filter.
Vol. >= filter – applies a maximum volume filter.
Filtered Bid color – color for negative filtered CVD.
Filtered Ask color – color for positive filtered CVD.
Line Zero – sets the color and thickness of the zero line.
Filters are useful to isolate participation from larger players. For example, even if the session CVD is positive while price trades near session lows, a filtered CVD with a higher volume threshold may reveal that larger traders are net sellers.
Interpreting CVD in Trading
Trend confirmation: CVD making higher highs together with price supports the idea of genuine buying interest; CVD diverging (lower highs while price makes higher highs) warns of weakening participation.
Absorption and reversal: CVD pushing strongly in one direction while price fails to break key levels often signals absorption and potential reversal zones.
Combining with Volume and Deep Trades: use Volume for context of participation intensity and Deep Trades to see whether large prints align with the CVD direction or fade it.