Deep Indicators
Updated:
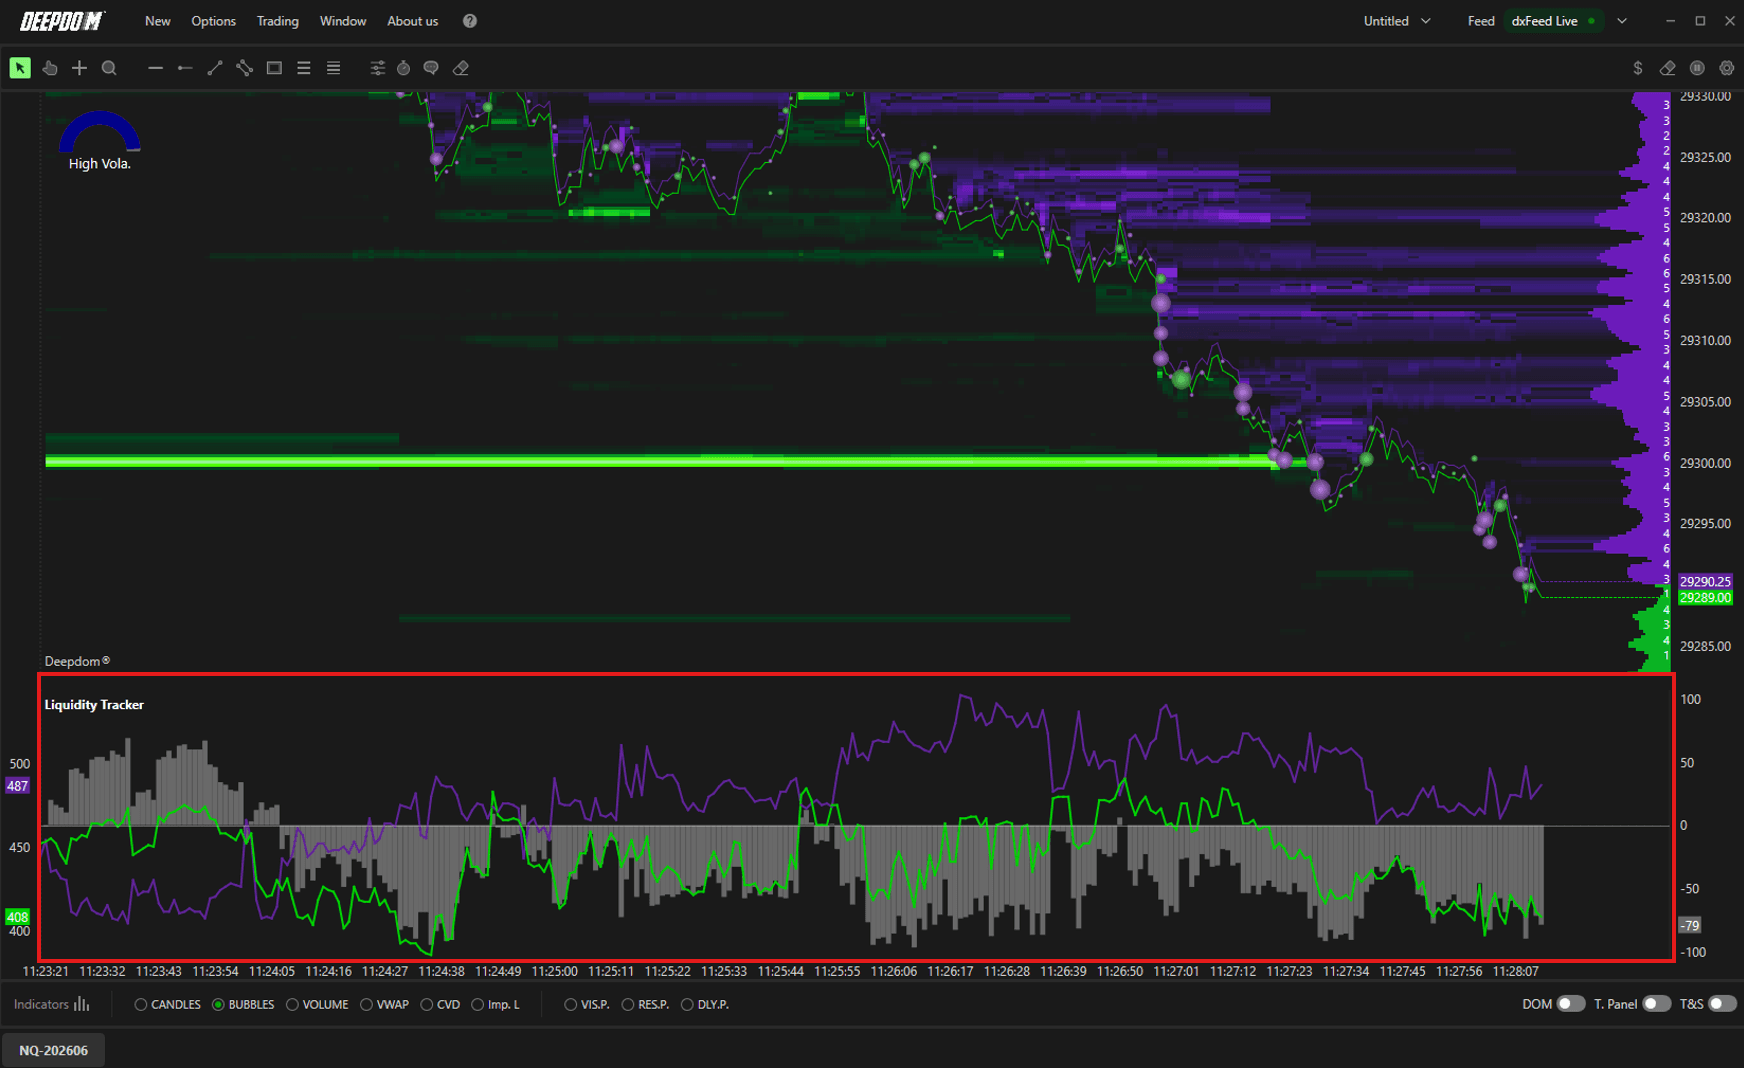
The Deep Liquidity Scan monitors and displays the level of passive liquidity on both the Bid (demand) and Ask (supply) sides of the market in real time. It shows you where limit orders are concentrated in the DOM (Depth of Market) and how the balance between buyers and sellers is shifting over time.
By using distinct colors for Bid, Ask, and Delta, the indicator helps you quickly spot moments of peak interest and potential price reactions before they become visible in price alone.
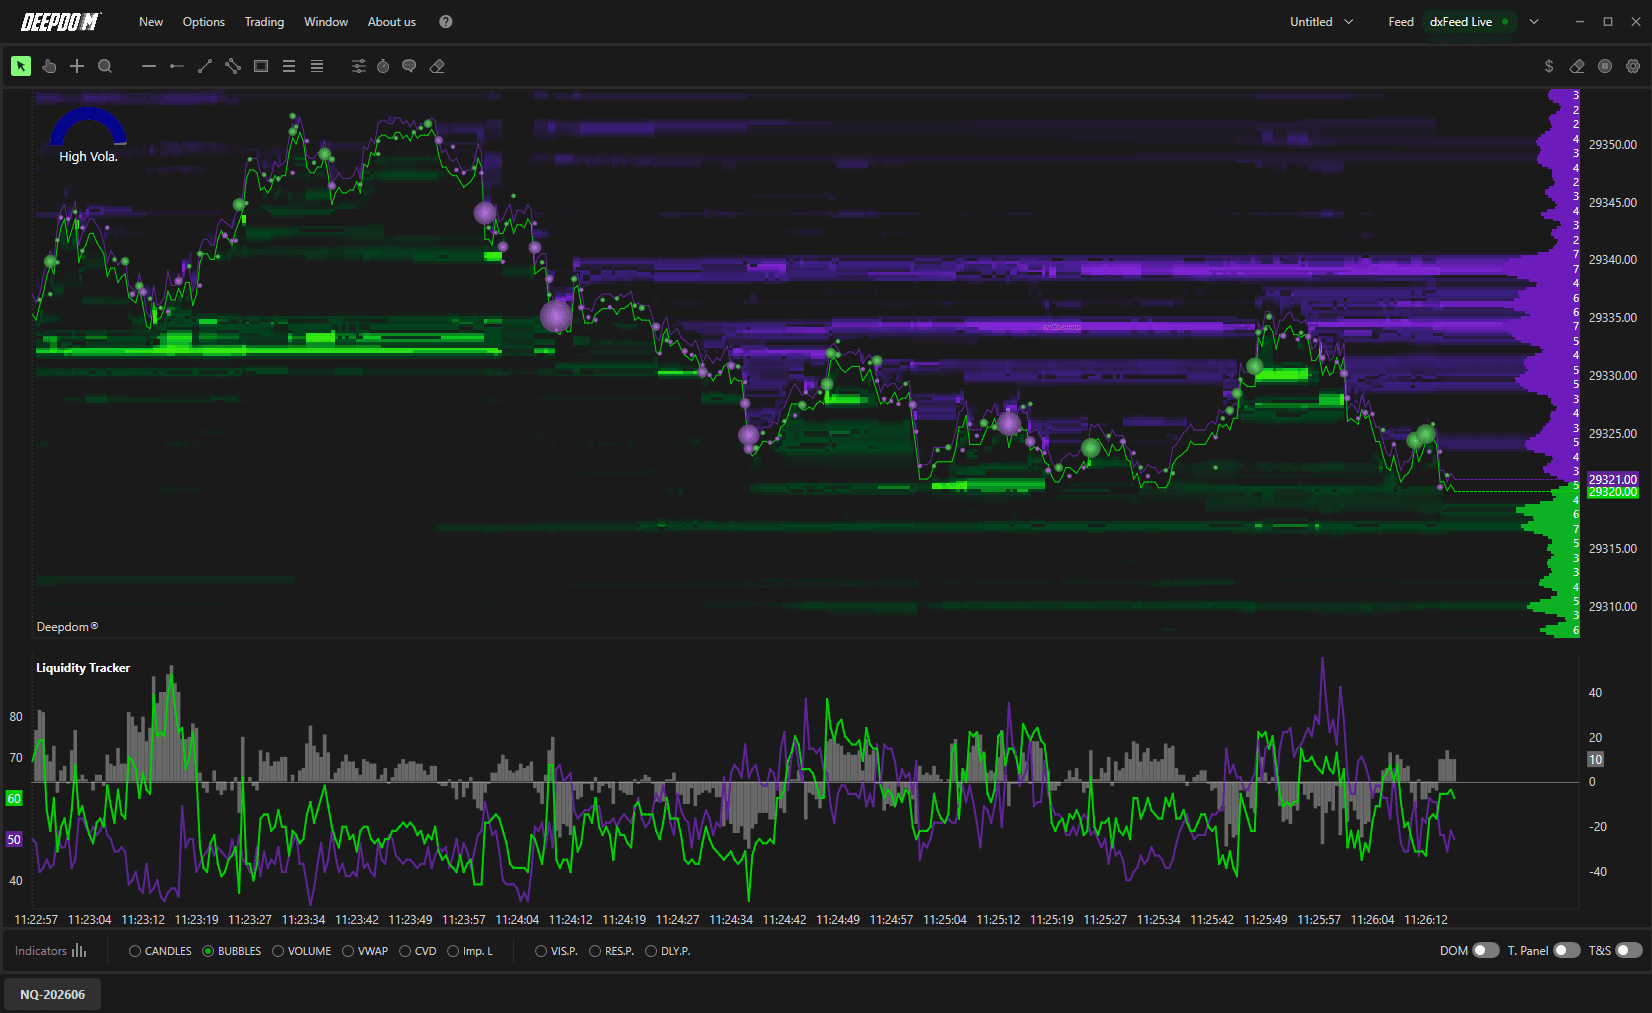
What is Passive Liquidity? Passive liquidity refers to limit orders sitting in the order book waiting to be filled. For example, a trader places a limit buy order at 26,750 — that order sits in the book as passive liquidity on the Bid side. It is not actively hitting the market — it is waiting for price to come to it. The Liquidity Tracker measures how much of this passive liquidity is sitting on each side of the market at any given moment, and how that balance is changing over time.
How to Read the Indicator at a Glance
Understanding what the lines are telling you is the first step to using this tool effectively:
Bid liquidity increases: more limit buy orders are building up below the current price. Buyers are stacking up and may support price or cause a bounce.
Ask liquidity increases: more limit sell orders are stacking above price. Sellers are positioning and may cap or push price down.
Positive Delta: Bid liquidity exceeds Ask liquidity — buyers are more aggressive in their passive positioning.
Negative Delta: Ask liquidity exceeds Bid liquidity — sellers have the upper hand in passive positioning.
Delta crosses zero: a shift in dominance is occurring between buyers and sellers — pay close attention to price reaction at this moment.
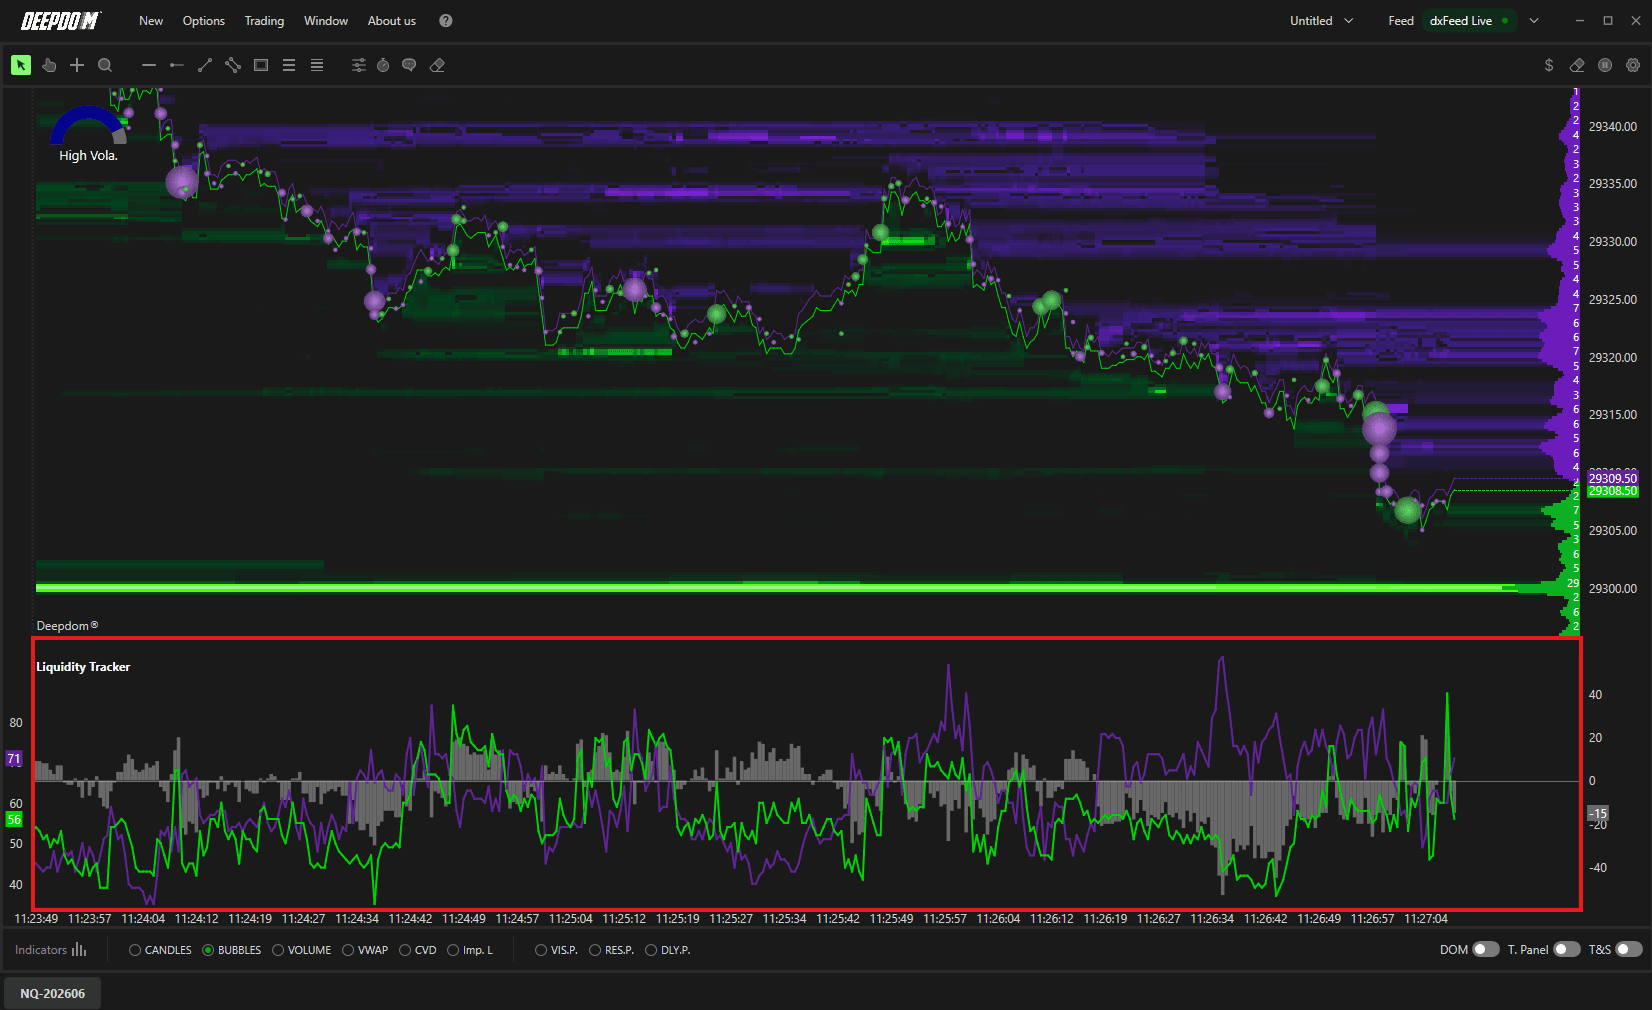
Using Deep Liquidity Scan with the Heatmap / DOM
The Deep Liquidity Scan works best in combination with the Heatmap or the DOM (Depth of Market) panel. Here is a simple workflow:
Watch the Heatmap or DOM for large clusters of limit orders at specific price levels.
Monitor the Deep Liquidity Scan to confirm whether overall Bid or Ask liquidity is growing or shrinking.
A rising Bid line on the indicator, combined with a visible large limit buy cluster on the Heatmap, strengthens the case for a potential support reaction at that level.
A spike in Delta followed by a price move can indicate that one side absorbed the other — useful for timing entries or exits.
Tip: Use the smoothing options in the indicator to reduce noise and focus on sustained liquidity shifts rather than momentary spikes.
How to Set Up the Deep Liquidity Scan
Follow these steps to add the indicator to your chart:
Click the Indicators icon on the chart toolbar.
Find Deep Liquidity Scan in the list and click + to add it.
Click the settings icon on the indicator to open its configuration window.
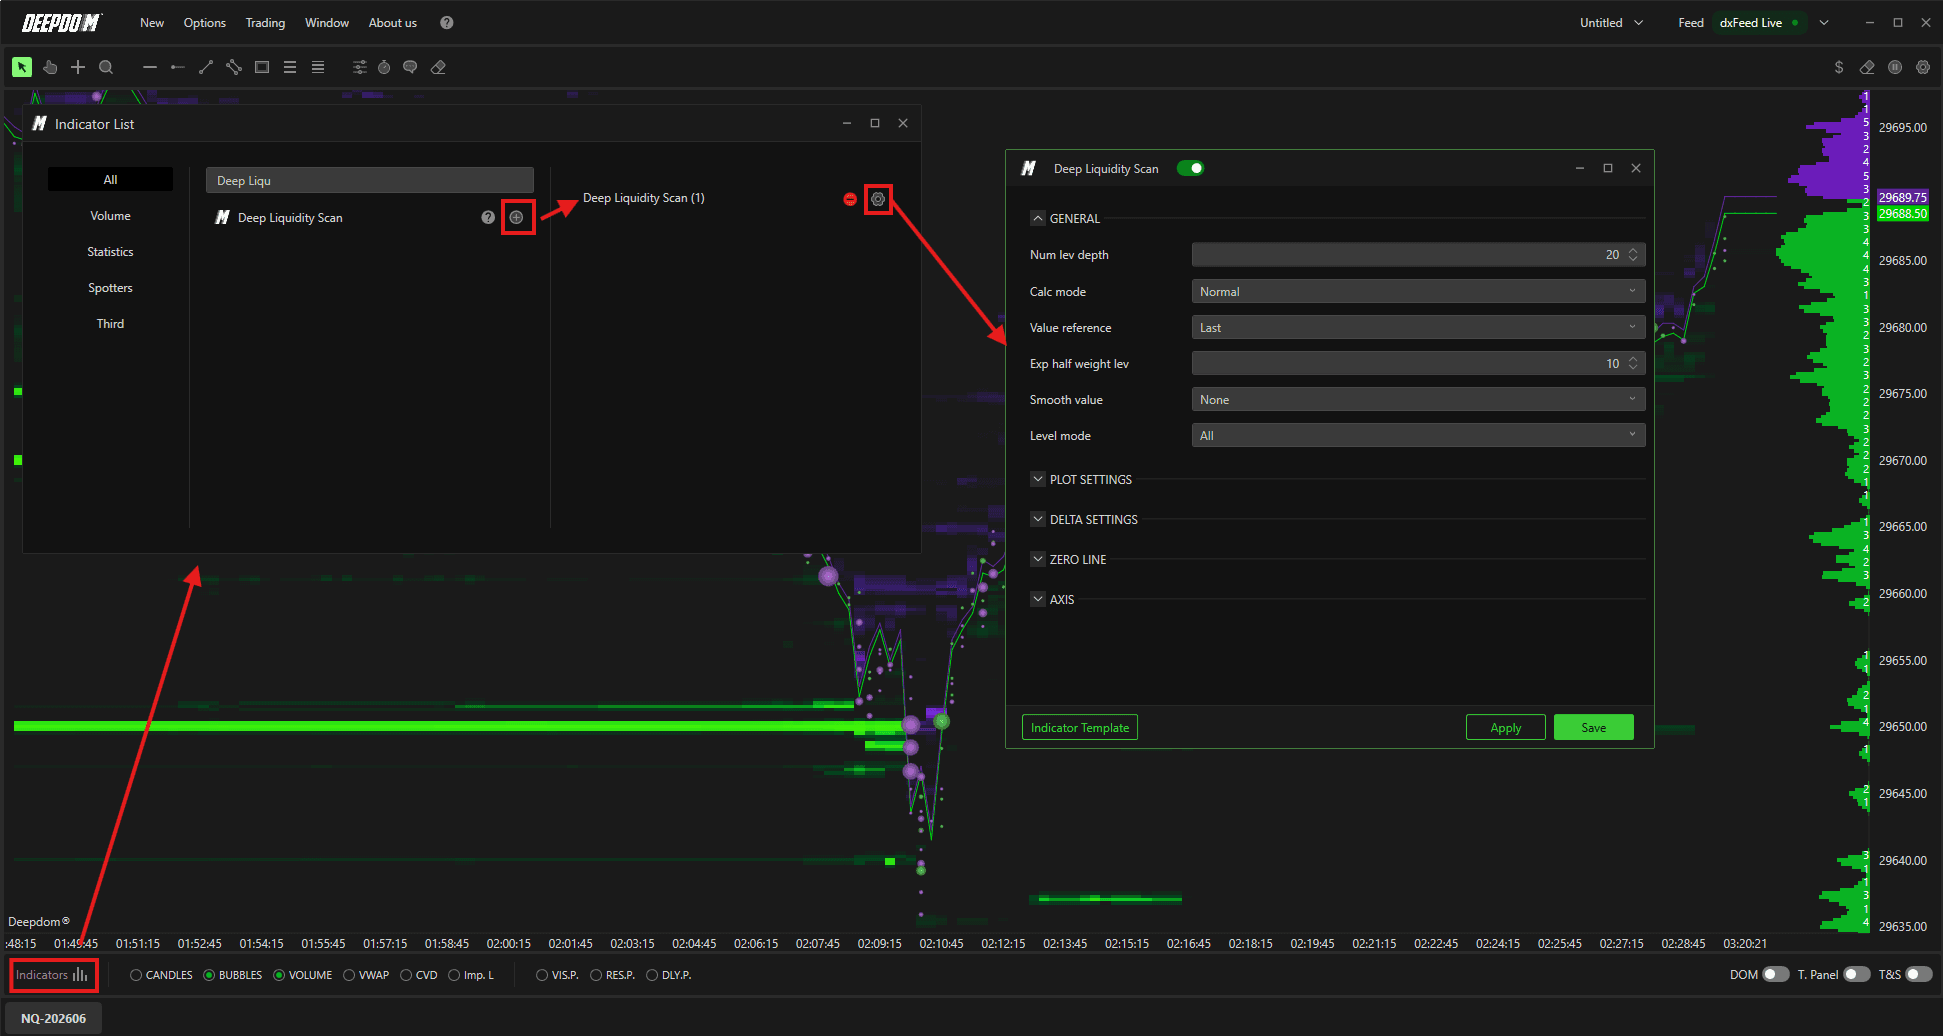
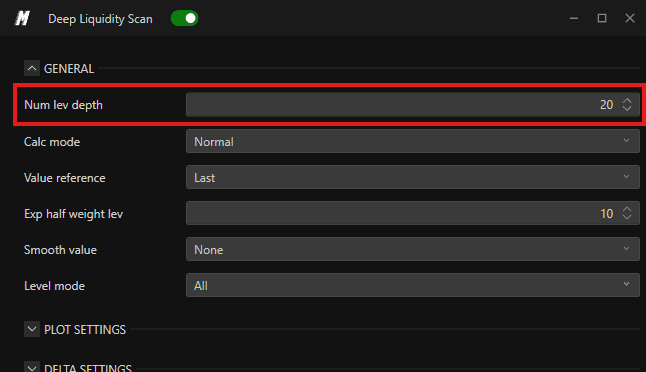
General Settings
1.Num Lev Depth - This setting controls how deep into the order book the indicator looks when measuring liquidity.
The order book has many price levels — some very close to the current price, and some far away. This setting tells the indicator how many of those levels to include in its calculation.
A low value (for example, 20) means the indicator only looks at the 20 levels closest to the current price. This gives you a tight, focused view of liquidity right around where price is trading.
A high value (for example, 200) means the indicator looks much deeper into the book, capturing liquidity that is sitting far from the current price.
When to use a low value: If you want to see immediate liquidity pressure — the orders that could be hit very soon.
When to use a high value: If you want a broader picture of overall market interest and where large resting orders are sitting further away from price.
Examples -
Num Lev Depth - 20
Num Lev Depth - 200
2. Calc Mode - This setting controls the method used to calculate liquidity across all the depth levels you selected with Num Lev Depth.
Normal: Every depth level is treated equally. Whether an order is sitting 1 level away from price or 100 levels away, it counts the same. This gives you a straightforward, unweighted total of all liquidity in the selected range.
Exponential: Levels that are closer to the current price are given more weight than levels that are far away. This means liquidity sitting right next to price has a stronger influence on the indicator's reading than liquidity sitting deep in the book.
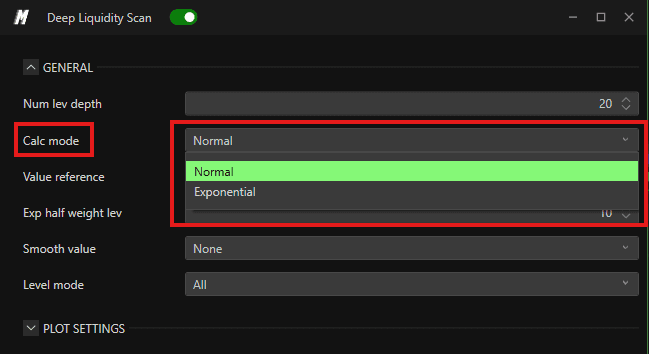
When to use Normal: When you want a simple, equal view of all available liquidity across the selected depth.
When to use Exponential: When you believe that liquidity closest to the current price is more relevant and should have a greater impact on the reading. This is useful in fast-moving markets where nearby liquidity matters most.
3. Value Reference - This setting defines the baseline that the indicator uses when comparing and displaying liquidity levels
Last: The indicator compares current liquidity against the most recent reading. This keeps the display responsive and moving with real-time changes in the book.
Peak: The indicator compares current liquidity against the highest liquidity level it has seen. This means the display is always relative to the biggest reading recorded, making it easier to see how current liquidity compares to the maximum.
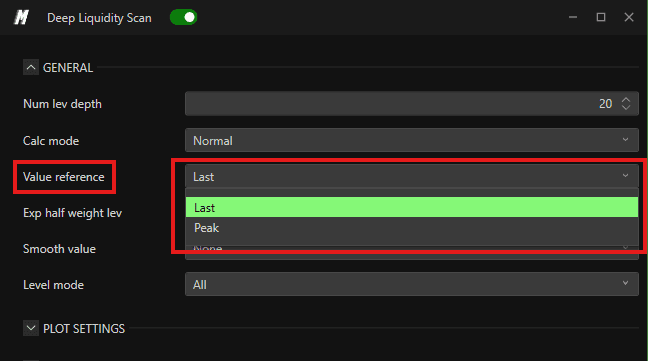
When to use Last: When you want a live, moment-to-moment view of how liquidity is changing right now.
When to use Peak: When you want to see whether current liquidity is building toward or retreating from a historical high point.
4. Exp Half-Weight Lev - This setting only applies when Calc Mode is set to Exponential. It controls how quickly the influence of deeper book levels fades compared to levels near the current price.
Think of it as a dial that controls how steeply the weighting drops off as you move deeper into the book:
A low value means the weight drops off very quickly. Only the levels very close to price have meaningful influence. Anything deeper in the book is largely ignored.
A high value means the weight drops off more gradually. Levels deeper in the book still contribute a fair amount to the overall reading.
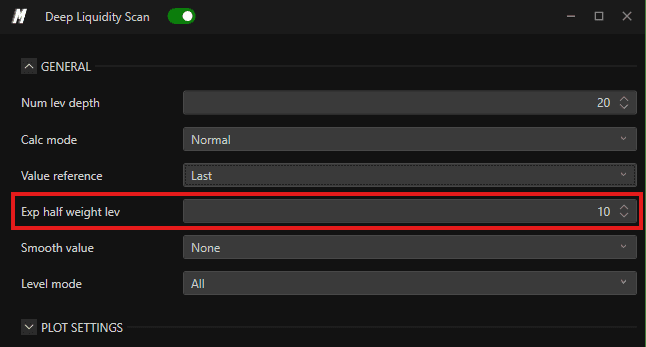
Simple example: If this is set to 5, it means that by the time you reach level 5 in the book, the weight of that level is already half of what level 1 has. The further you go, the less it counts.
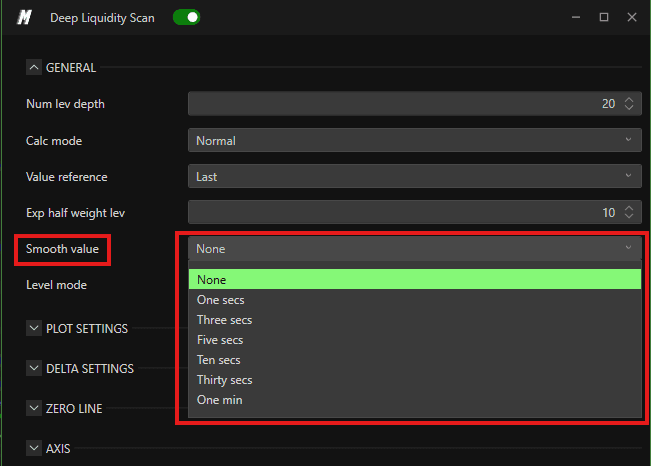
5. Value Smooth - Raw order book data can be very noisy — it changes rapidly and constantly, which can make the indicator lines jump around and be difficult to read. This setting applies smoothing to the data so the lines appear cleaner and easier to follow.
None — No smoothing. You see every raw change as it happens. Best for scalpers who need the fastest possible signal.
One Sec — Smoothing over 1 second.
Three Secs — Smoothing over 3 seconds.
Five Secs — Smoothing over 5 seconds.
Ten Secs — Smoothing over 10 seconds.
Thirty Secs — Smoothing over 30 seconds.
One Min — Smoothing over 1 minute. Best for slower timeframes where you only want to see sustained, meaningful shifts.
When to use no smoothing: Fast markets, scalping, or when you need to react to real-time changes instantly.
When to use smoothing: Swing trading, trend following, or when the raw data is too noisy to read clearly.
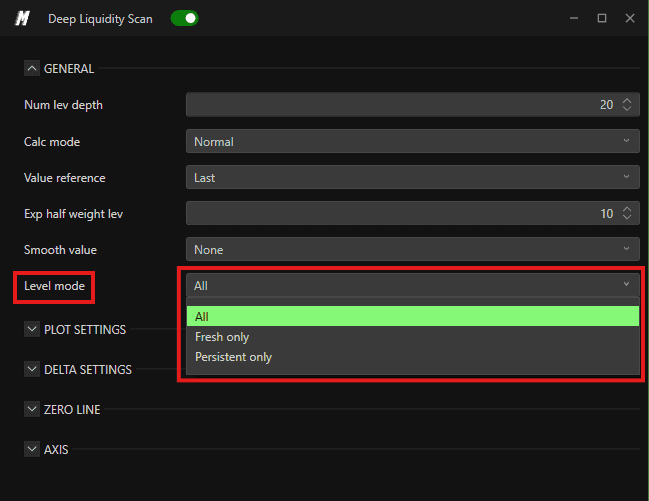
6. Level Mode - This setting filters which types of order book levels are included in the liquidity calculation. Not all limit orders in the book behave the same way — some are brand new and some have been sitting there for a long time. This setting lets you choose which ones to measure.
All: The indicator includes every level within the selected depth, regardless of whether the order just appeared or has been sitting there for a while. This is the broadest view and the default setting.
Fresh Only: Only levels that have recently appeared in the book are included. These are orders that were just placed. This is useful for detecting new, aggressive positioning — when traders are suddenly placing large orders, you will see it here.
Persistent Only: Only levels that have been sitting in the book for some time are included. These are resting, committed orders — liquidity that has not been cancelled and is genuinely waiting to be filled. This is useful for finding strong support or resistance zones backed by patient, committed traders.
When to use Fresh Only: When you want to spot new order flow and detect when participants are suddenly positioning themselves.
When to use Persistent Only: When you want to identify where strong, committed resting liquidity is located — these levels are more likely to act as real support or resistance.
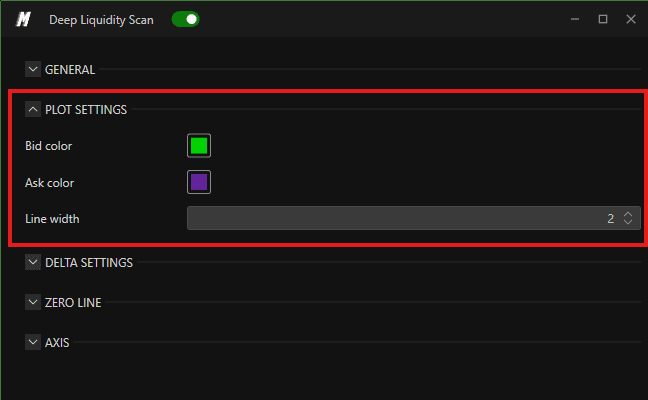
Plot Settings
These settings control the visual appearance of the Bid and Ask lines on the indicator panel.
1. Bid Color - Sets the color of the line that represents Bid liquidity (the demand side). Choose a color that stands out clearly on your chart. Green is the default and is commonly used to represent buying interest.
2. Ask Color - Sets the color of the line that represents Ask liquidity (the supply side). Choose a color that contrasts with the Bid color so the two lines are easy to distinguish at a glance. Purple or red are commonly used to represent selling interest.
3. Line Width - Sets the thickness of both the Bid and Ask lines. A higher number makes the lines thicker and easier to see. A lower number keeps them thin and less intrusive on the chart. Adjust this based on your screen size and personal preference.
Delta Settings
The Delta is one of the most important readings the indicator provides. It shows you the difference between Bid liquidity and Ask liquidity at any given moment — in other words, which side of the market currently has more passive orders sitting in the book, and by how much.
1. Delta Enable
This is a simple on/off toggle for the Delta display. When turned on, the Delta is shown as either a line or a histogram alongside the Bid and Ask lines. When turned off, only the Bid and Ask lines are displayed.
Turn this on if you want to actively monitor the imbalance between buyers and sellers. Turn it off if you prefer a cleaner chart showing only raw Bid and Ask liquidity.

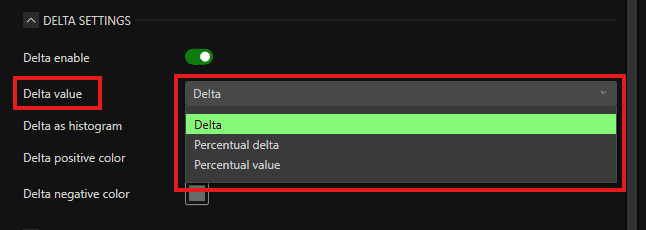
2. Delta Value
This setting defines exactly what the Delta is measuring and how it is calculated. There are three options:
Delta: This is the raw, absolute difference between Bid liquidity and Ask liquidity. If there are 500 units of Bid liquidity and 300 units of Ask liquidity, the Delta reads +200. This is the most direct way to see the imbalance in real numbers.
Percentual Delta: Instead of showing the raw difference, this expresses the imbalance as a percentage of the total liquidity. Using the same example, the total is 800 units and the Bid has 200 more than the Ask, so the Percentual Delta would show +25%. This is useful when you want to compare the relative imbalance rather than the absolute size.
Percentual Value: This shows the Bid or Ask liquidity expressed as a percentage of the total combined liquidity. For example, if Bid is 500 out of a total of 800, it would show approximately 62.5%. This gives you a proportion view of how much each side accounts for.
When to use Delta: When you want to see the raw size of the imbalance in market terms.
When to use Percentual Delta: When you want to normalize the imbalance and compare it across different market conditions or instruments.
When to use Percentual Value: When you want to see what share of total liquidity each side represents at any moment.
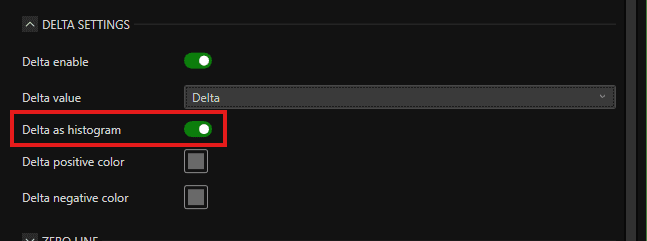
3. Delta as Histogram
This toggle changes how the Delta is displayed on the chart.
Histogram (toggled on): The Delta is shown as a bar chart. Each bar grows up (positive) or down (negative) from the zero line depending on which side has more liquidity. The taller the bar, the stronger the imbalance. This makes it very easy to see sudden spikes and reversals in the balance of liquidity at a glance.
Line (toggled off): The Delta is shown as a continuous line that moves up and down around the zero line. This is better for tracking the smooth trend and direction of the imbalance over time — for example, whether Bid dominance is gradually building or fading.
When to use histogram: When you are actively watching for sudden shifts or spikes in liquidity imbalance and want a clear, immediate visual signal.
When to use line: When you want to follow the overall trend of the imbalance and see whether it is consistently growing or shrinking in one direction.
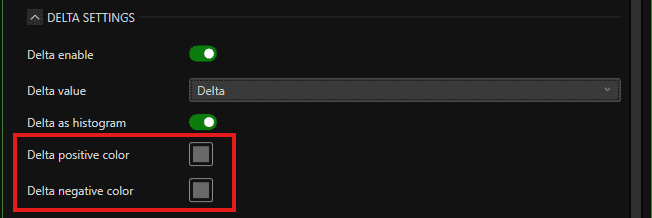
4. Delta Positive Color
Sets the color used for the Delta when it is positive — meaning Bid liquidity is greater than Ask liquidity. This color fills the histogram bars or colors the line when buyers have more passive orders in the book than sellers.
5. Delta Negative Color
Sets the color used for the Delta when it is negative — meaning Ask liquidity is greater than Bid liquidity. This color fills the histogram bars or colors the line when sellers have more passive orders in the book than buyers.
Zero Line
The zero line is the horizontal line at the center of the Delta display. It marks the exact point where Bid and Ask liquidity are equal — neither side has more than the other. When the Delta is above the zero line, Bid liquidity dominates. When it is below, Ask liquidity dominates. When it crosses, the balance has just shifted.
1. Zero Line Color
Sets the color of the zero line. Choose a color that is visible but does not distract from the Bid, Ask, and Delta lines. A neutral color like white or grey works well for most chart themes.
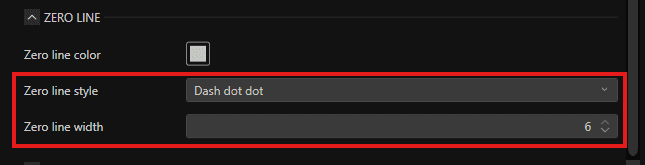
Zero Line Style
Defines the visual style of the zero line. Options include:
Solid — a continuous unbroken line.
Dash — a dashed line.
Dot — a dotted line.
Dash Dot — alternates between a dash and a dot.
Dash Dot Dot — alternates between a dash and two dots.
3. Zero Line Width
Sets the thickness of the zero line. Keep it thin enough that it does not visually compete with the Delta line or histogram. A width of 1 is usually sufficient.
Zero Line View -
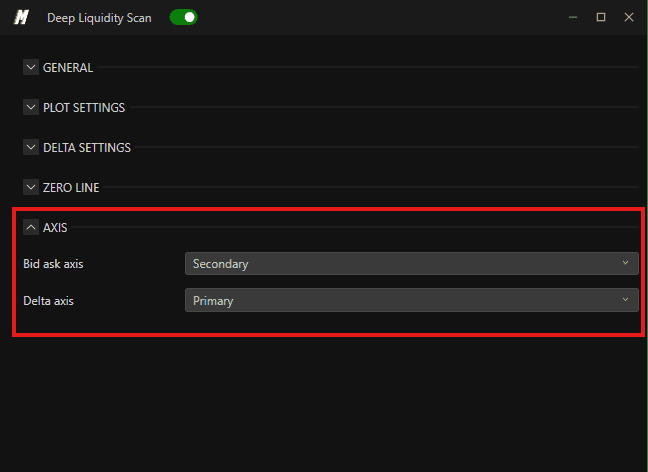
Axis
These settings control which scale each part of the indicator is measured against. This is important because the Bid and Ask values can be very large numbers, while the Delta is a smaller difference between them. Putting them on the same scale can make one appear flat or unreadable.
1. Bid Ask Axis
Defines which axis the Bid and Ask lines are scaled against:
Primary: The Bid and Ask lines are plotted against the right axis, using their own independent scale.
Secondary: The Bid and Ask lines are plotted against the left axis.
2. Delta Axis
Defines which axis the Delta line or histogram is scaled against:
Primary: The Delta is plotted against the right axis with its own scale.
Secondary: The Delta is plotted against the left axis.
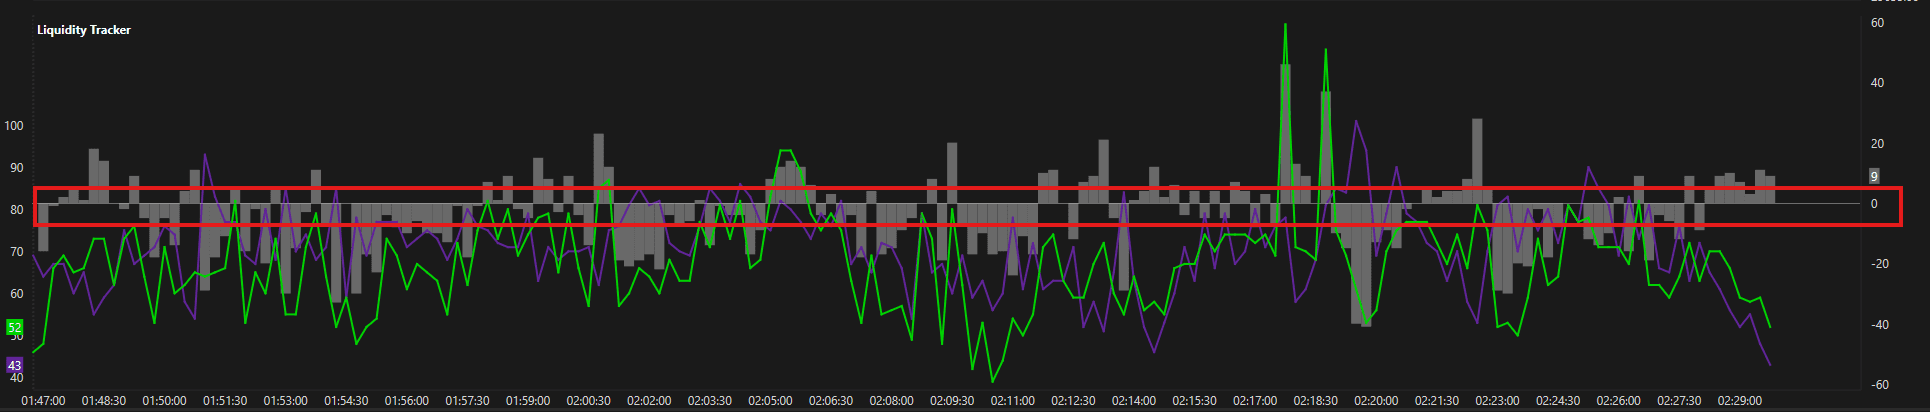
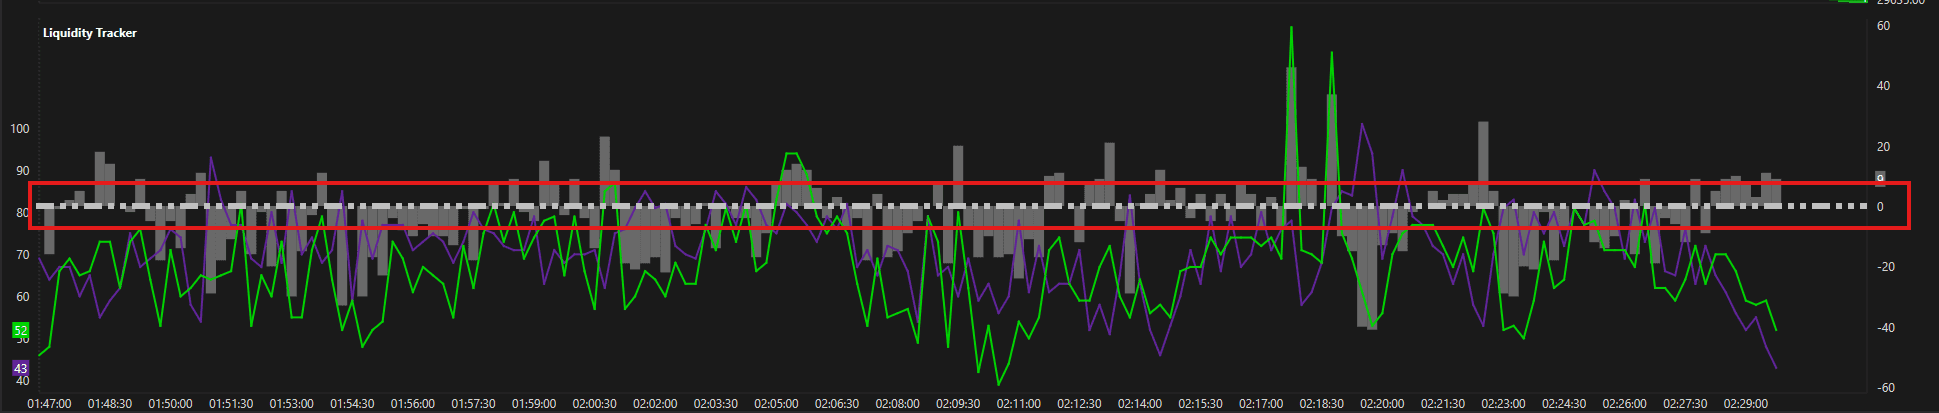
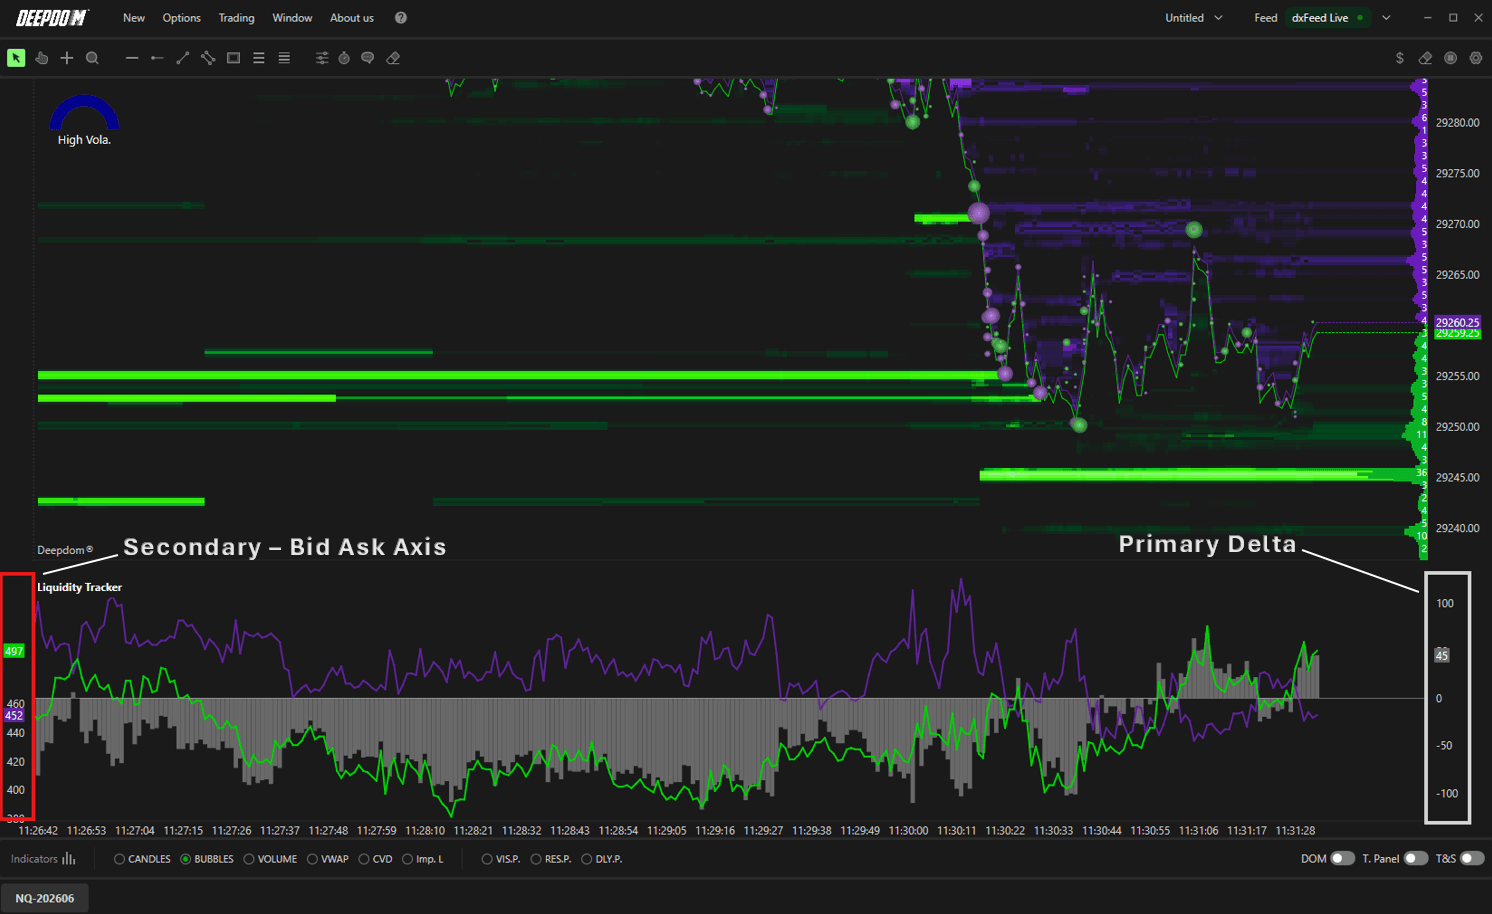
Tip: As shown in the example above, the recommended setup is to place the Bid Ask Axis on Secondary (left axis) and theDelta Axis on Primary (right axis). This keeps the Delta clearly readable on the right side, while the Bid and Ask lines scale independently on the left. This prevents the large Bid and Ask values from compressing the Delta into an unreadable flat line.
Axis View -
Bid Ask Axis - Secondary
Delta Axis - Primary
Conclusion
The Deep Liquidity Scan gives you a real-time view of where passive liquidity is building and shifting in the DOM. By monitoring the balance between Bid and Ask liquidity and watching for meaningful changes in the Delta — especially when it crosses the zero line — you can gain early insight into potential price reactions before they become visible in price action alone.
Combined with the Heatmap or DOM panel, this indicator becomes a powerful tool for understanding the full picture of order flow and market intent.
Still Having Trouble?
Our support team is available 24/7 and ready to help you with any issue you encounter.
When reaching out, please include:
A screenshot of the issue
A brief description of what you were trying to do
Support Ticket (Fastest Response) Visit www.deepcharts.com and create a support ticket directly on our website.
Email Support Reach us at support@deepcharts.com — please note that email responses may take a little longer than a support ticket.