


Financial markets are often interpreted through price charts.
Traders observe candles, breakouts, and support or resistance levels to understand where the market might move next.
But every price movement is the result of transactions happening behind the chart: buyers and sellers exchanging contracts inside the order book.
Some of these transactions are small and relatively insignificant. Others are large enough to reveal the presence of institutional participants deploying meaningful capital.
These large executions are known as Deep Trades.
By observing them, traders can begin to identify where significant liquidity is entering the market and where real buying or selling pressure is developing.
In this guide you will learn:
Why Deep Trades reveal what price action often hides
What Deep Trades are and how they form
How professional traders use them inside real trading patterns
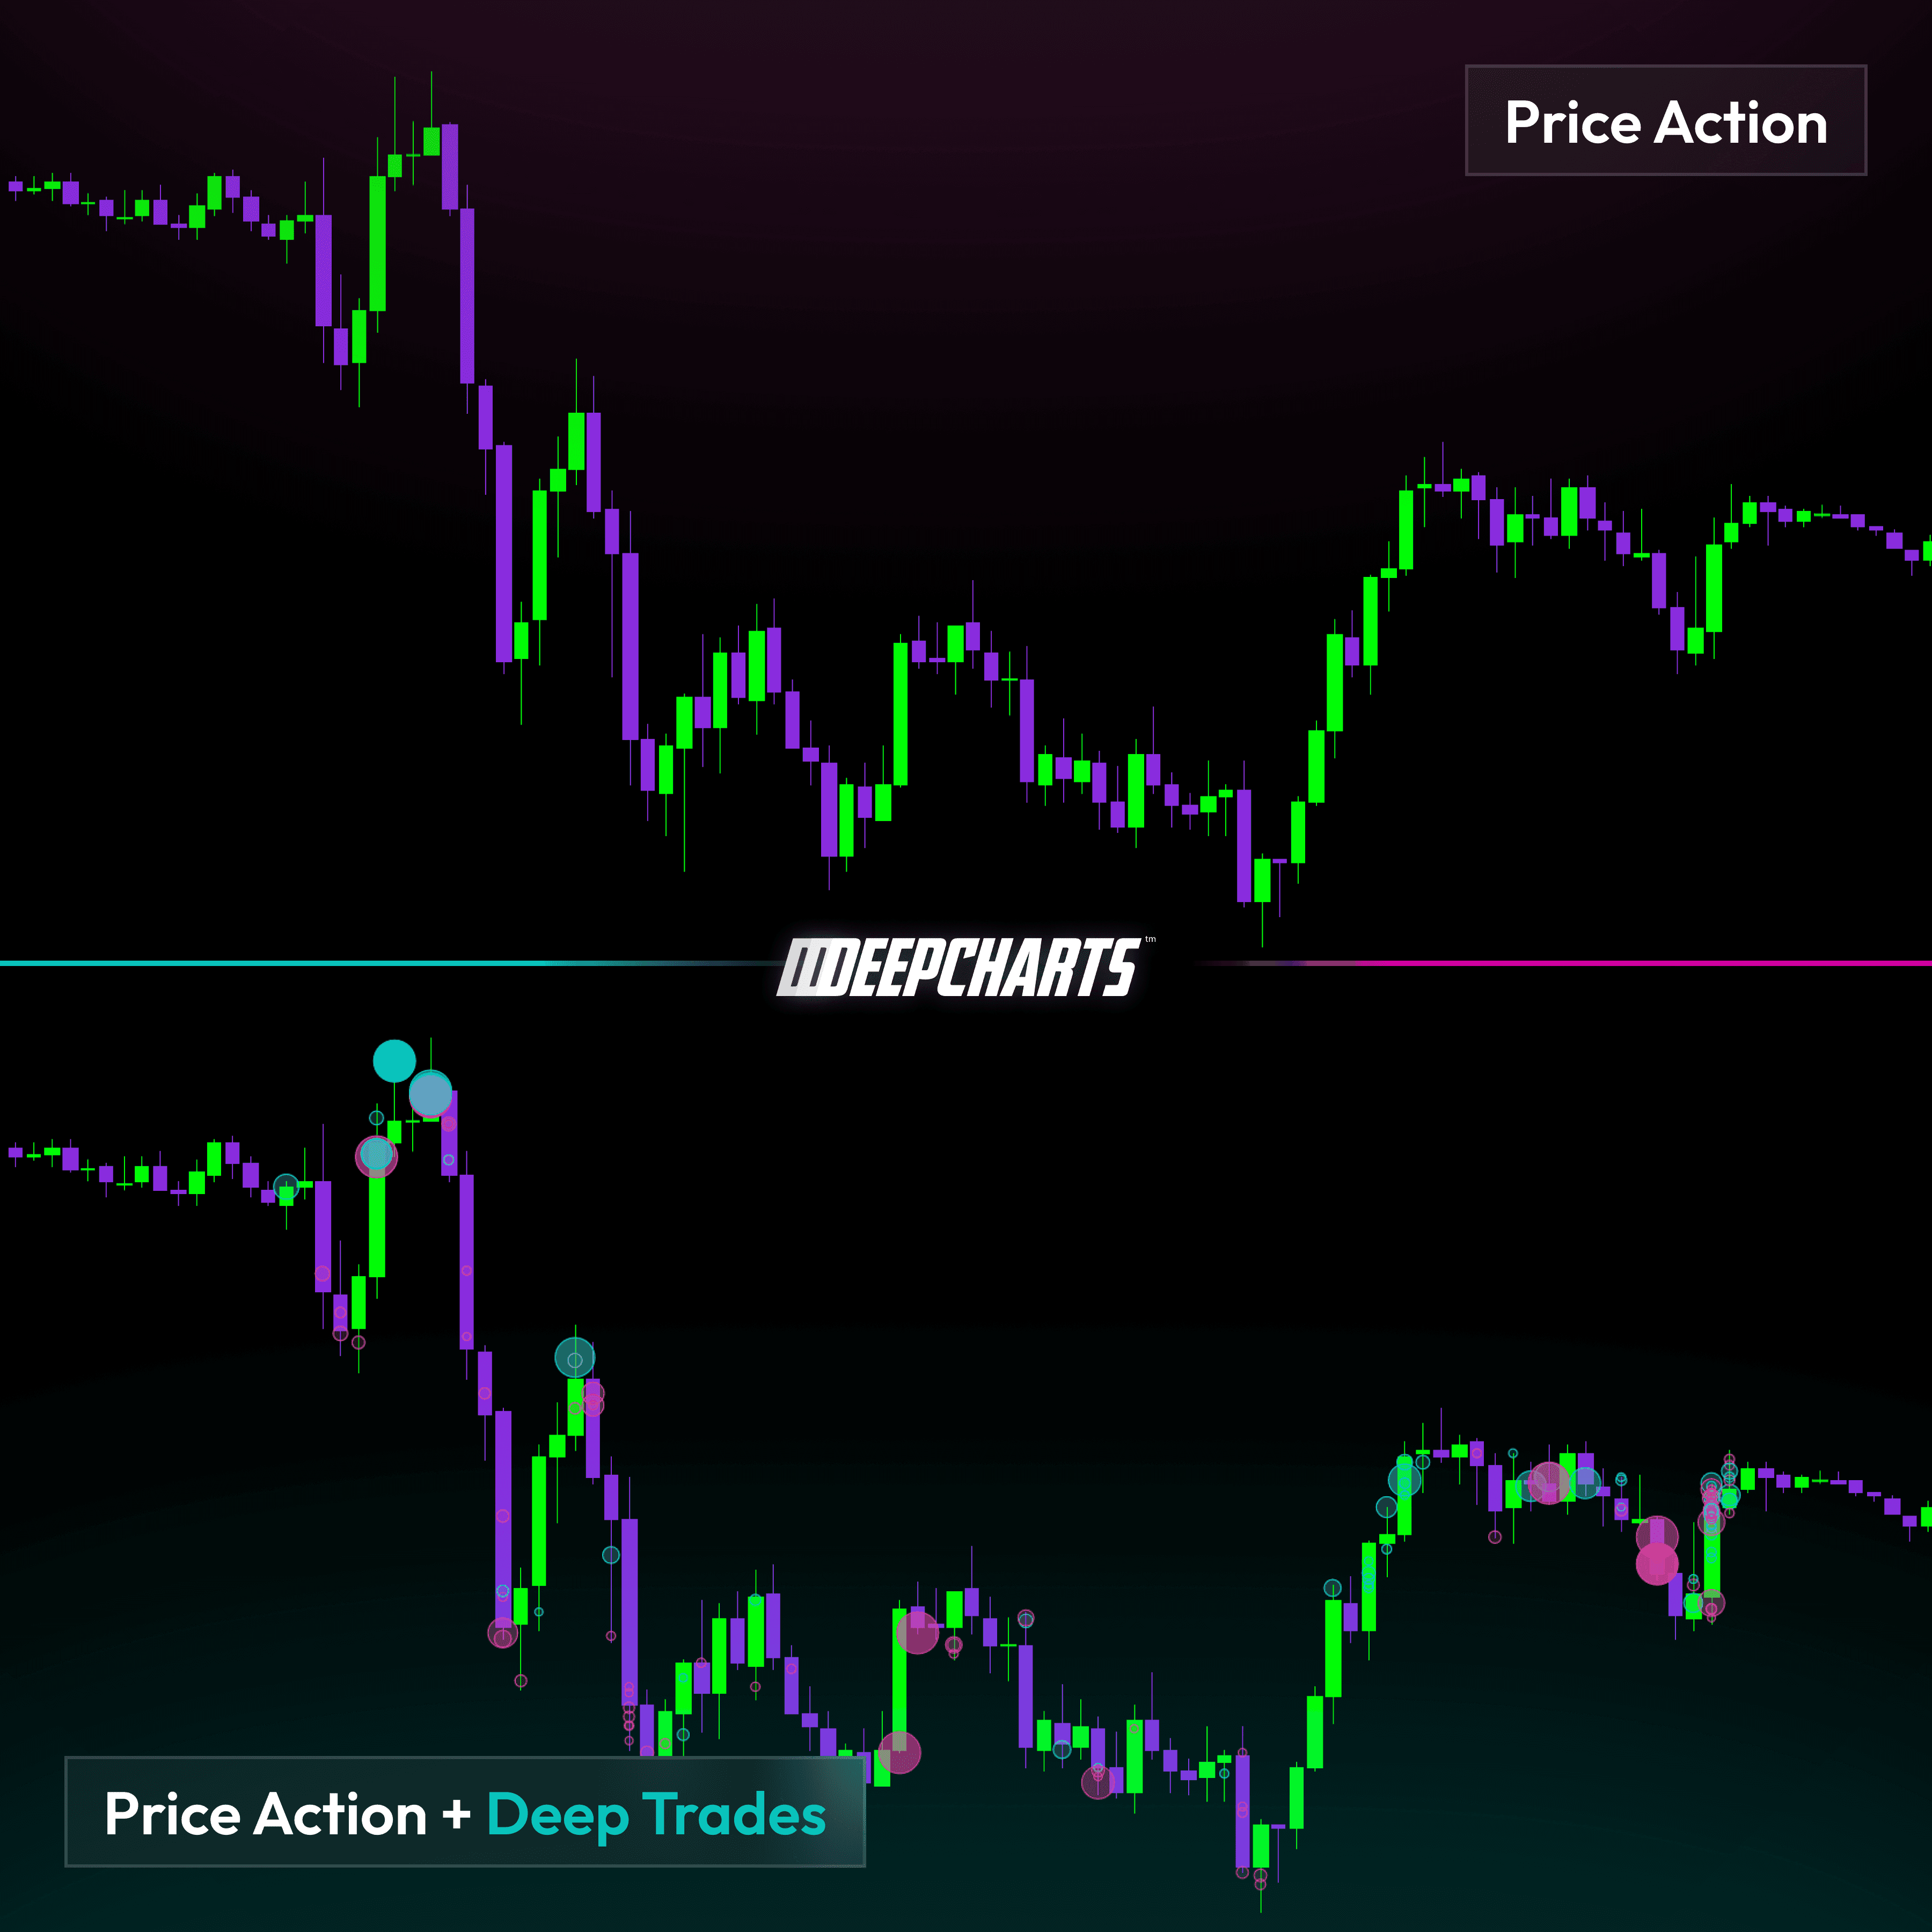
Why Deep Trades Reveal What Price Action Hides
Price charts summarize the outcome of trading activity, but they don’t reveal the intensity behind each move.
A candle on the chart simply shows that price moved from one level to another. It does not show whether that movement was caused by a handful of small orders or by a wave of aggressive institutional executions.
Two identical candles can therefore represent very different situations. One may result from light retail participation, while the other may reflect large funds aggressively entering the market.
This is where Deep Trades become valuable.
By highlighting unusually large transactions, they reveal where significant participants are actively interacting with the market. Instead of interpreting movements purely through chart patterns, traders can observe where real liquidity is being consumed and where strong pressure is emerging
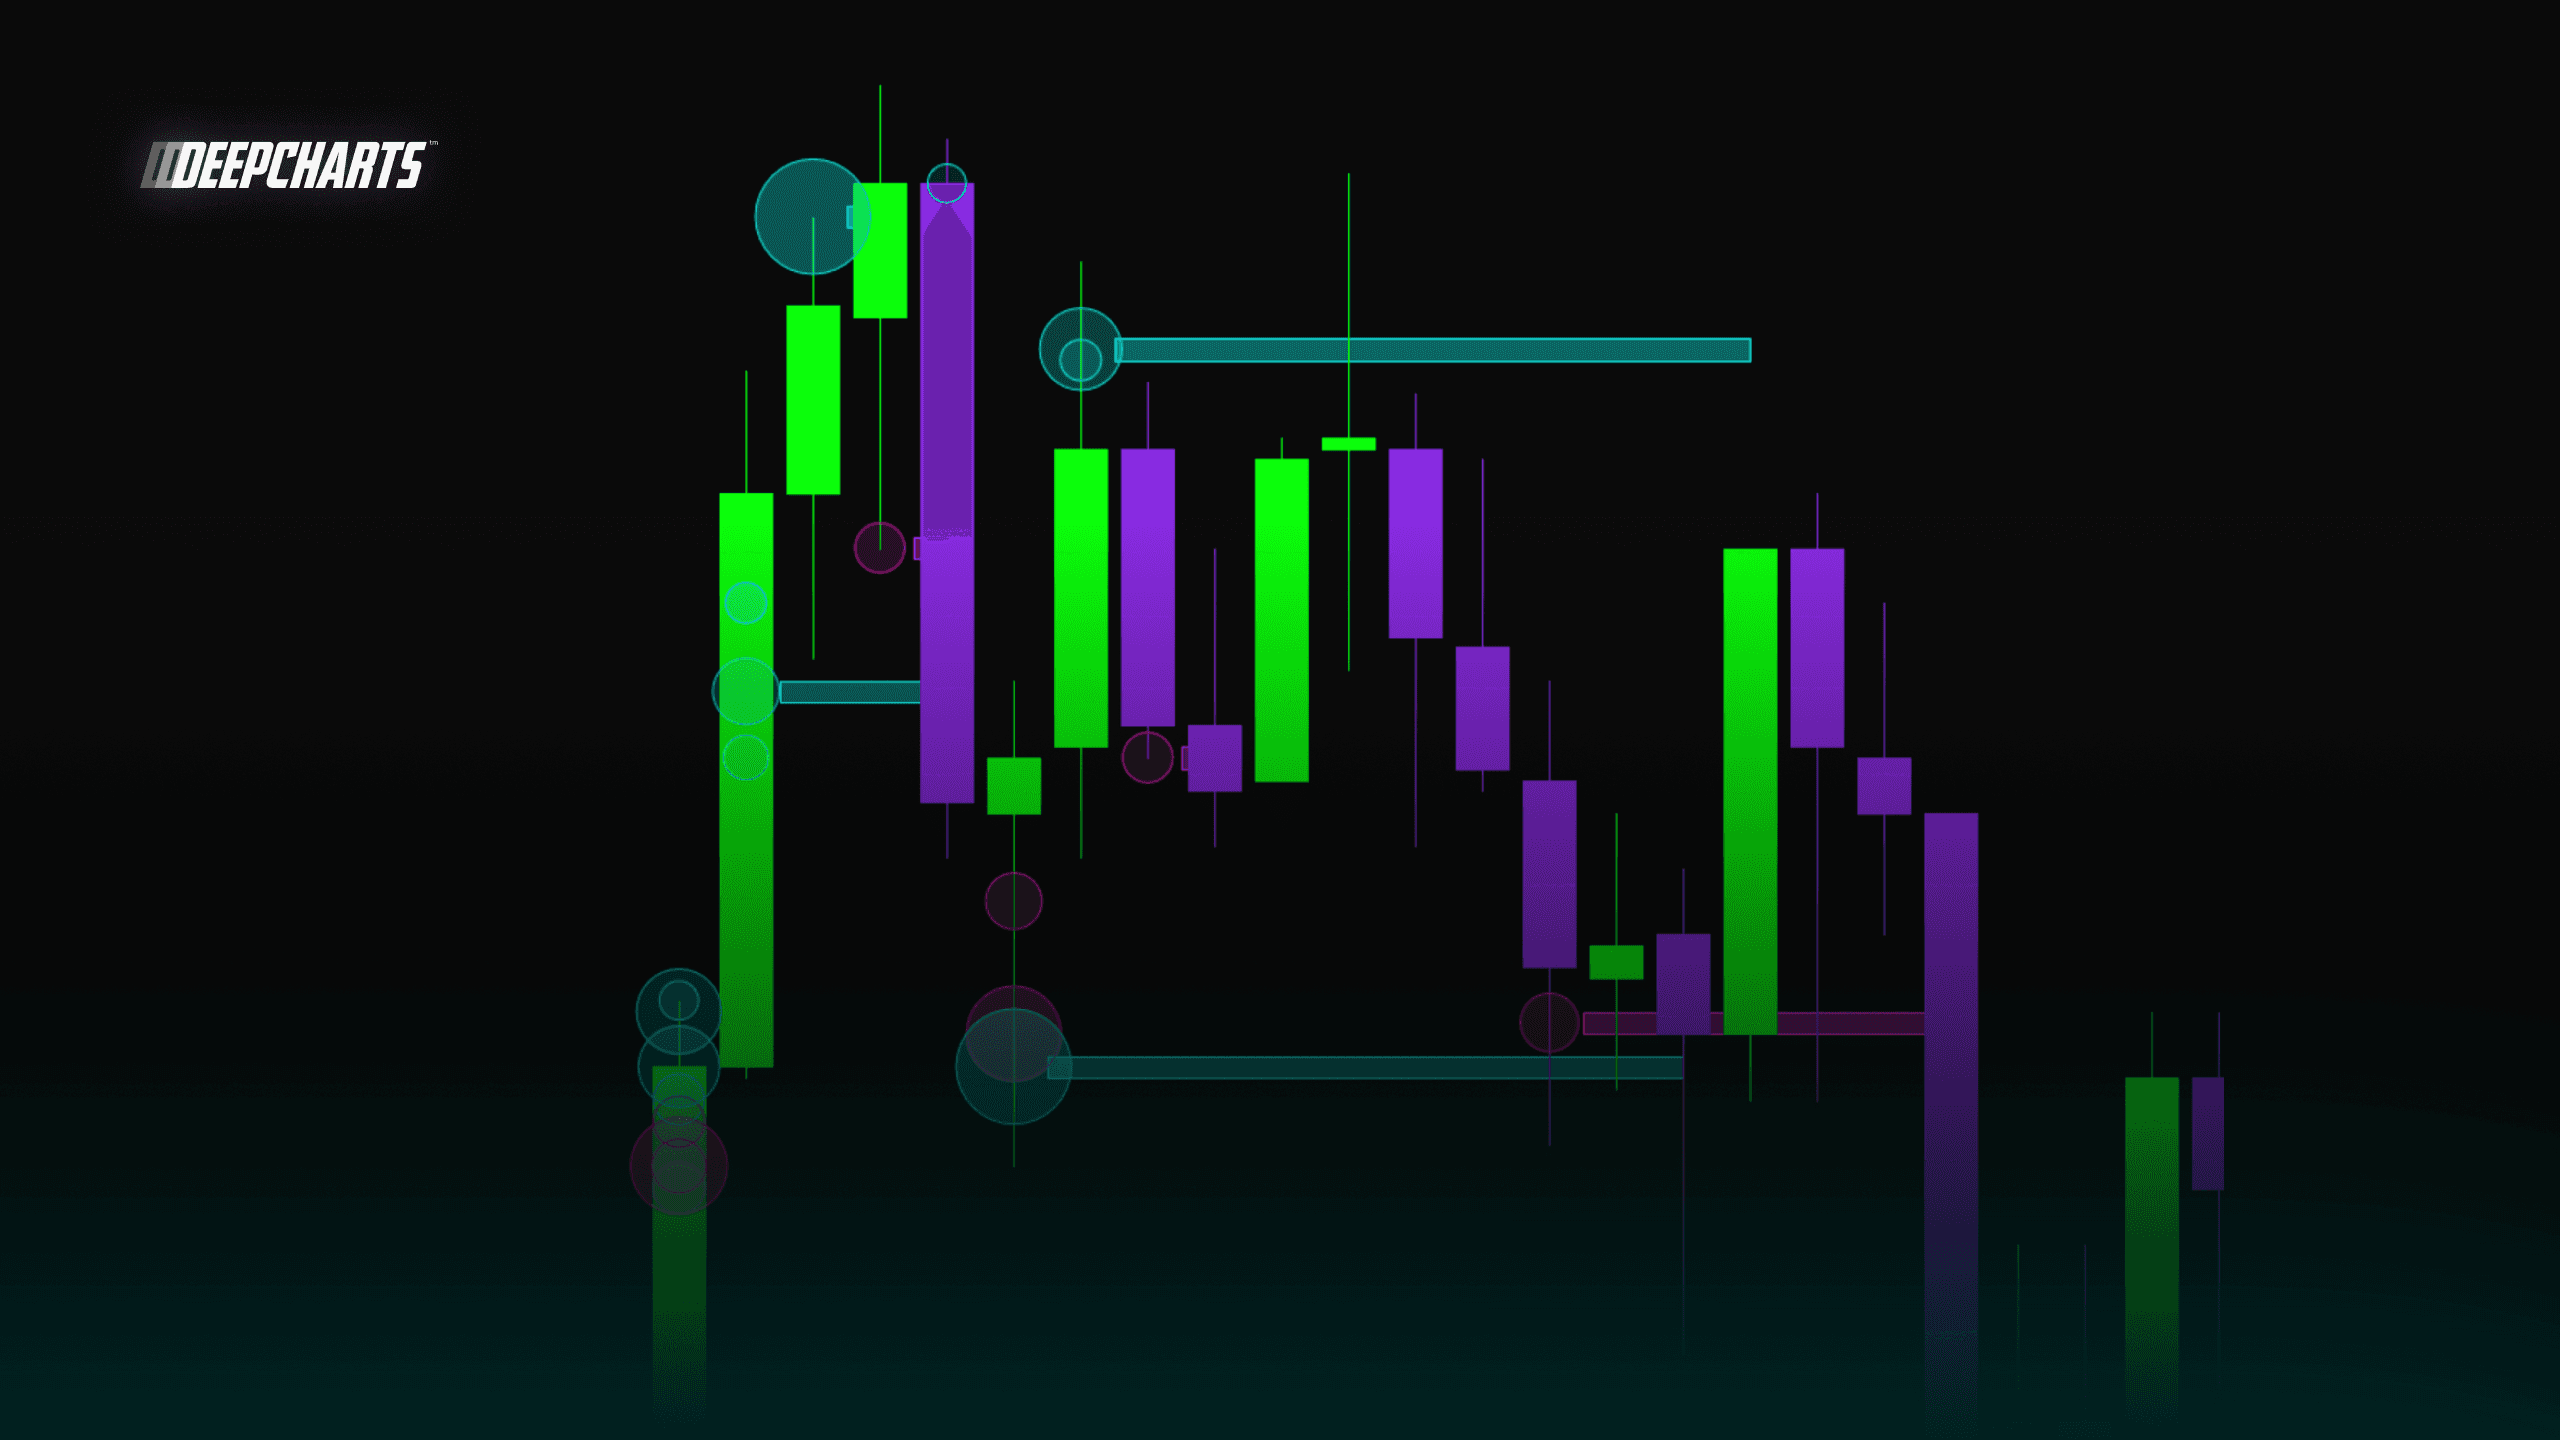
What Are Deep Trades
Deep Trades are unusually large executed orders that appear on the order flow when a participant sends a significant amount of contracts into the market.
Every trade in a market happens when a buyer and a seller are matched. But not all trades carry the same informational value. Small orders are often noise (retail activity or small algorithmic executions).
Deep Trades, however, often represent institutional-sized transactions.
When a large market participant wants to enter or exit a position, they frequently need to execute large quantities of contracts. These orders appear as clusters of high-volume executions at specific price levels.
Depending on how they occur, Deep Trades can signal different types of activity:
Aggressive buying when large orders lift the ask price
Aggressive selling when large orders hit the bid
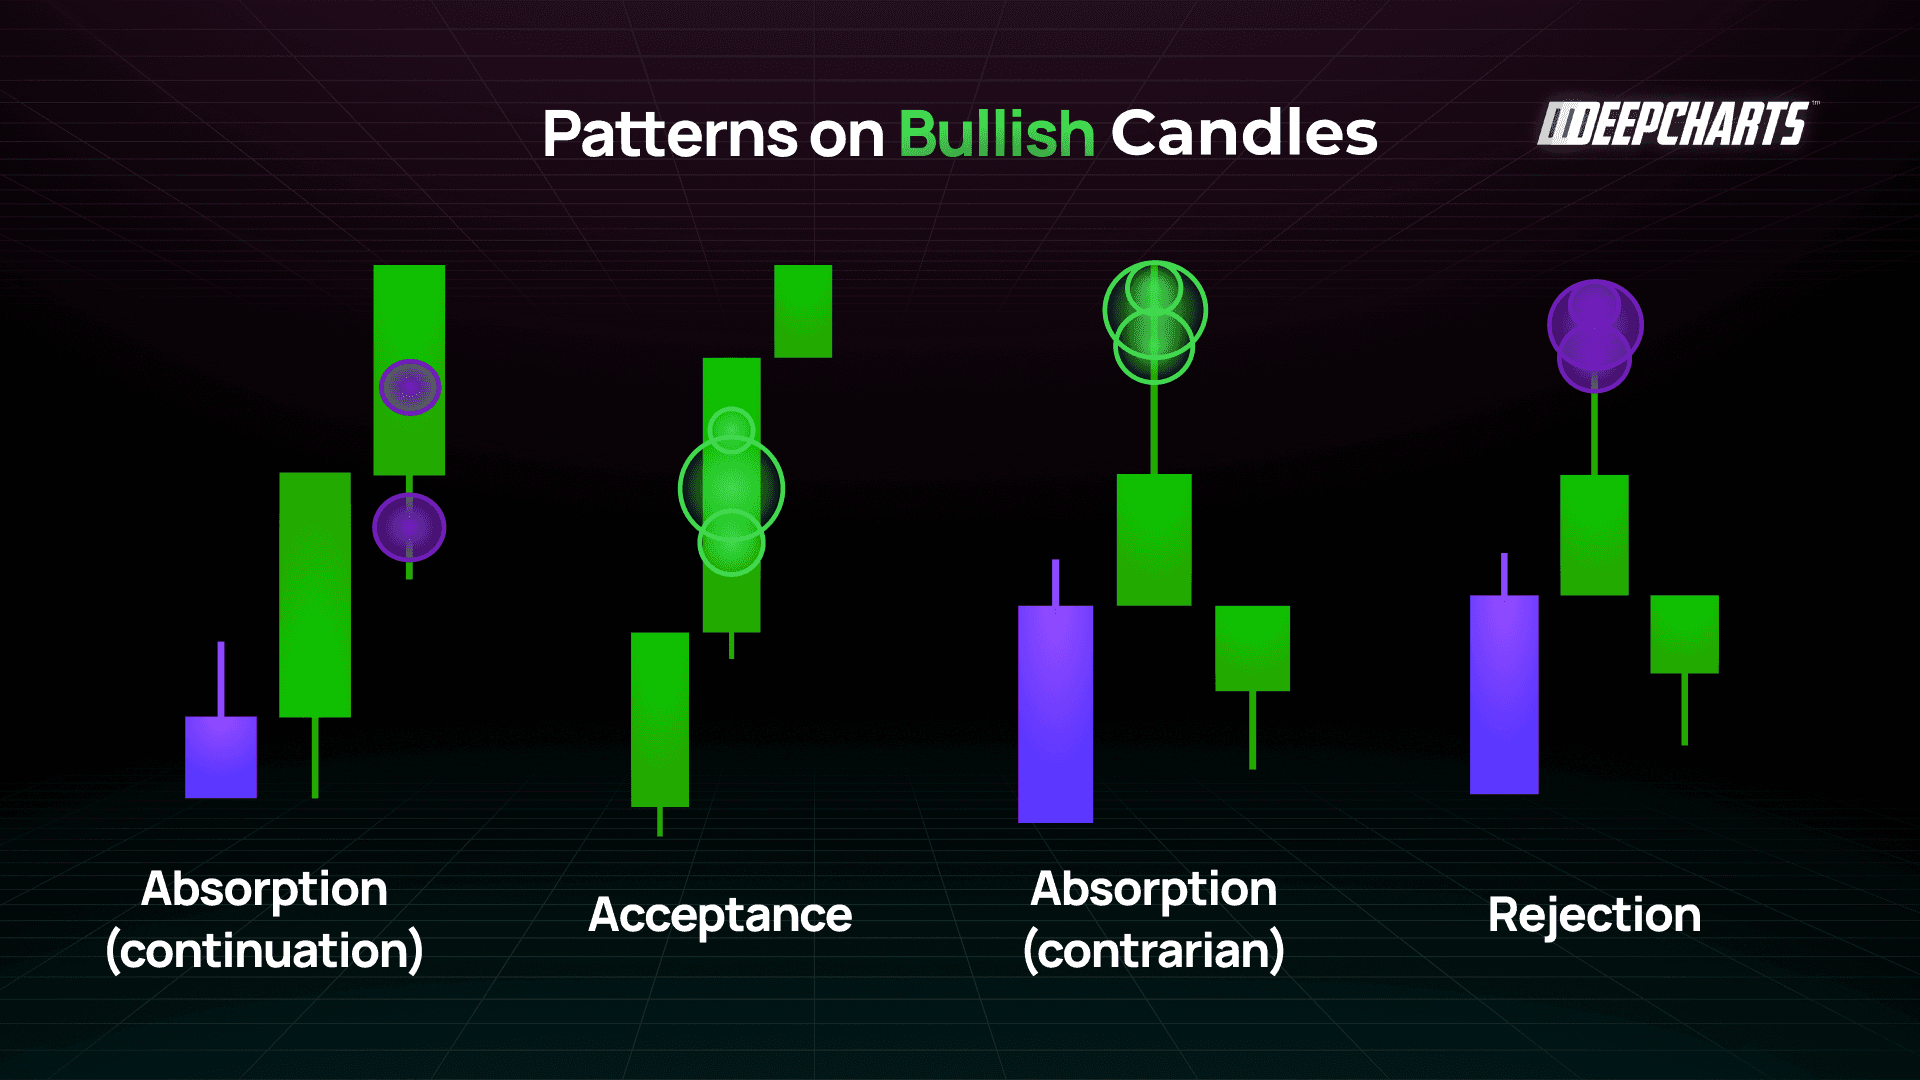
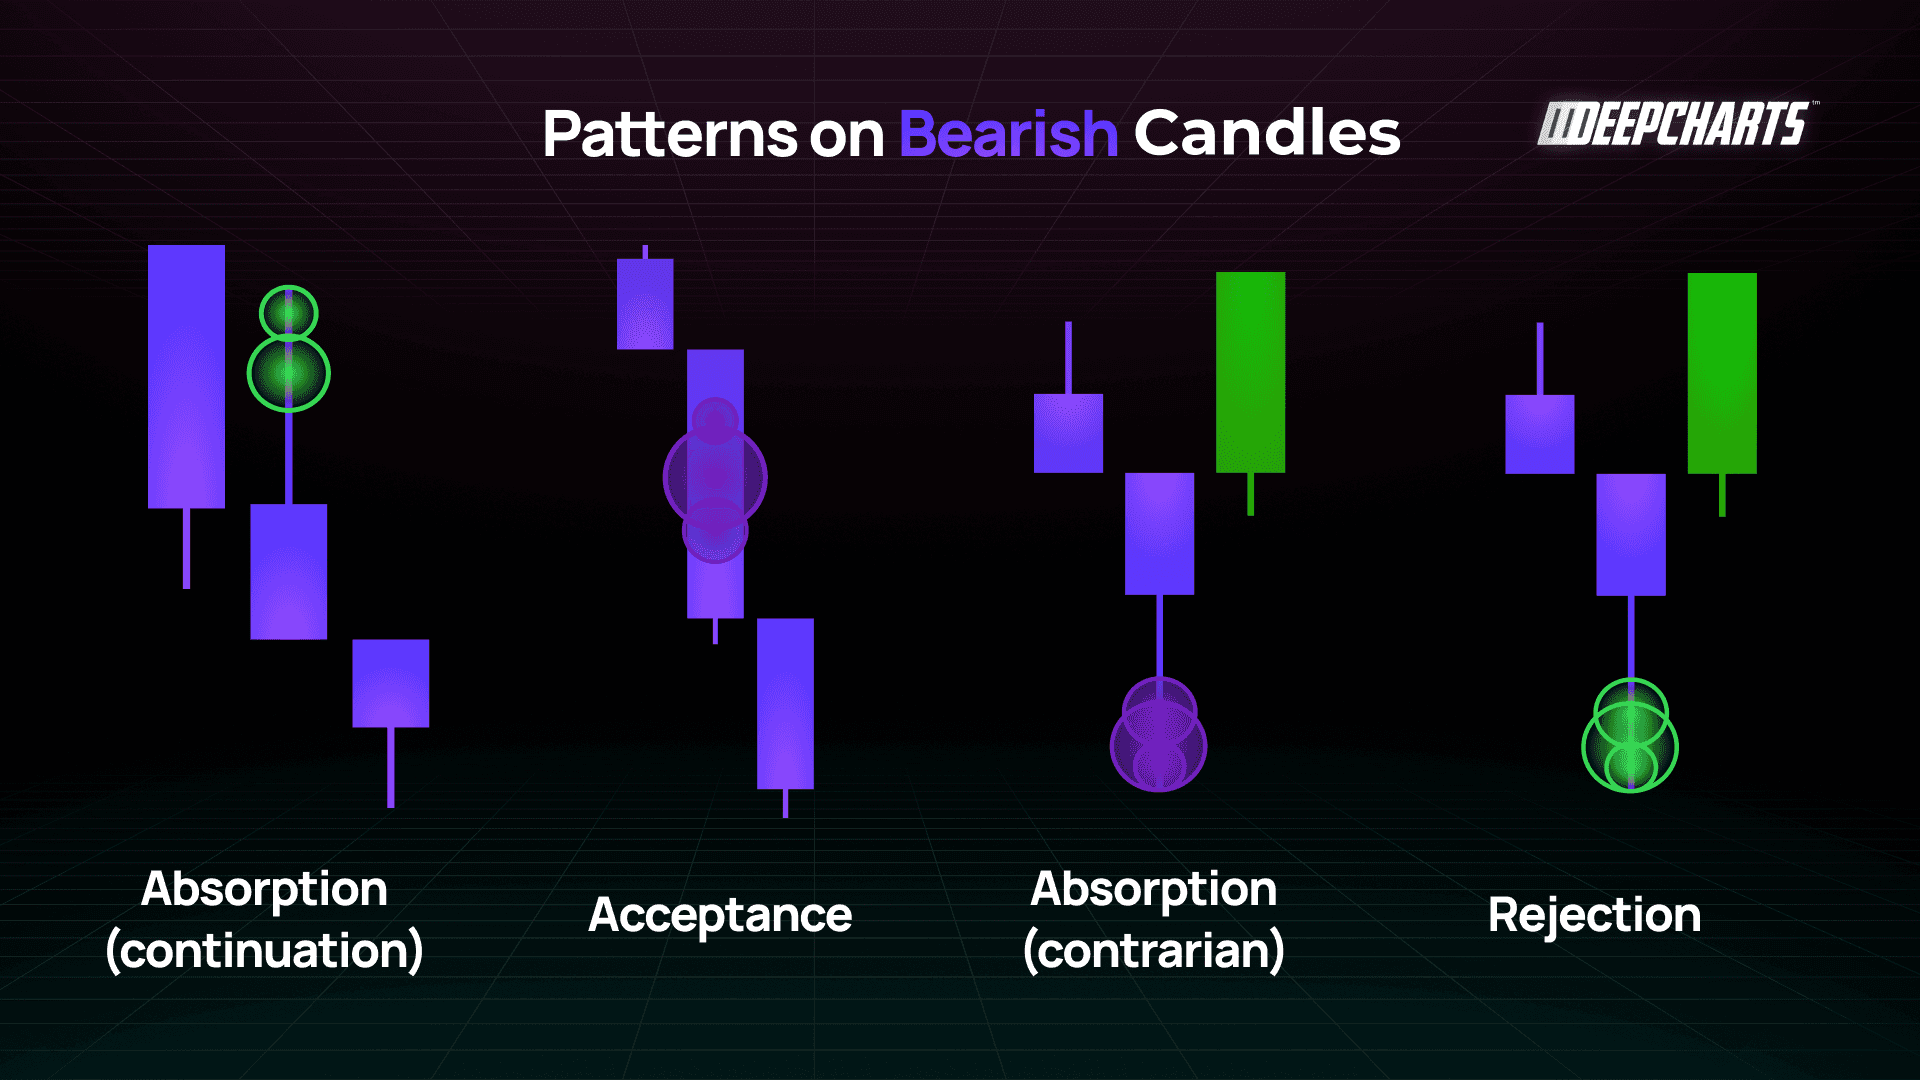
Absorption when large trades appear but price fails to move
Because they represent real capital being deployed, Deep Trades often highlight the levels where important battles between buyers and sellers take place.
This is why professional order flow traders monitor them closely: they provide a direct window into where liquidity is being consumed and where institutional players are active.
How to Use the Deep Trades Like Fabio Valentini
Deep Trades are most useful when interpreted within a structured trading framework rather than as isolated signals.
Traders like Fabio Valentini often use them as confirmation inside specific market patterns.
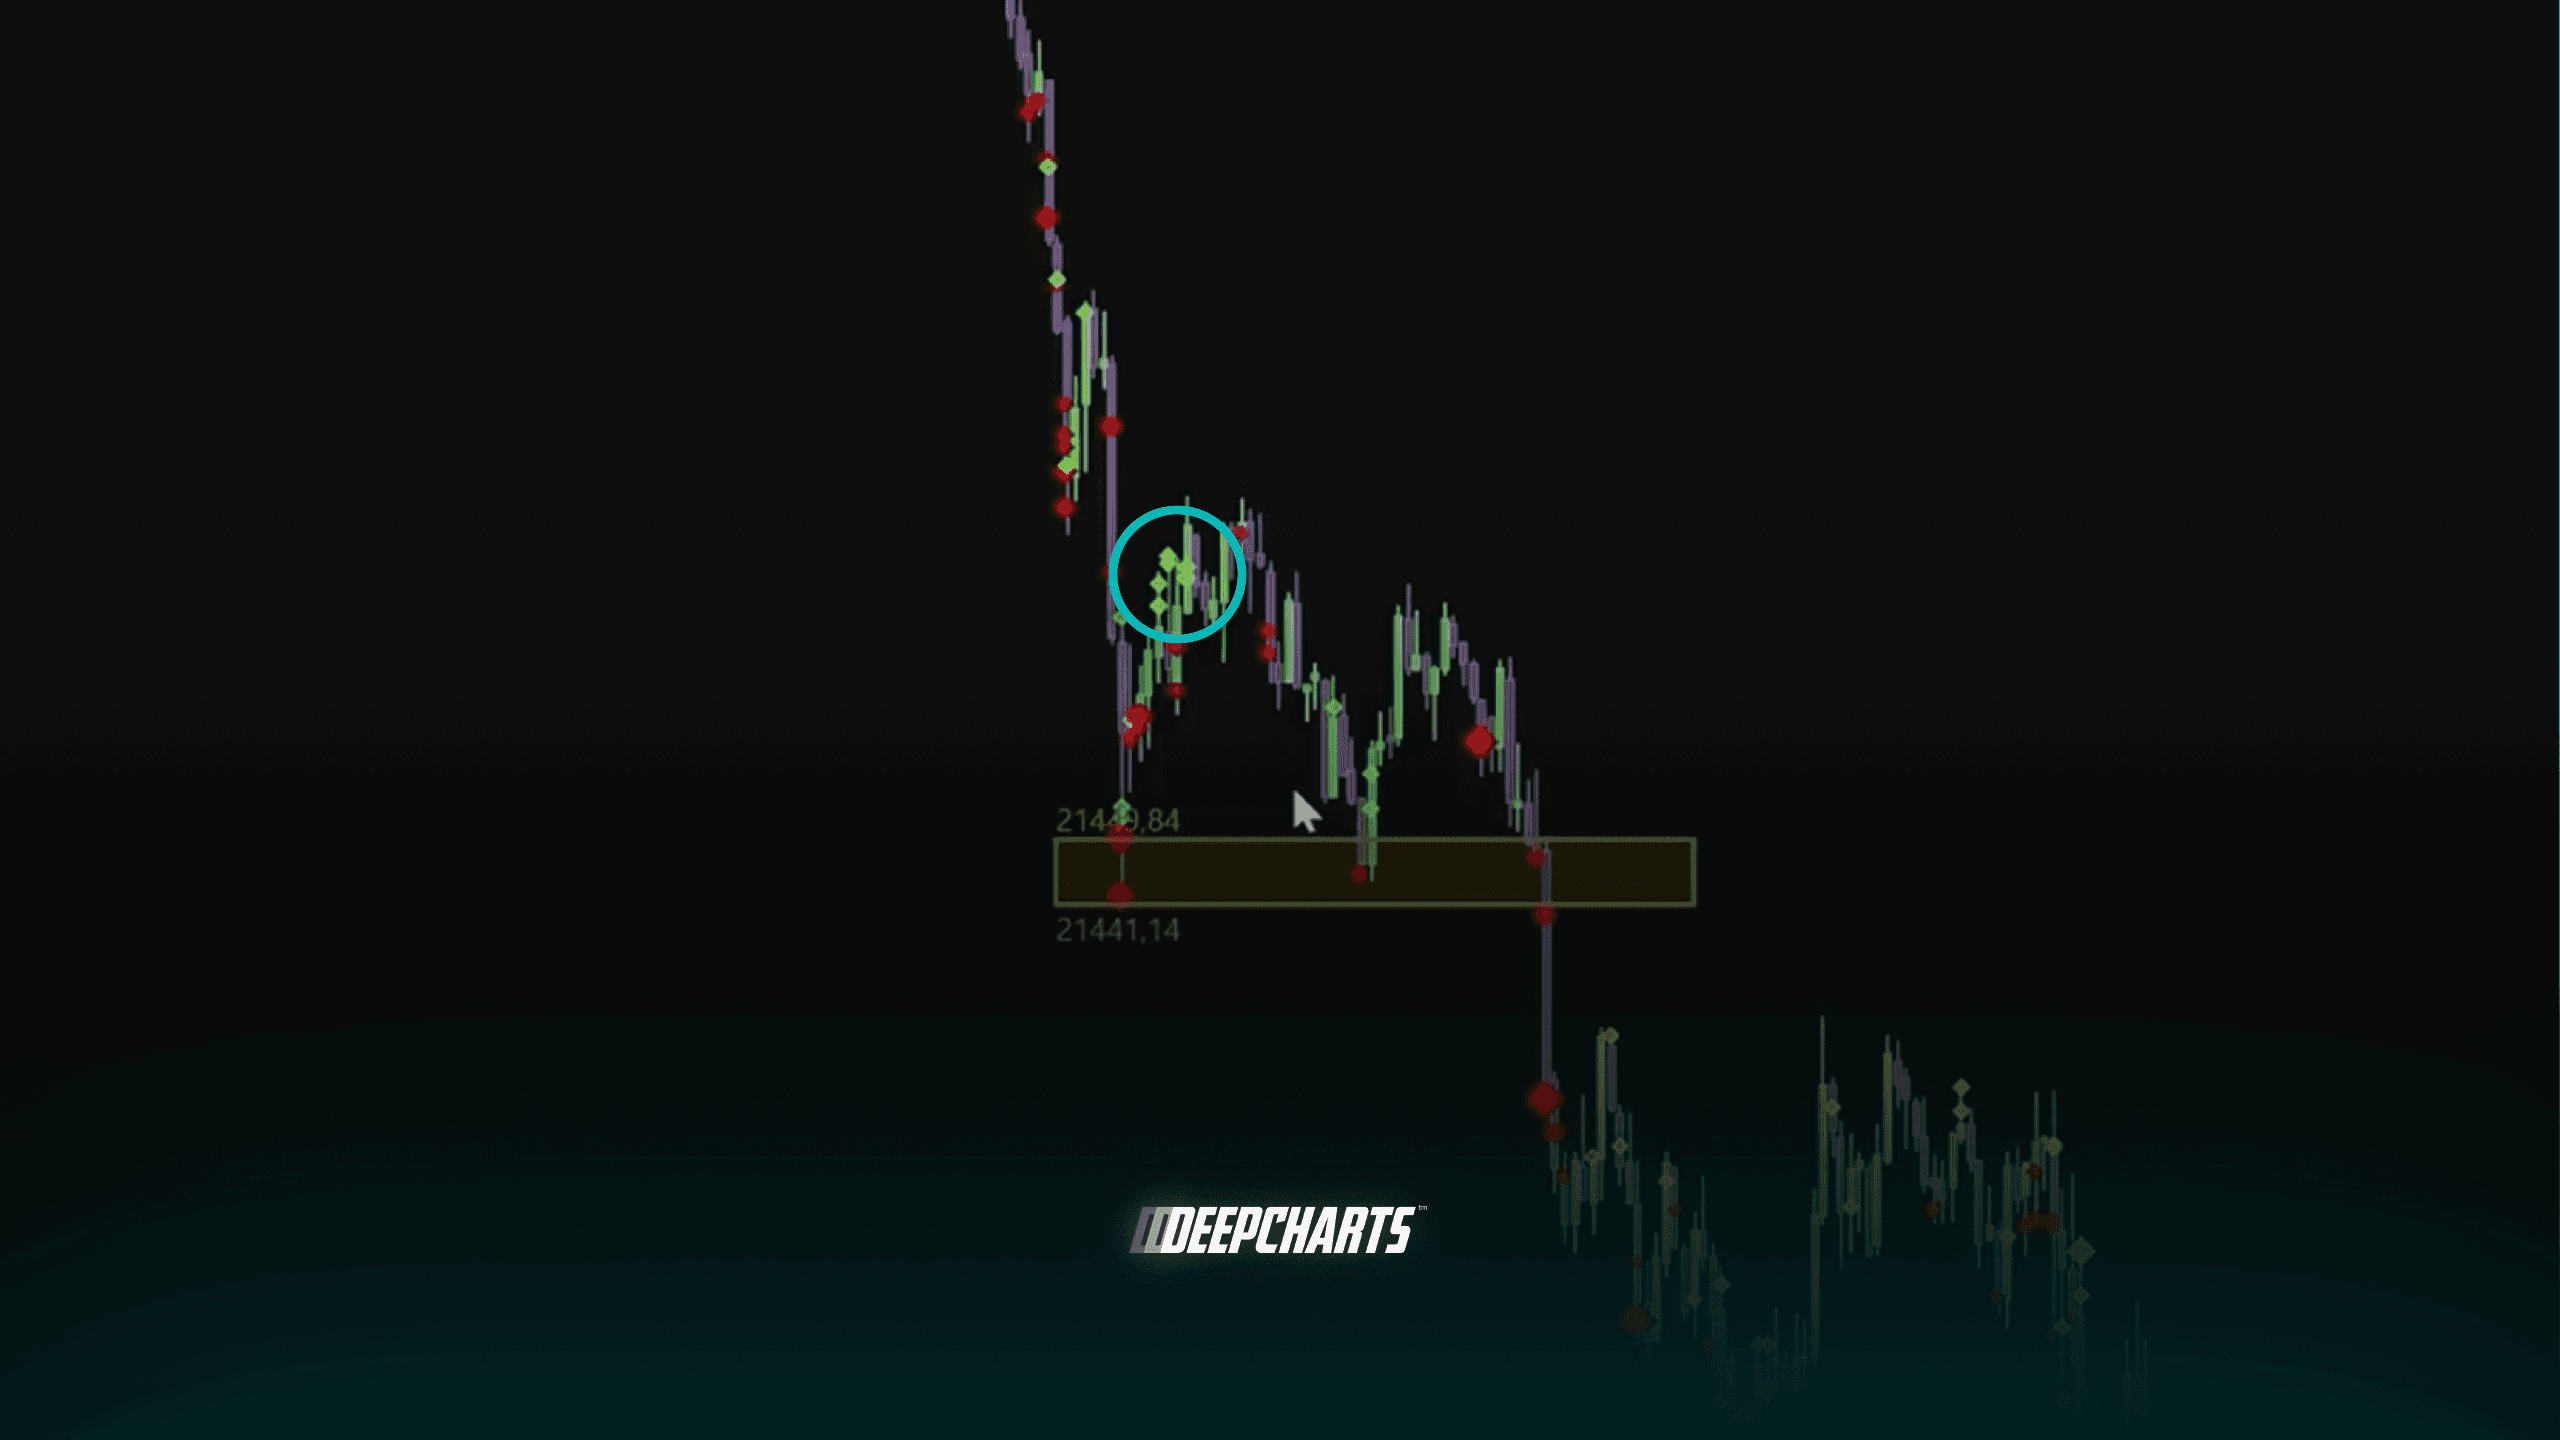
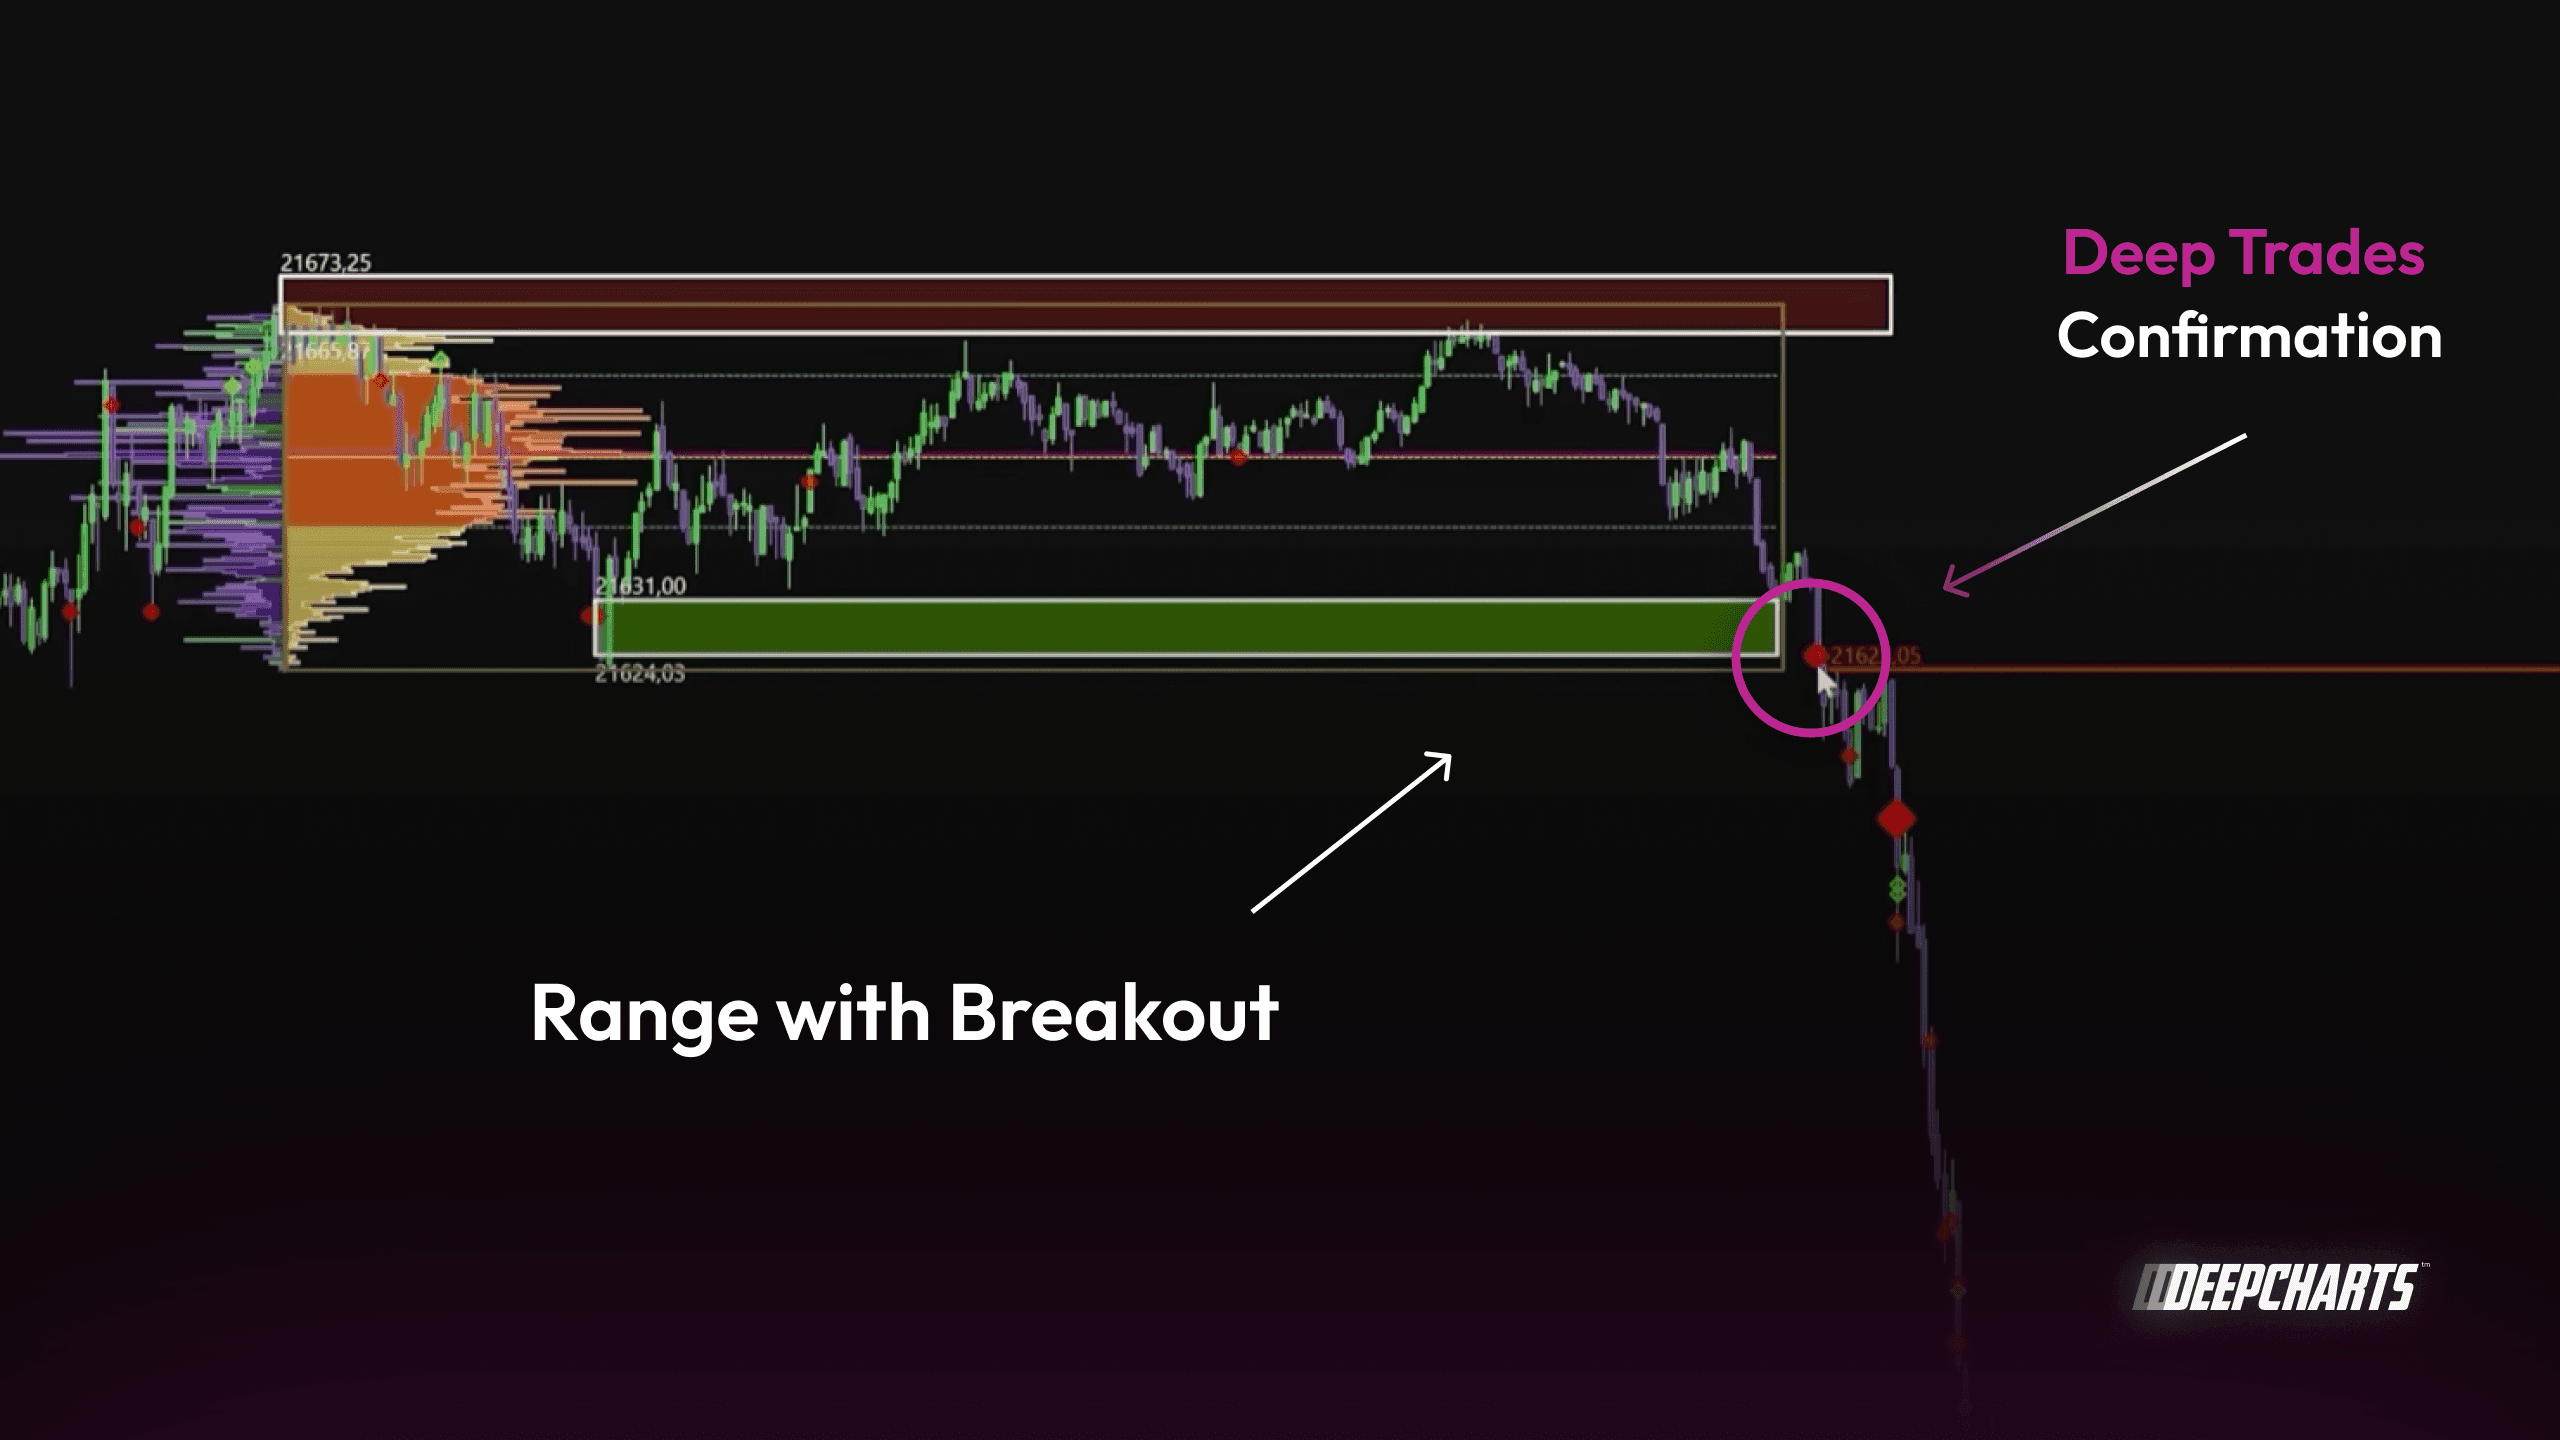
One common situation occurs during breakouts. When price breaks a key level and large aggressive orders appear in the direction of the move, Deep Trades confirm that strong participants are pushing the auction forward. The presence of large buyers above resistance or large sellers below support increases the probability that the breakout will continue.
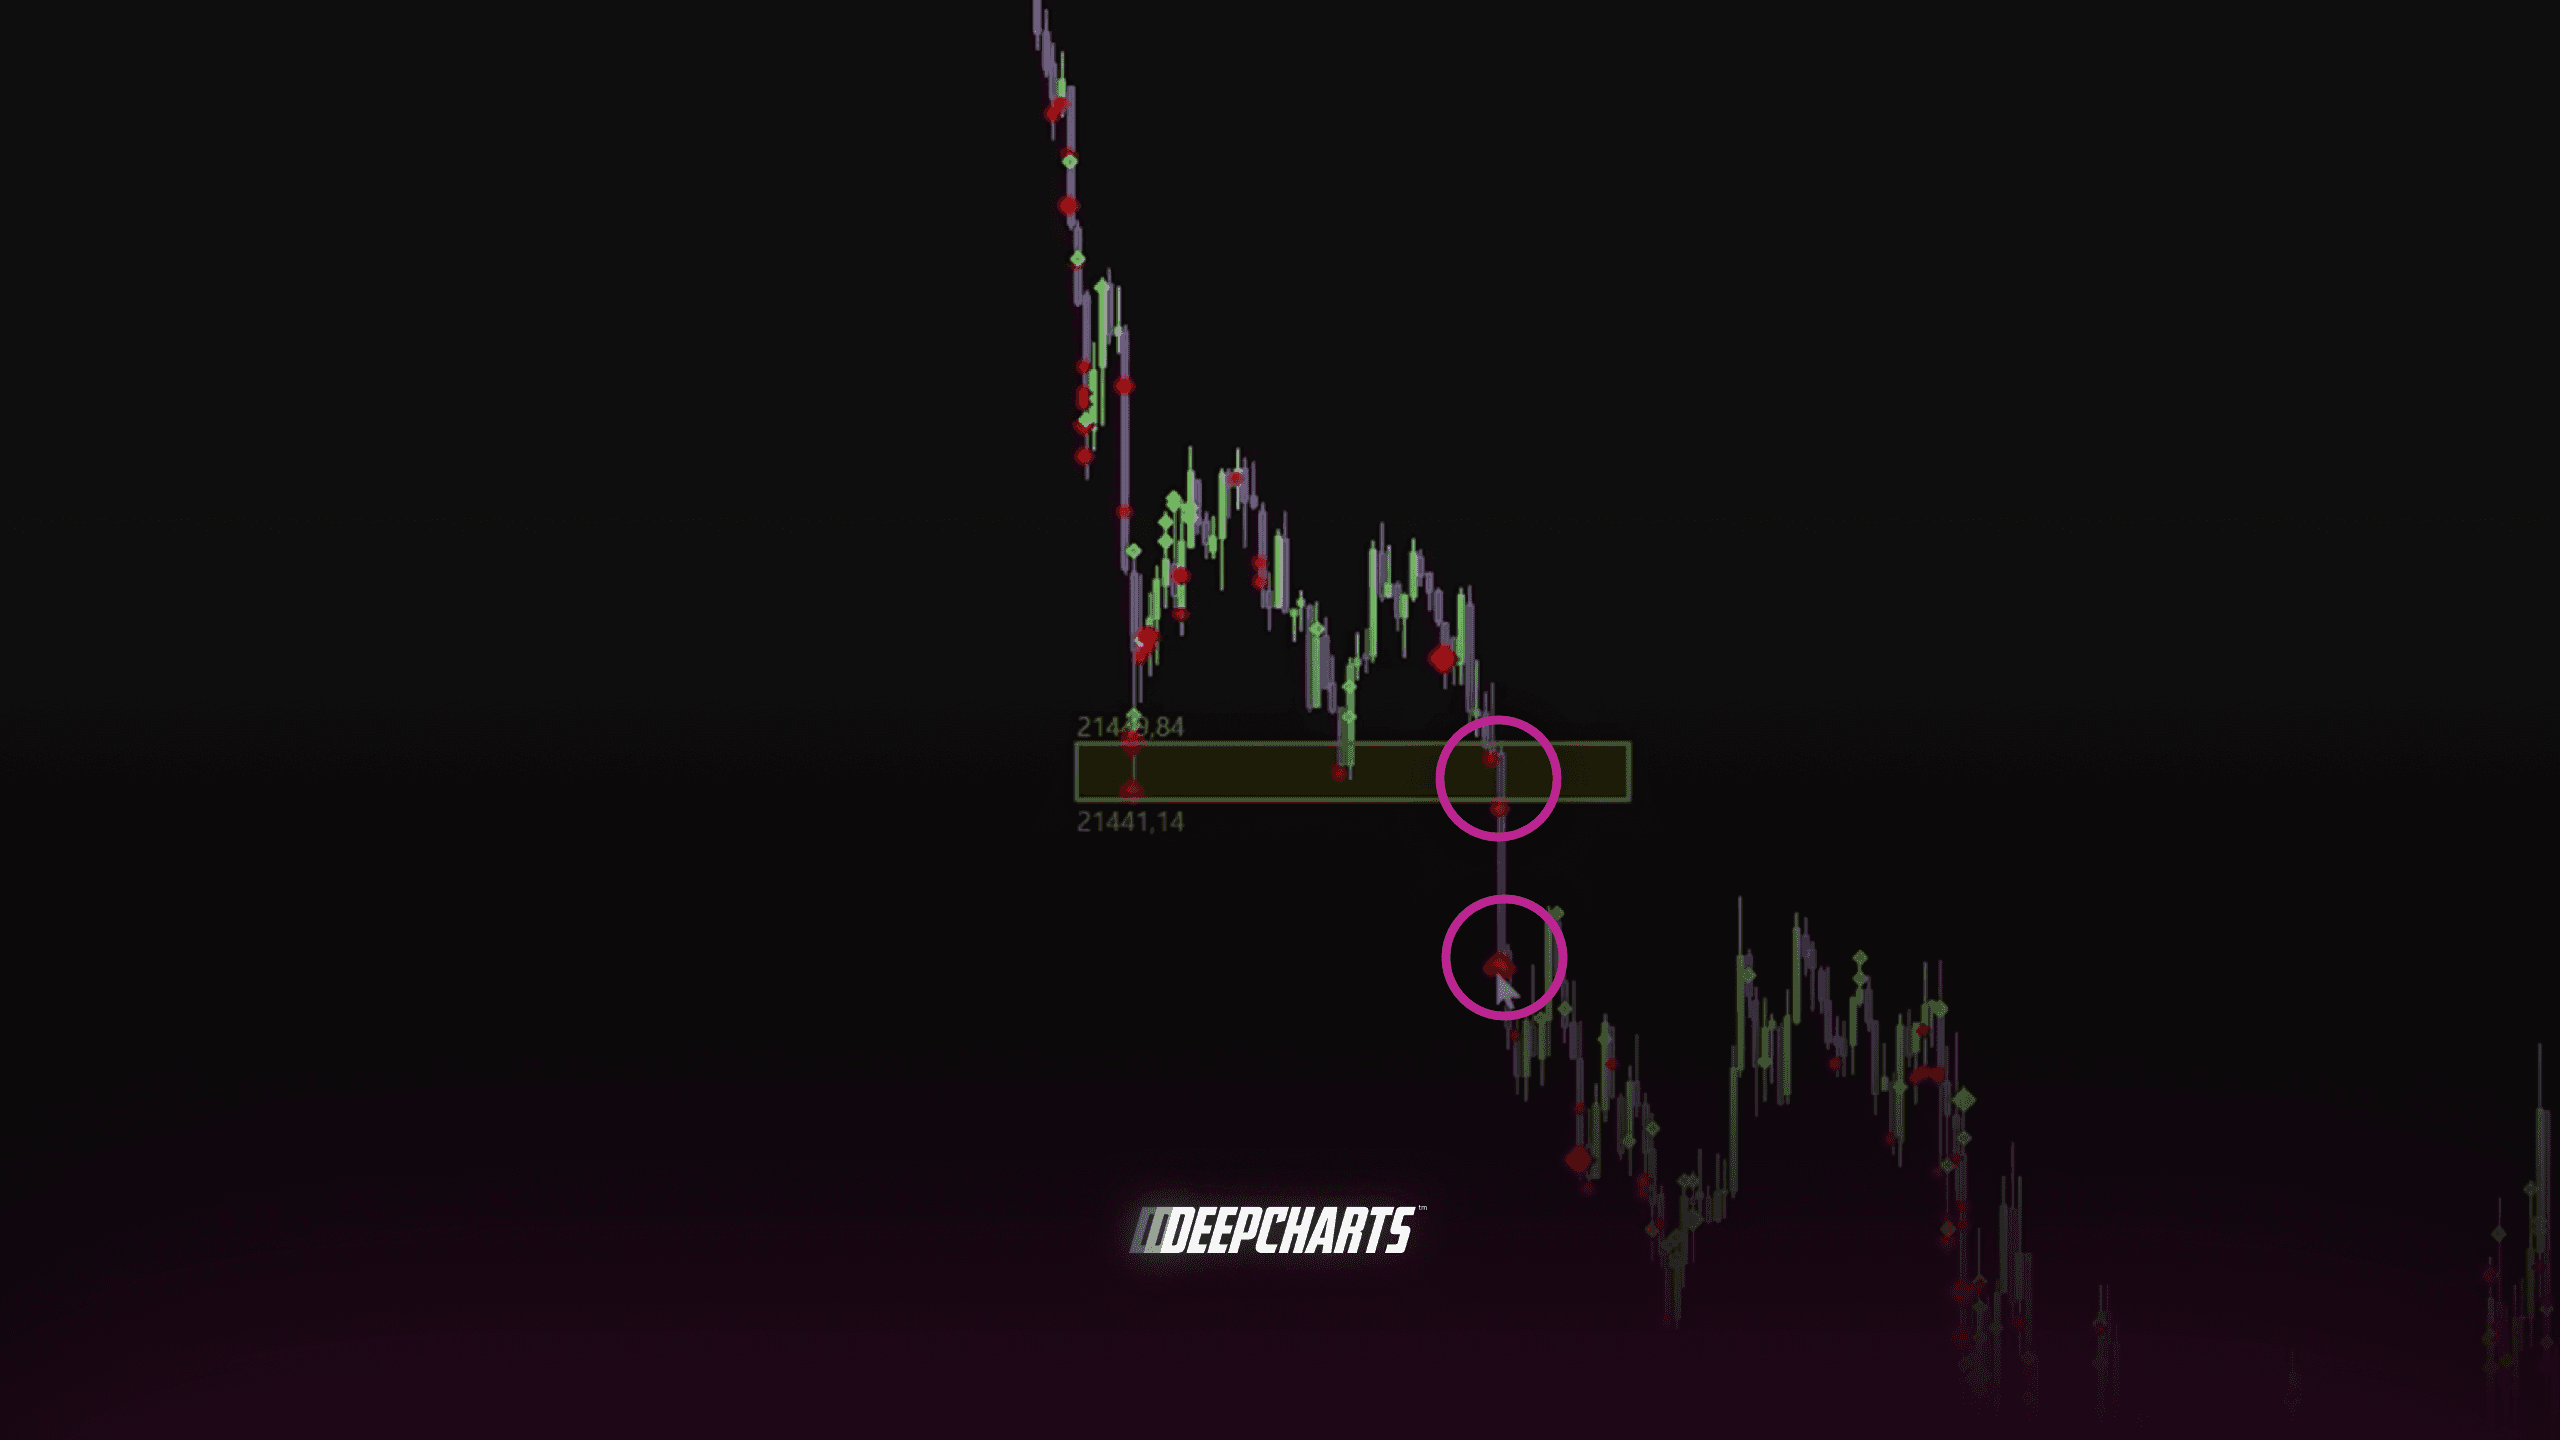
Another important scenario is the failed auction. Sometimes price breaks a level but immediately encounters large opposing Deep Trades. If aggressive selling appears after an upside breakout — or aggressive buying appears after a downside breakout — the move can quickly reverse. In these cases, Deep Trades reveal that the breakout lacked genuine institutional participation.
Finally, Deep Trades can expose absorption. This occurs when large trades repeatedly appear at a level while price struggles to move further. For example, strong buying activity may appear on the tape, yet price fails to push higher. This often indicates that a large seller is absorbing liquidity, a situation that can precede a reversal.
By combining Deep Trades with market context (such as value areas, breakouts, or failed auctions) traders gain a clearer understanding of who is actually controlling the auction.
Instead of relying only on price patterns, they can observe where real capital is entering the market and use that information to refine entries, stops, and targets.
So this was the Big Trades / Deep Trades Explained.
If you want to truly understand how big trades and order flow reveal real institutional activity, this is just the beginning.
In the video below, you’ll see how to spot aggressive buying, absorption, and failed auctions directly on the chart.
👇 Watch the full breakdown here
Follow us for more on order flow, big trades, and institutional trading strategies

Deepcharts Team
·
Share this on