


Market Microstructure
A lot of traders nowadays are interested in orderflow trading but very few know how it really works. In this article we will walk you through how exactly it works.
Most trading guides start from candlestick patterns, chart shapes and trendlines because it feels more "beginner friendly". But that creates even more confusion in beginners.
To truly understand something you have to start from the basic mechanics (micro) to then learn the more "advanced" dynamics So if you ever asked yourself a question such as:
What really moves prices? How is a candle Created and Formed? What happens behind the scenes of Price Action?
This article will explain you exactly everything you always wanted to know
The Players and the Playing Field
In every market, there are two main groups of participants:
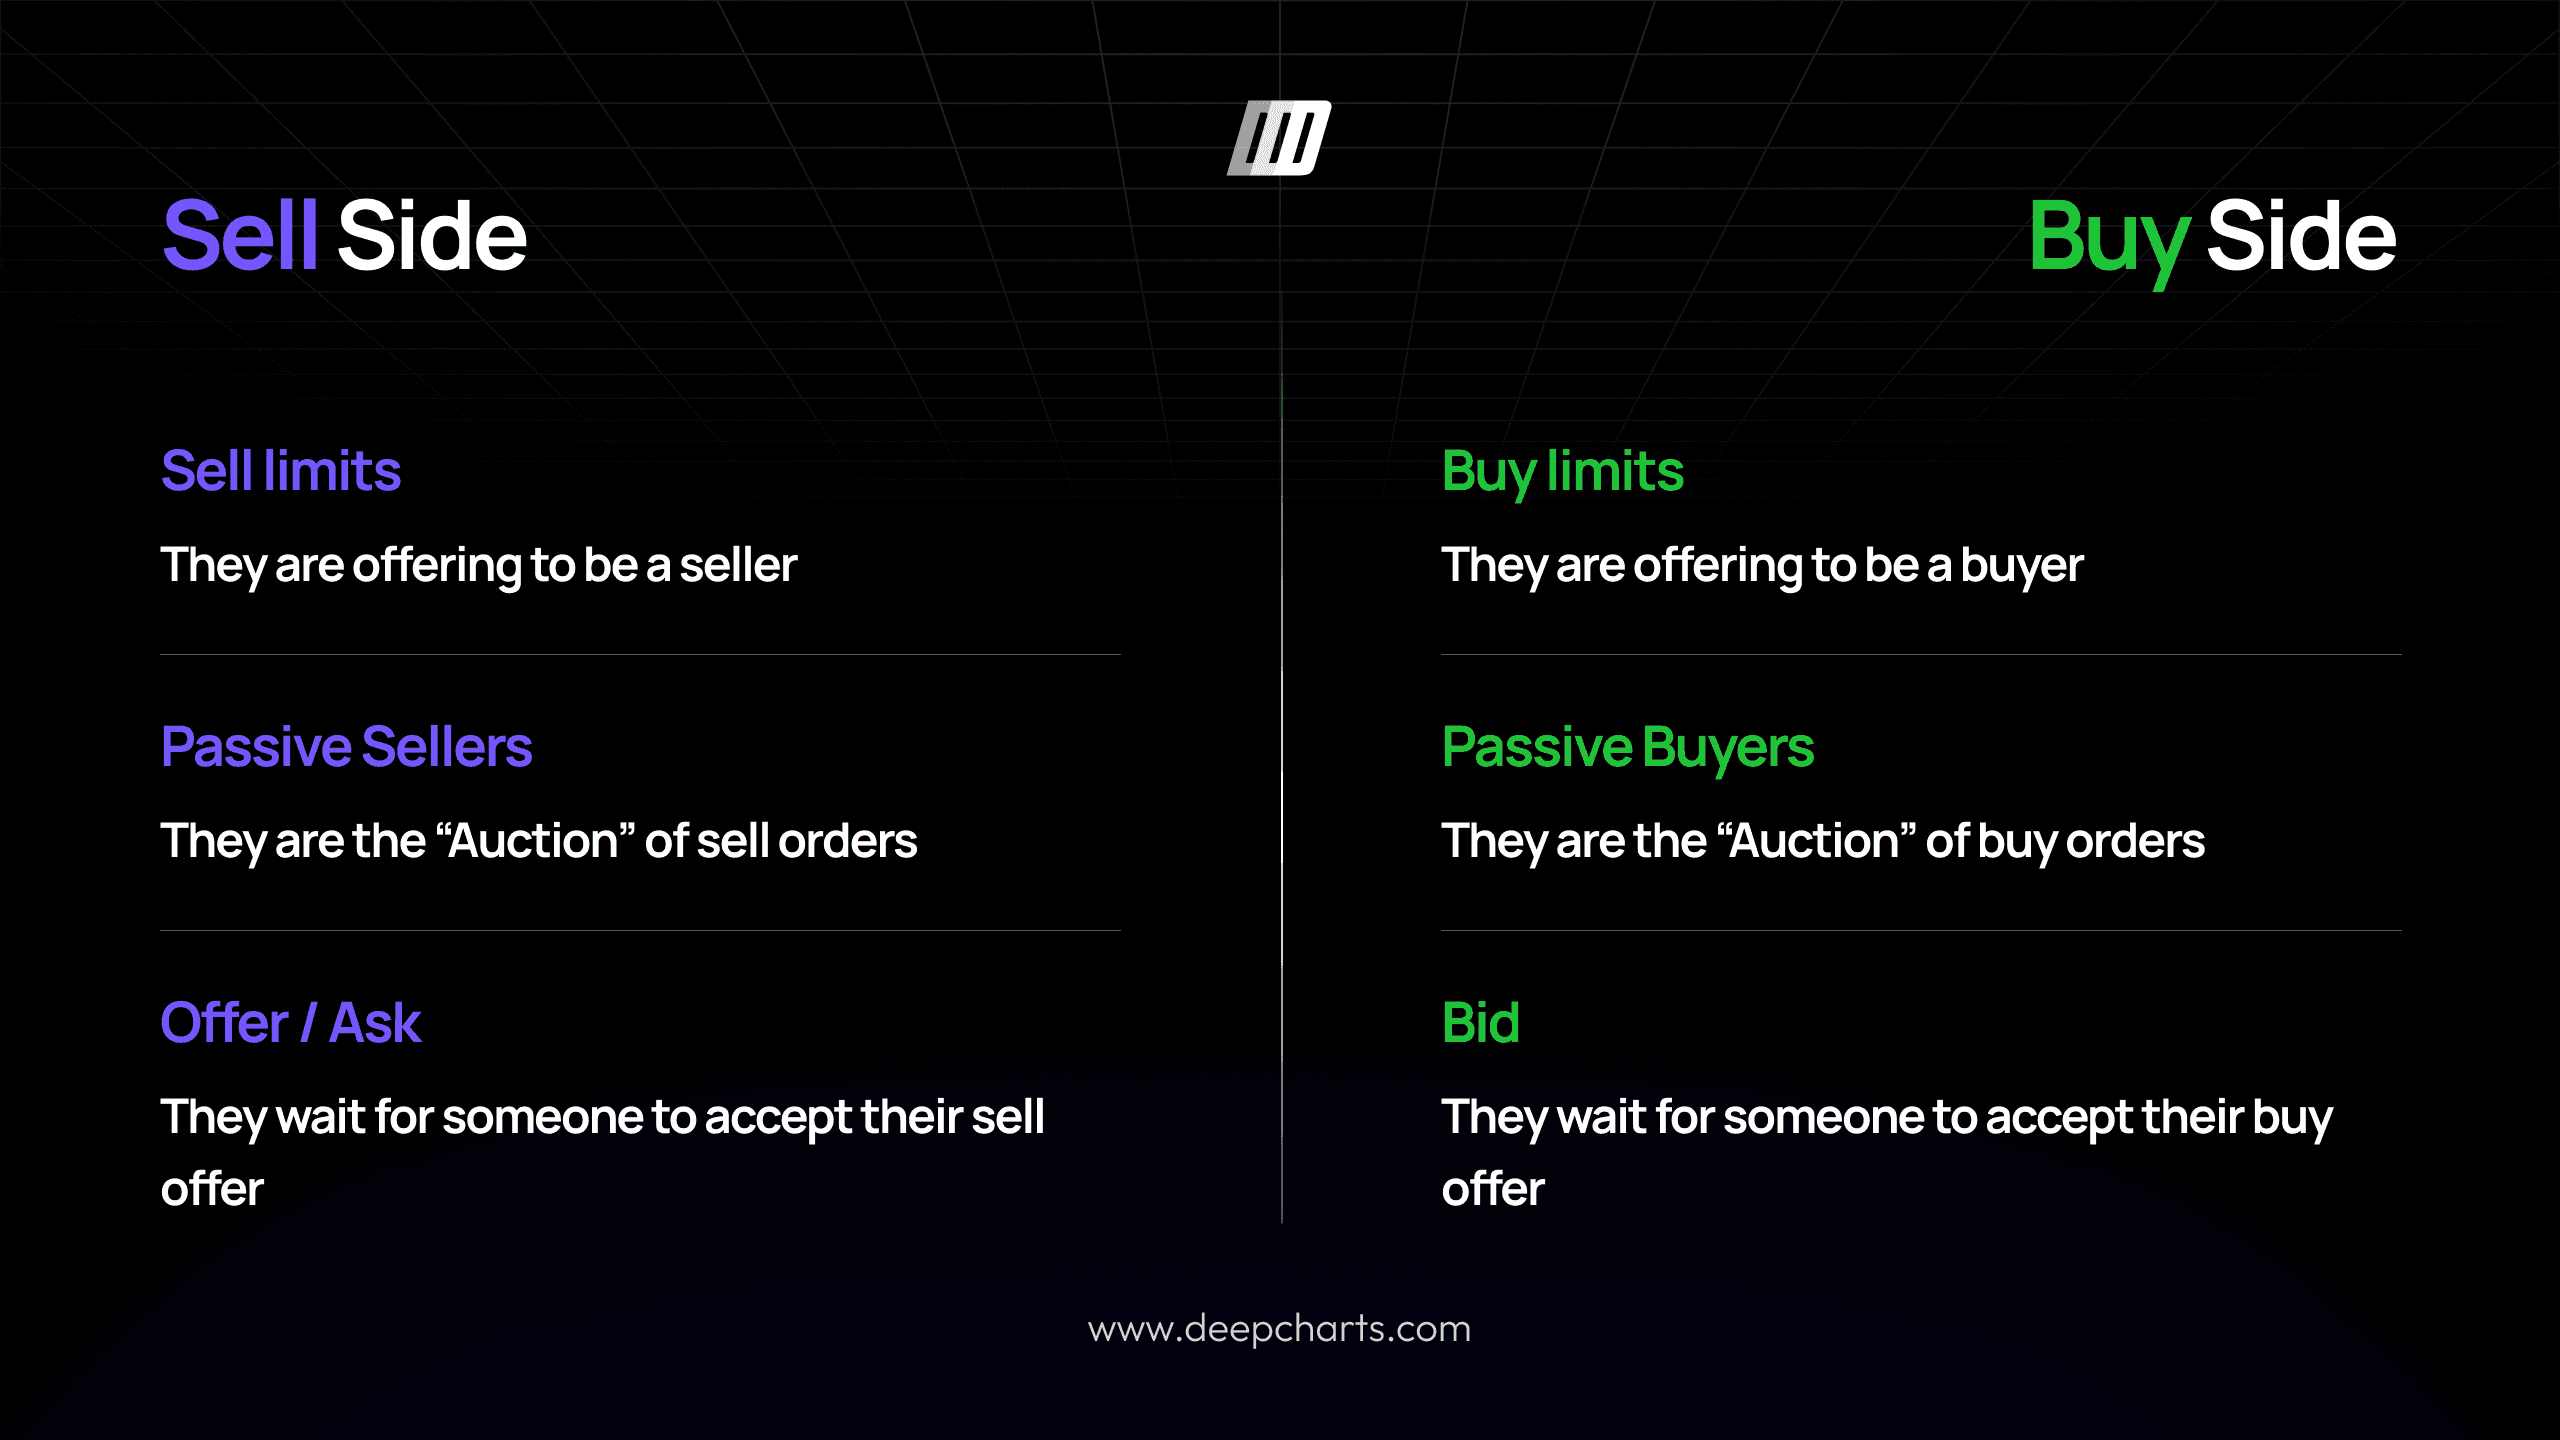
Buyers → they want to buy at the lowest price possible.
Sellers → they want to sell at the highest price possible.
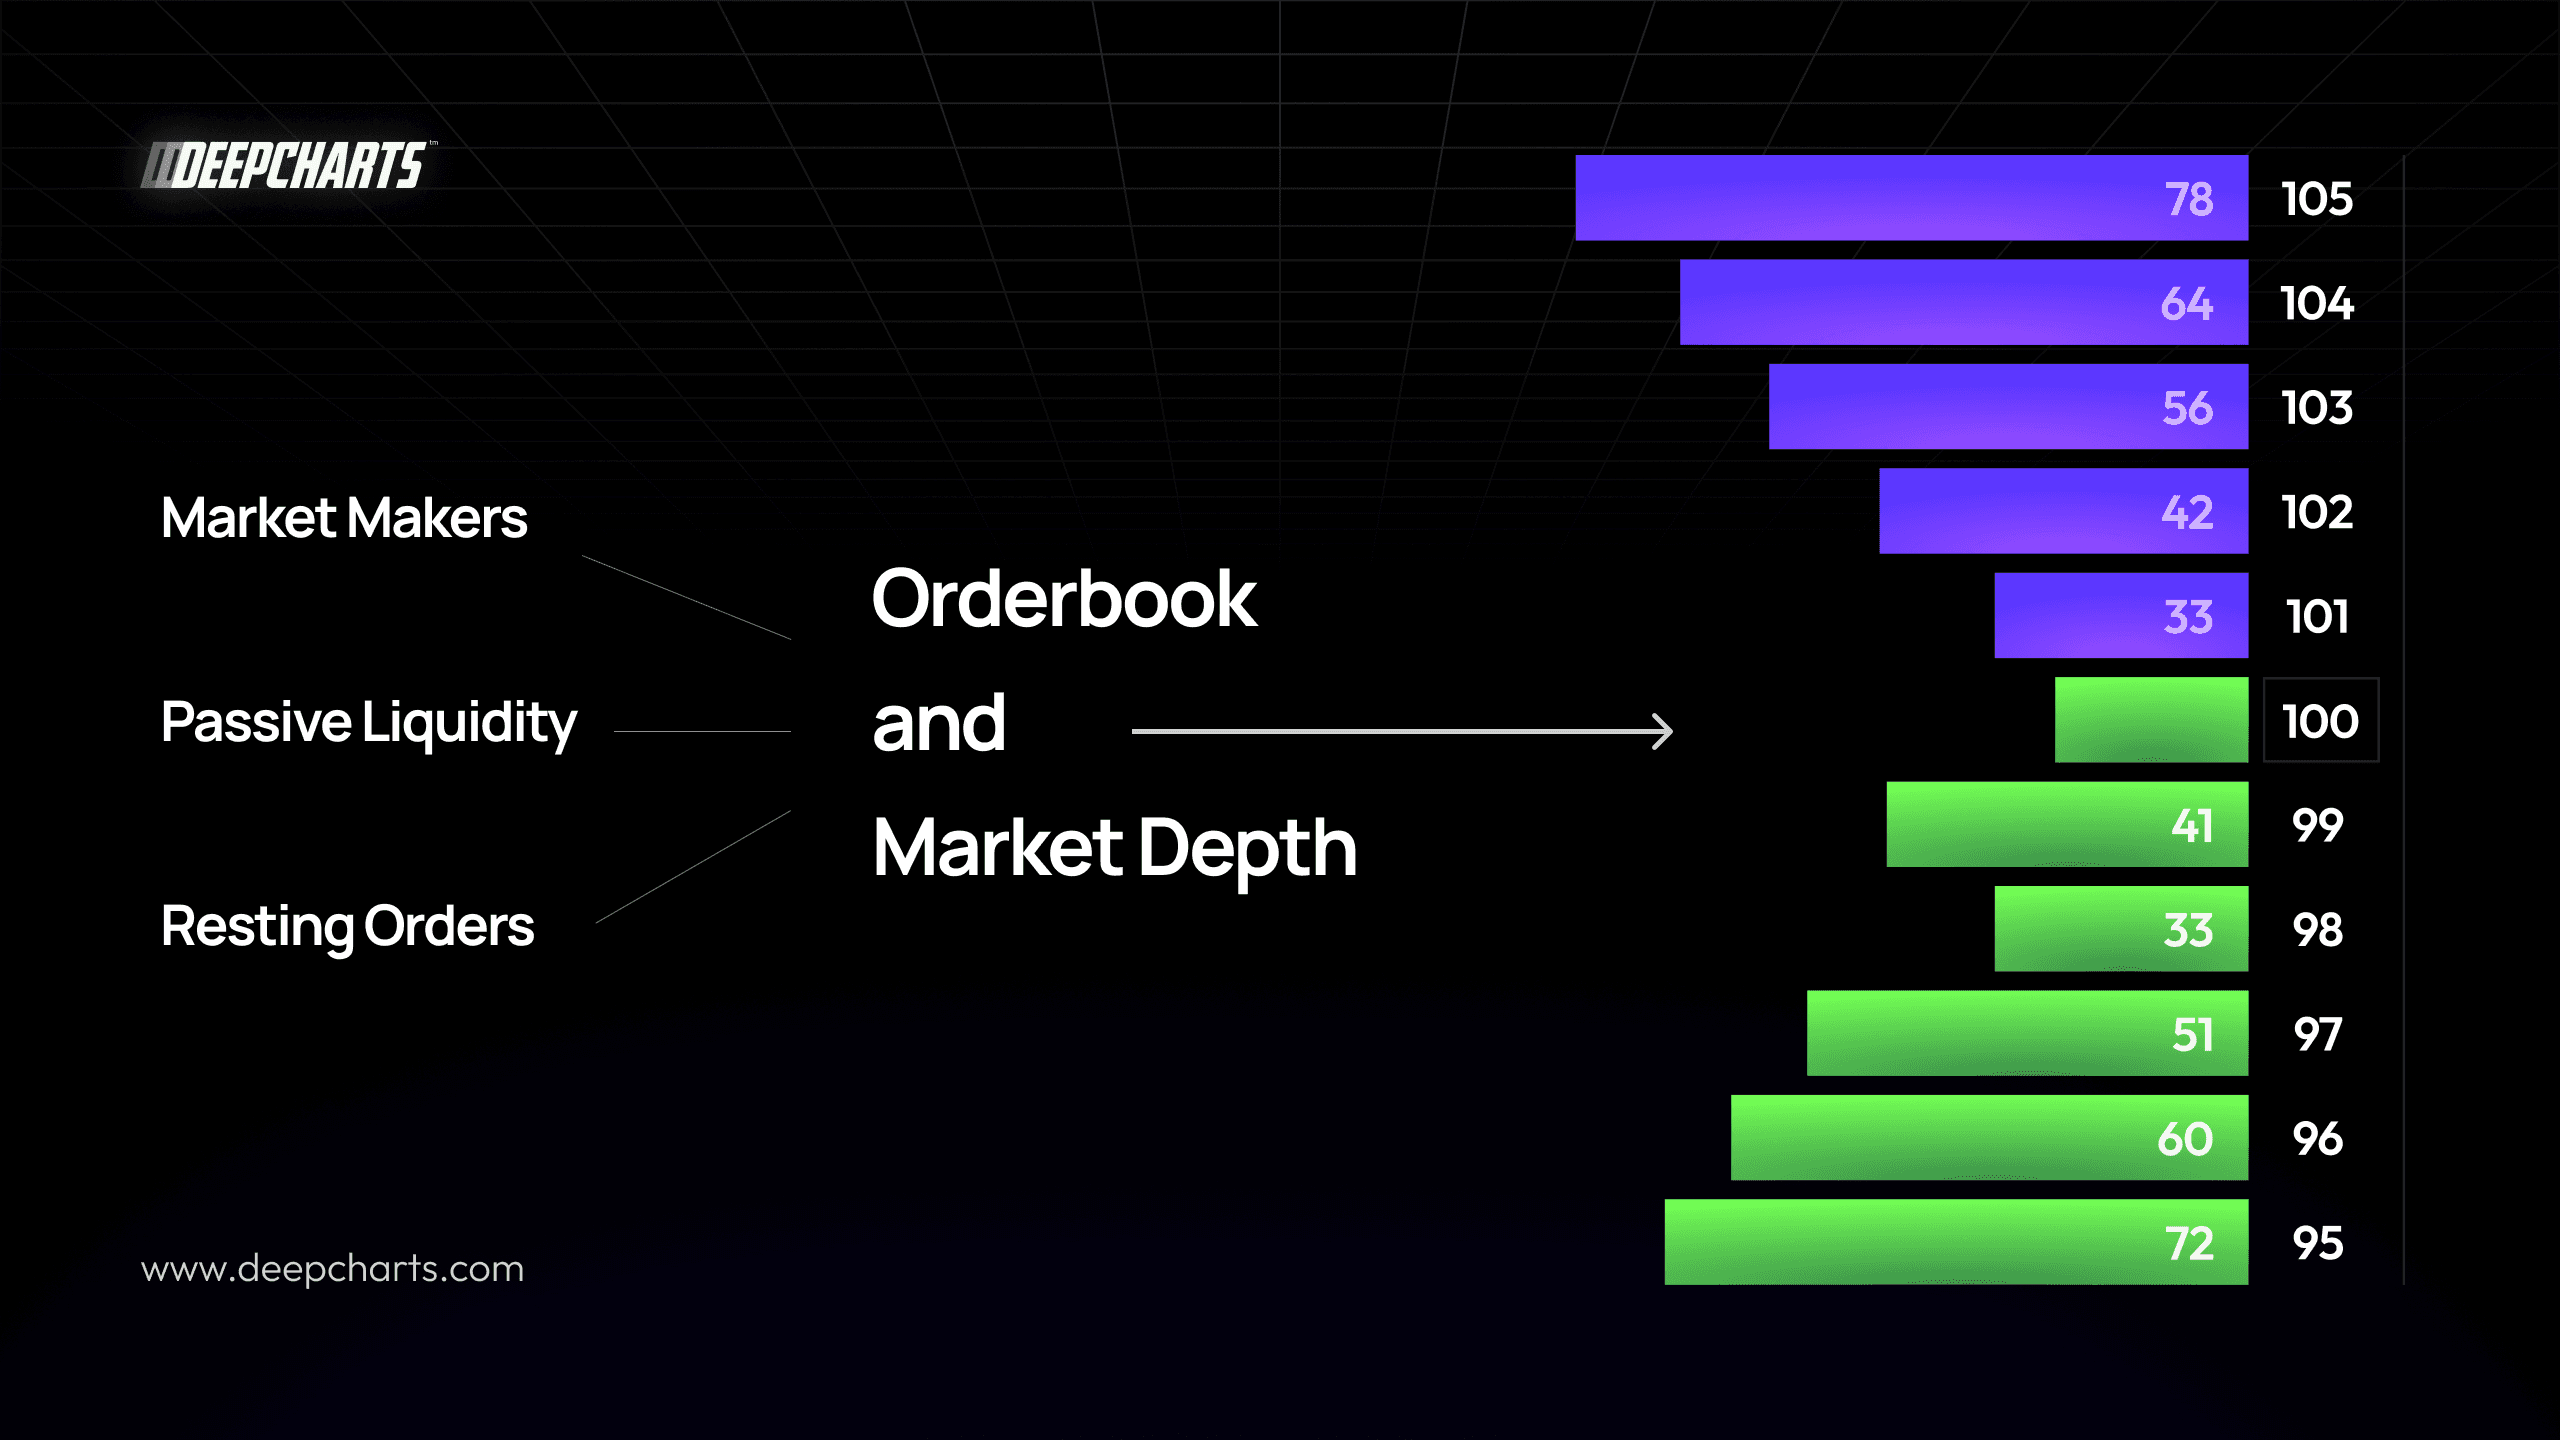
They all “pin” their offers on an electronic board called the Orderbook (or Market Depth).
You can imagine it as two vertical ladders of prices:
Green side → buy limit orders (Buy Limits or Bids).
Purple side → sell limit orders (Sell Limits or Asks).
These are passive orders, waiting for someone to accept them.
The Role of Market Makers and Passive Liquidity
Market Makers constantly fill the book with limit orders on both sides, providing passive liquidity.
A Buy Limit means: “I’m willing to buy at this price, but I’ll wait for a seller.”
A Sell Limit means: “I’m willing to sell at this price, but I’ll wait for a buyer.”
No trade happens until someone is ready to hit one of these resting orders
When an Aggressive Order Enters
Now imagine a trader says:
“I’ll buy 2 contracts market!”
This means the trader doesn’t want to wait. They’ll accept the best available selling price in the book.
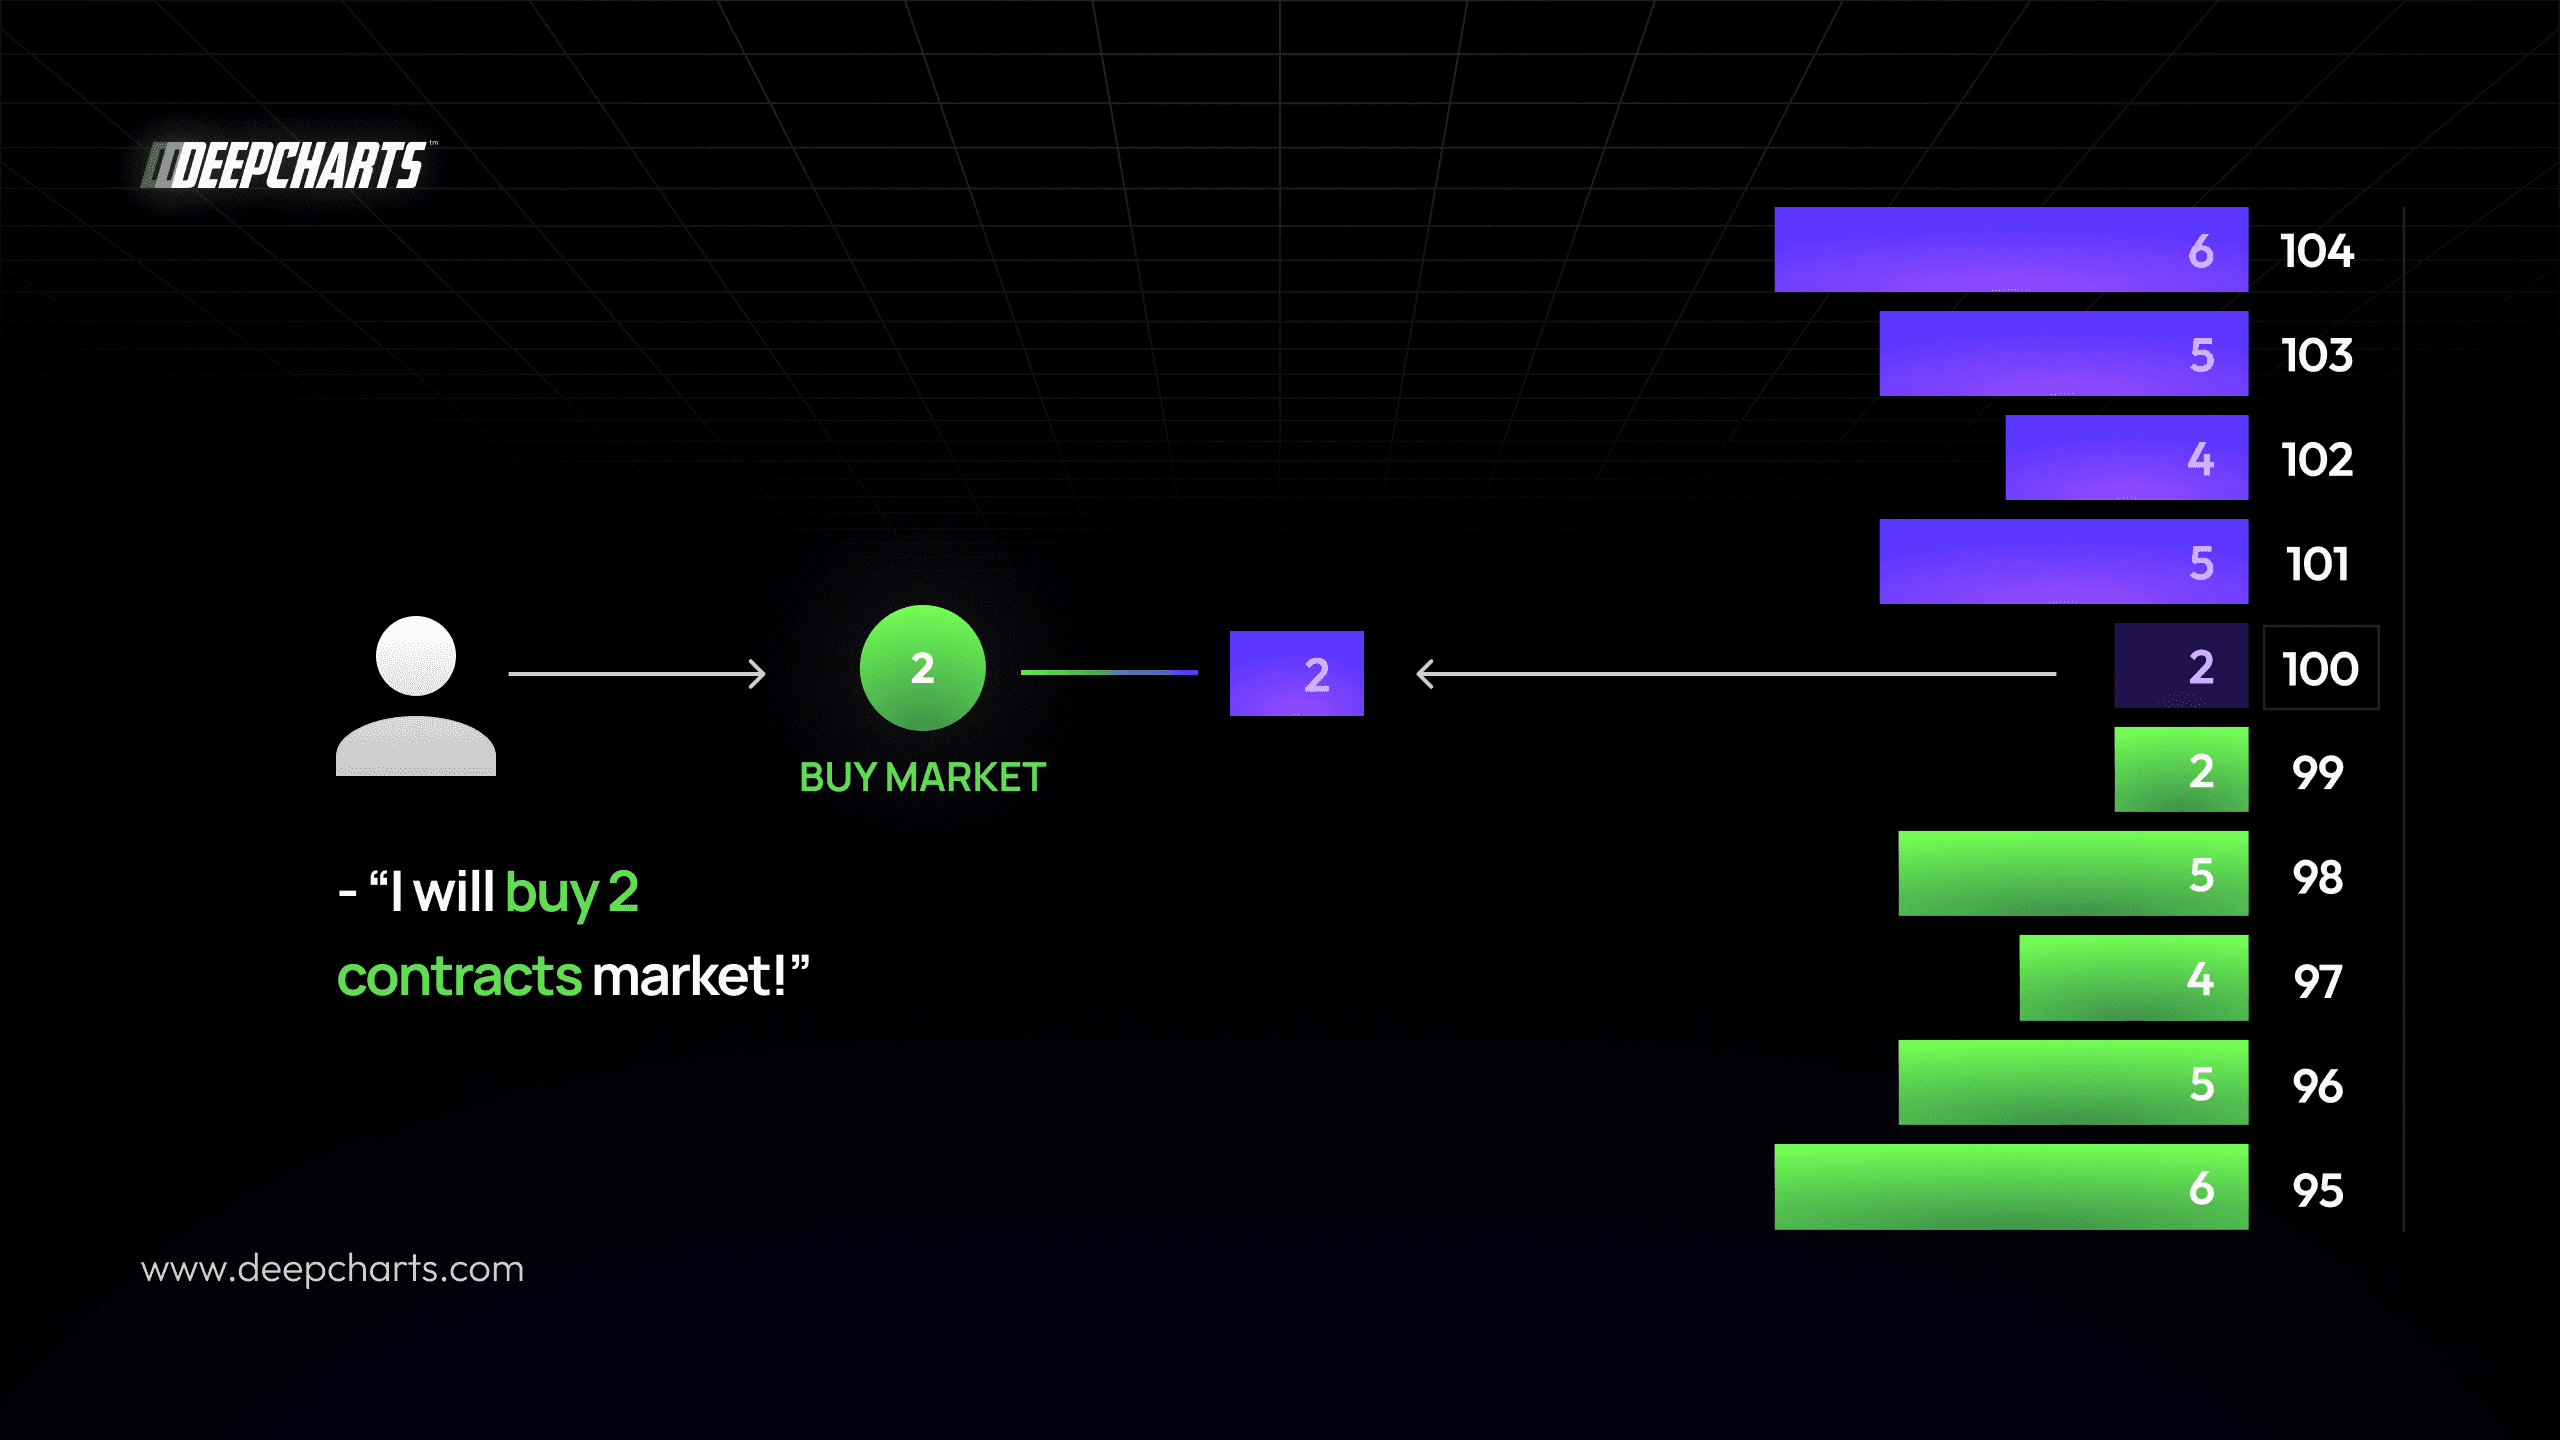
In the image:
The best selling price (Ask) is 100.
The market order hits those 2 available contracts → the trade executes at 100.
How a Candle Is Born
Each time a trade happens:
The Last Price updates.
If it’s the first trade of a new time period → the candle opens at that price (Candle Open).
No trade happens until someone is ready to hit one of these resting orders
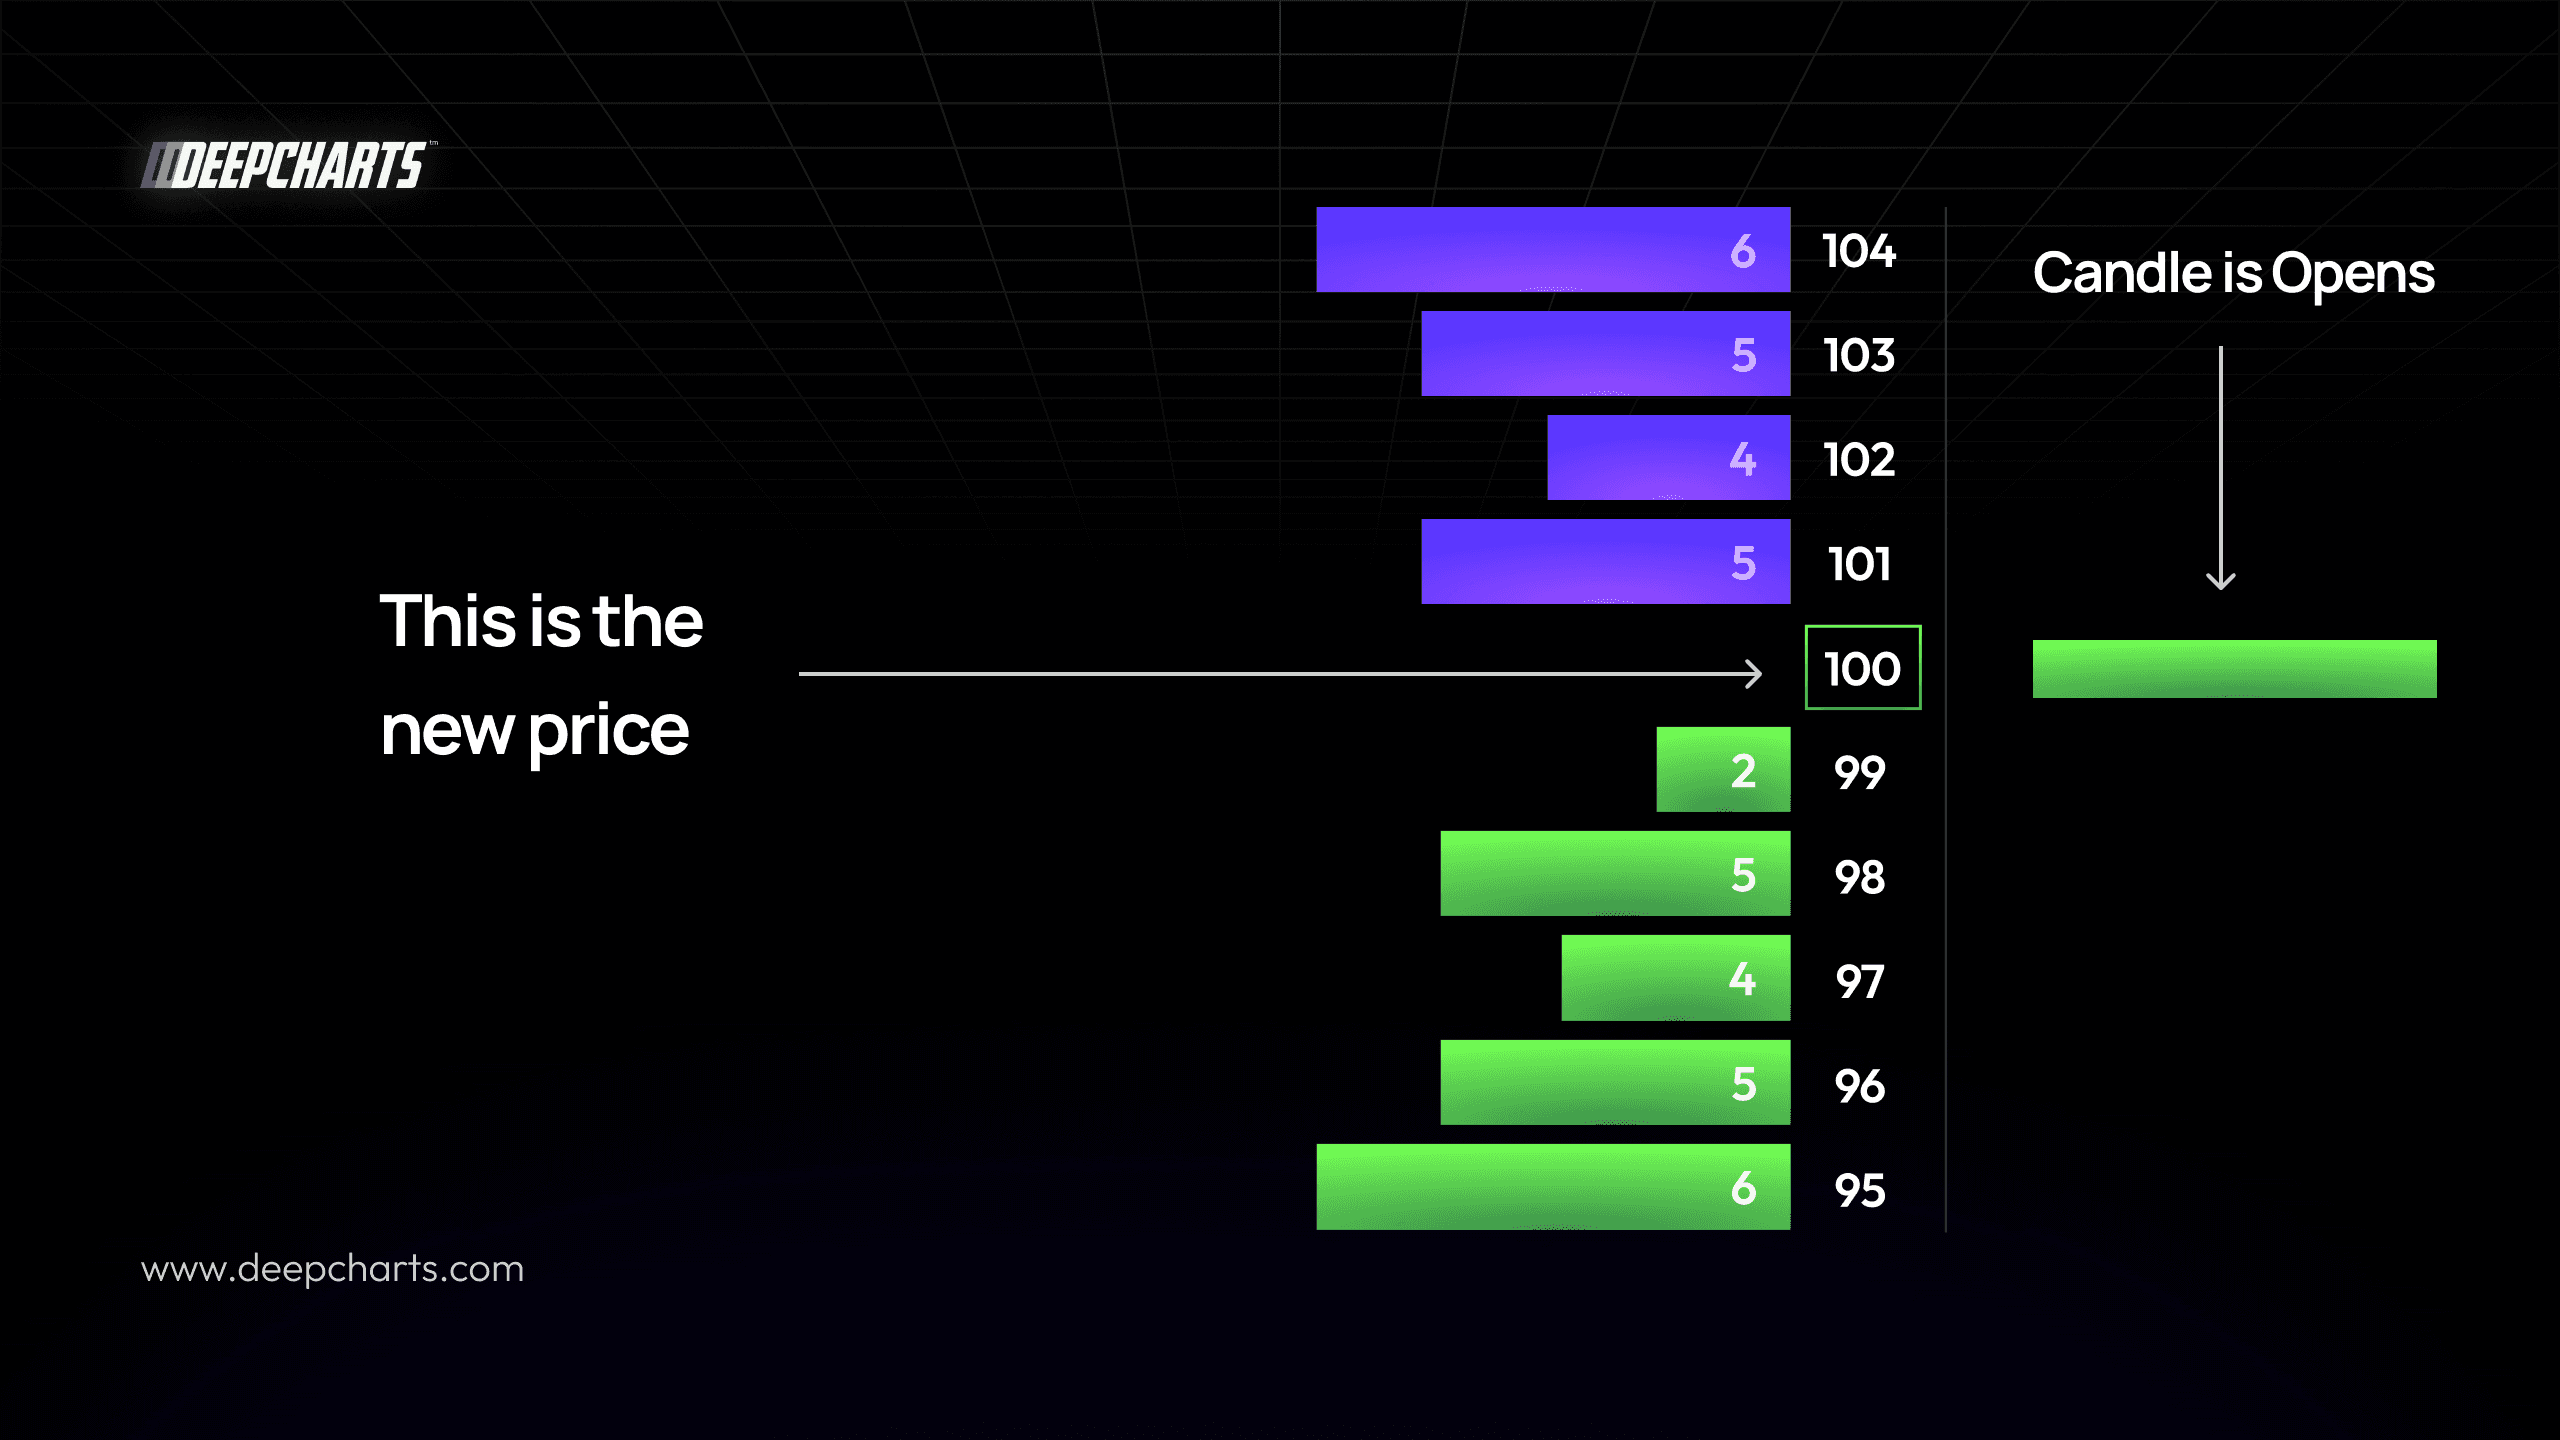
In our example:
The first trade occurs at 100 → that’s the opening price of the new candle.
As long as aggressive buyers keep hitting asks, the candle builds green (upward pressure).
When aggressive sellers start hitting bids, the candle turns red* (downward pressure)
*in our examples red = purple
How the Price Changes After a Trade
Once a trade occurs, the contracts at that price are removed from the book (they were filled). Now, the new best ask might be 101.
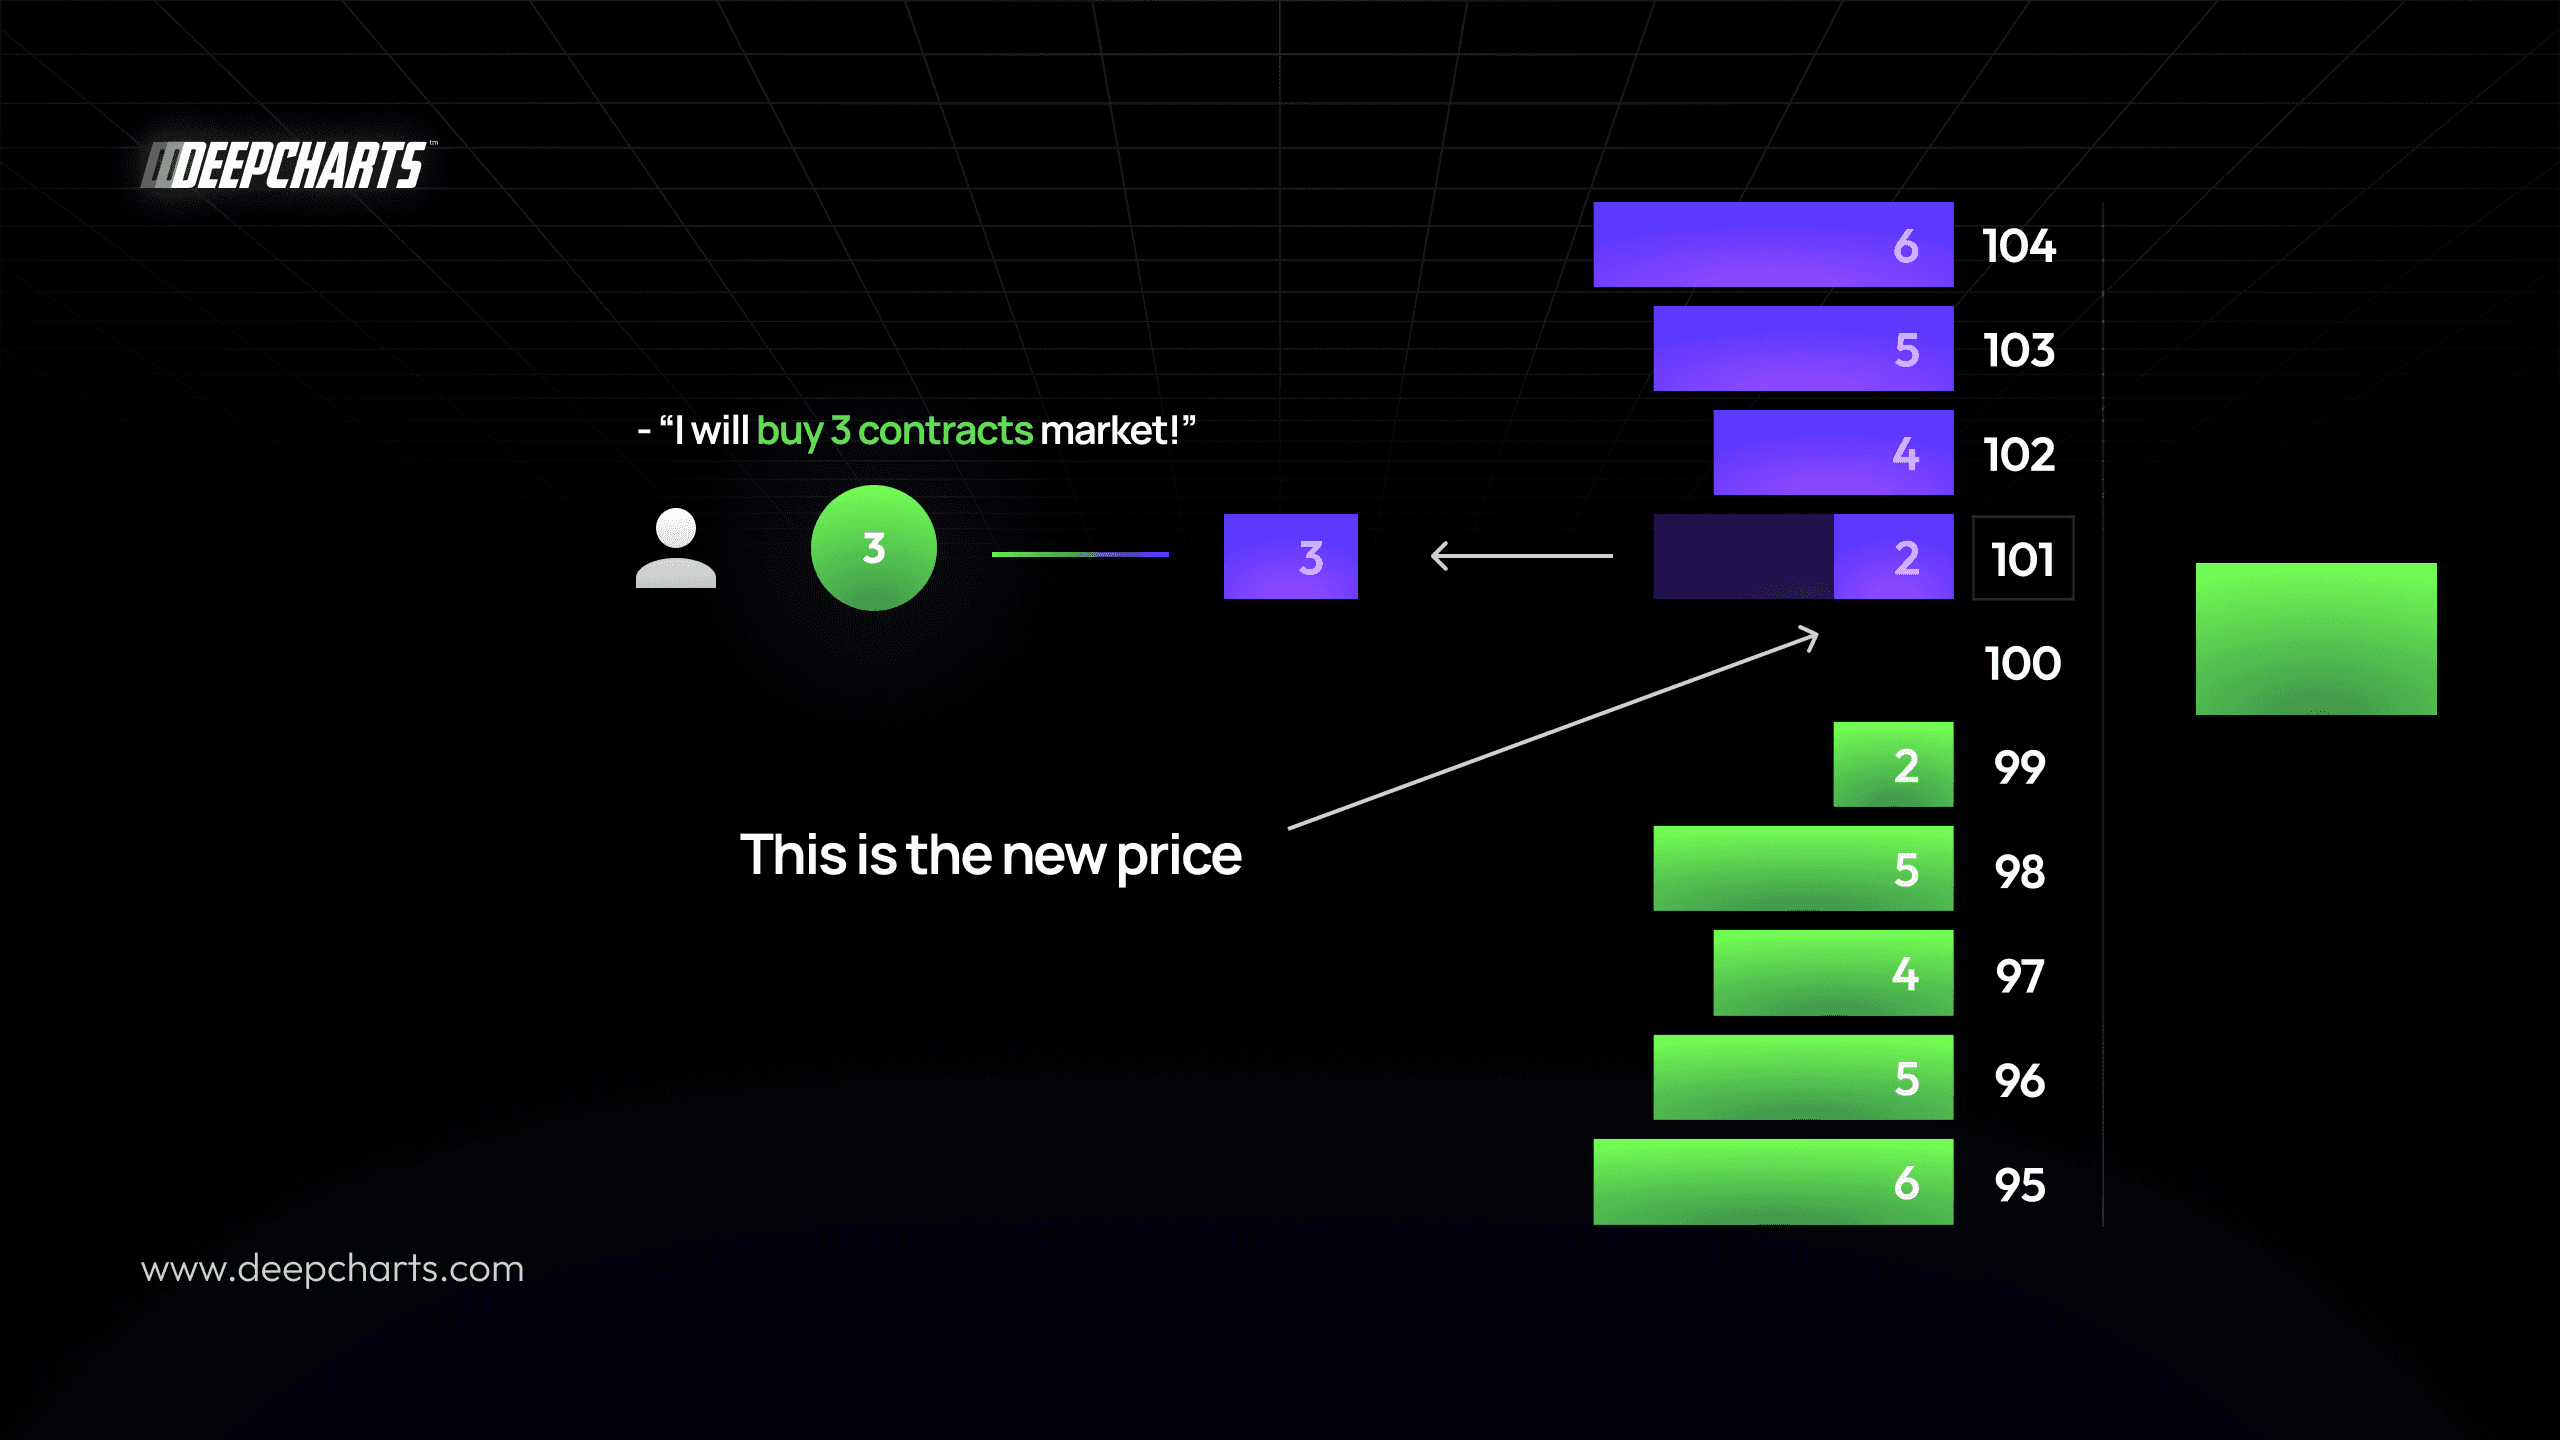
If no new buyers come in, and sellers start entering market orders, the price may move down as their orders hit the bids.
Each trade slightly shifts the balance between buyers and sellers, this is what moves price.
How the Footprint Captures It
The Footprint chart records every interaction between bid and ask, showing:
How many contracts were bought at the ask
How many were sold at the bid.
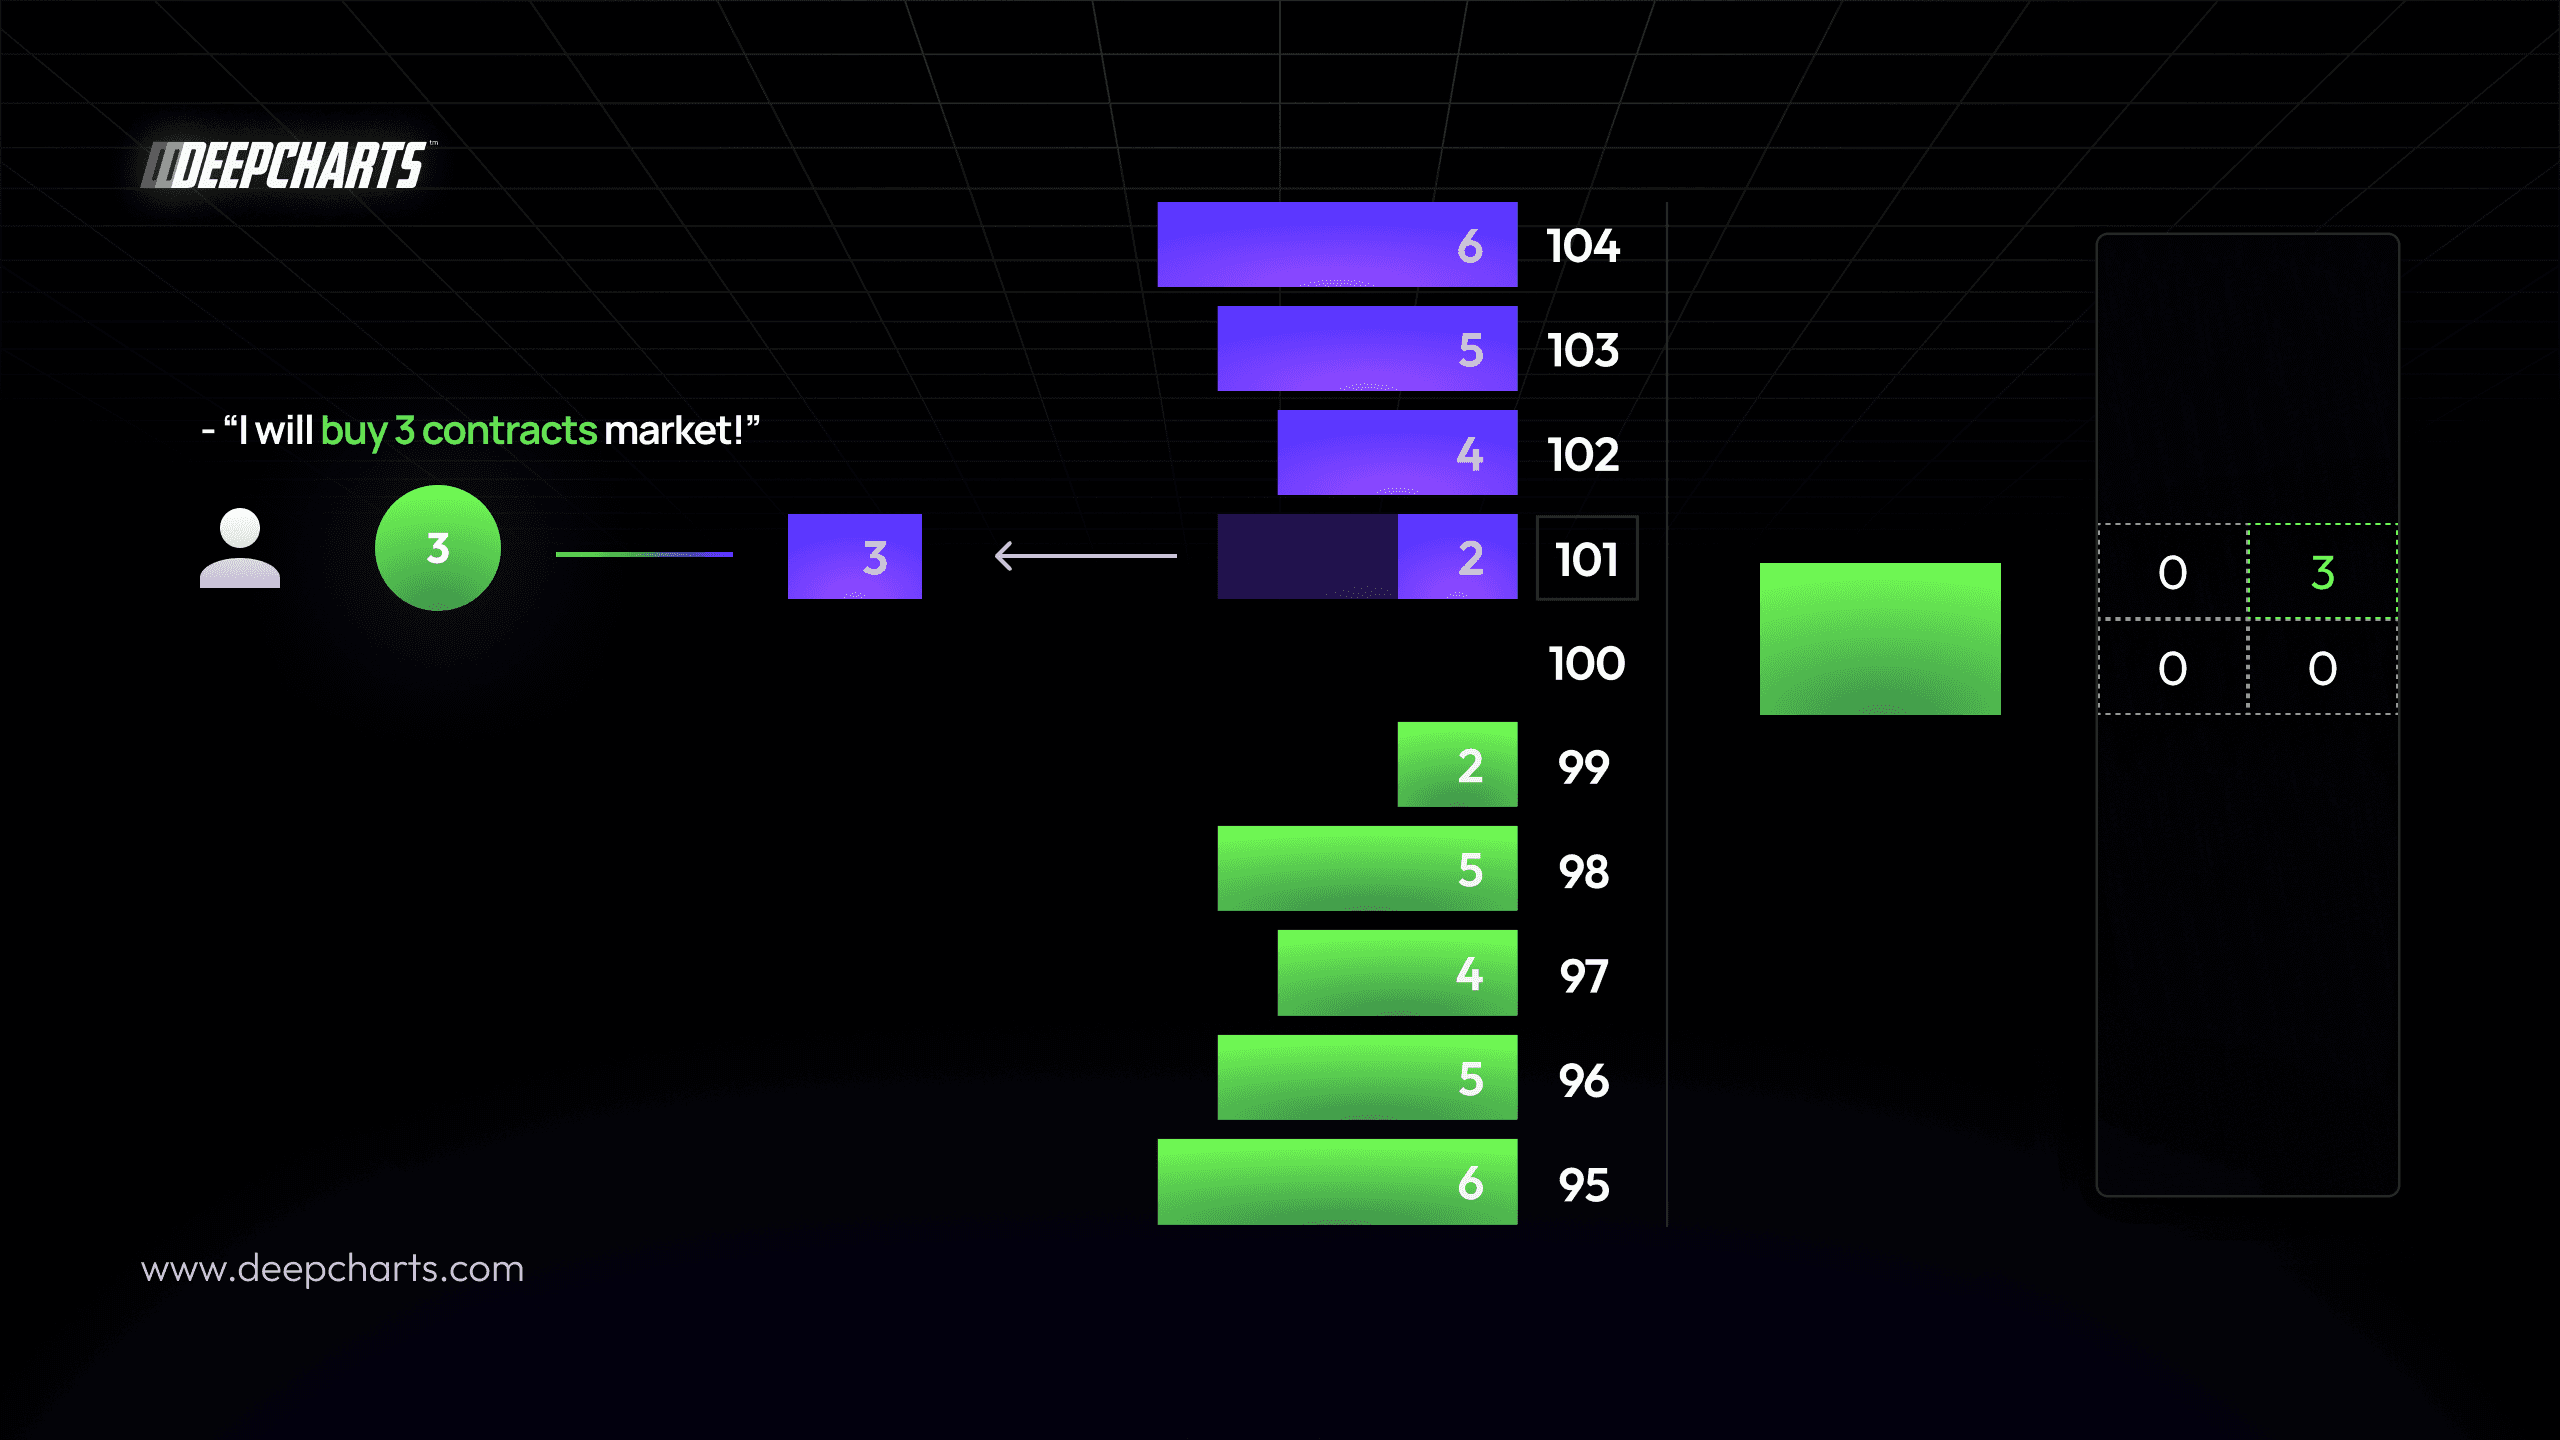
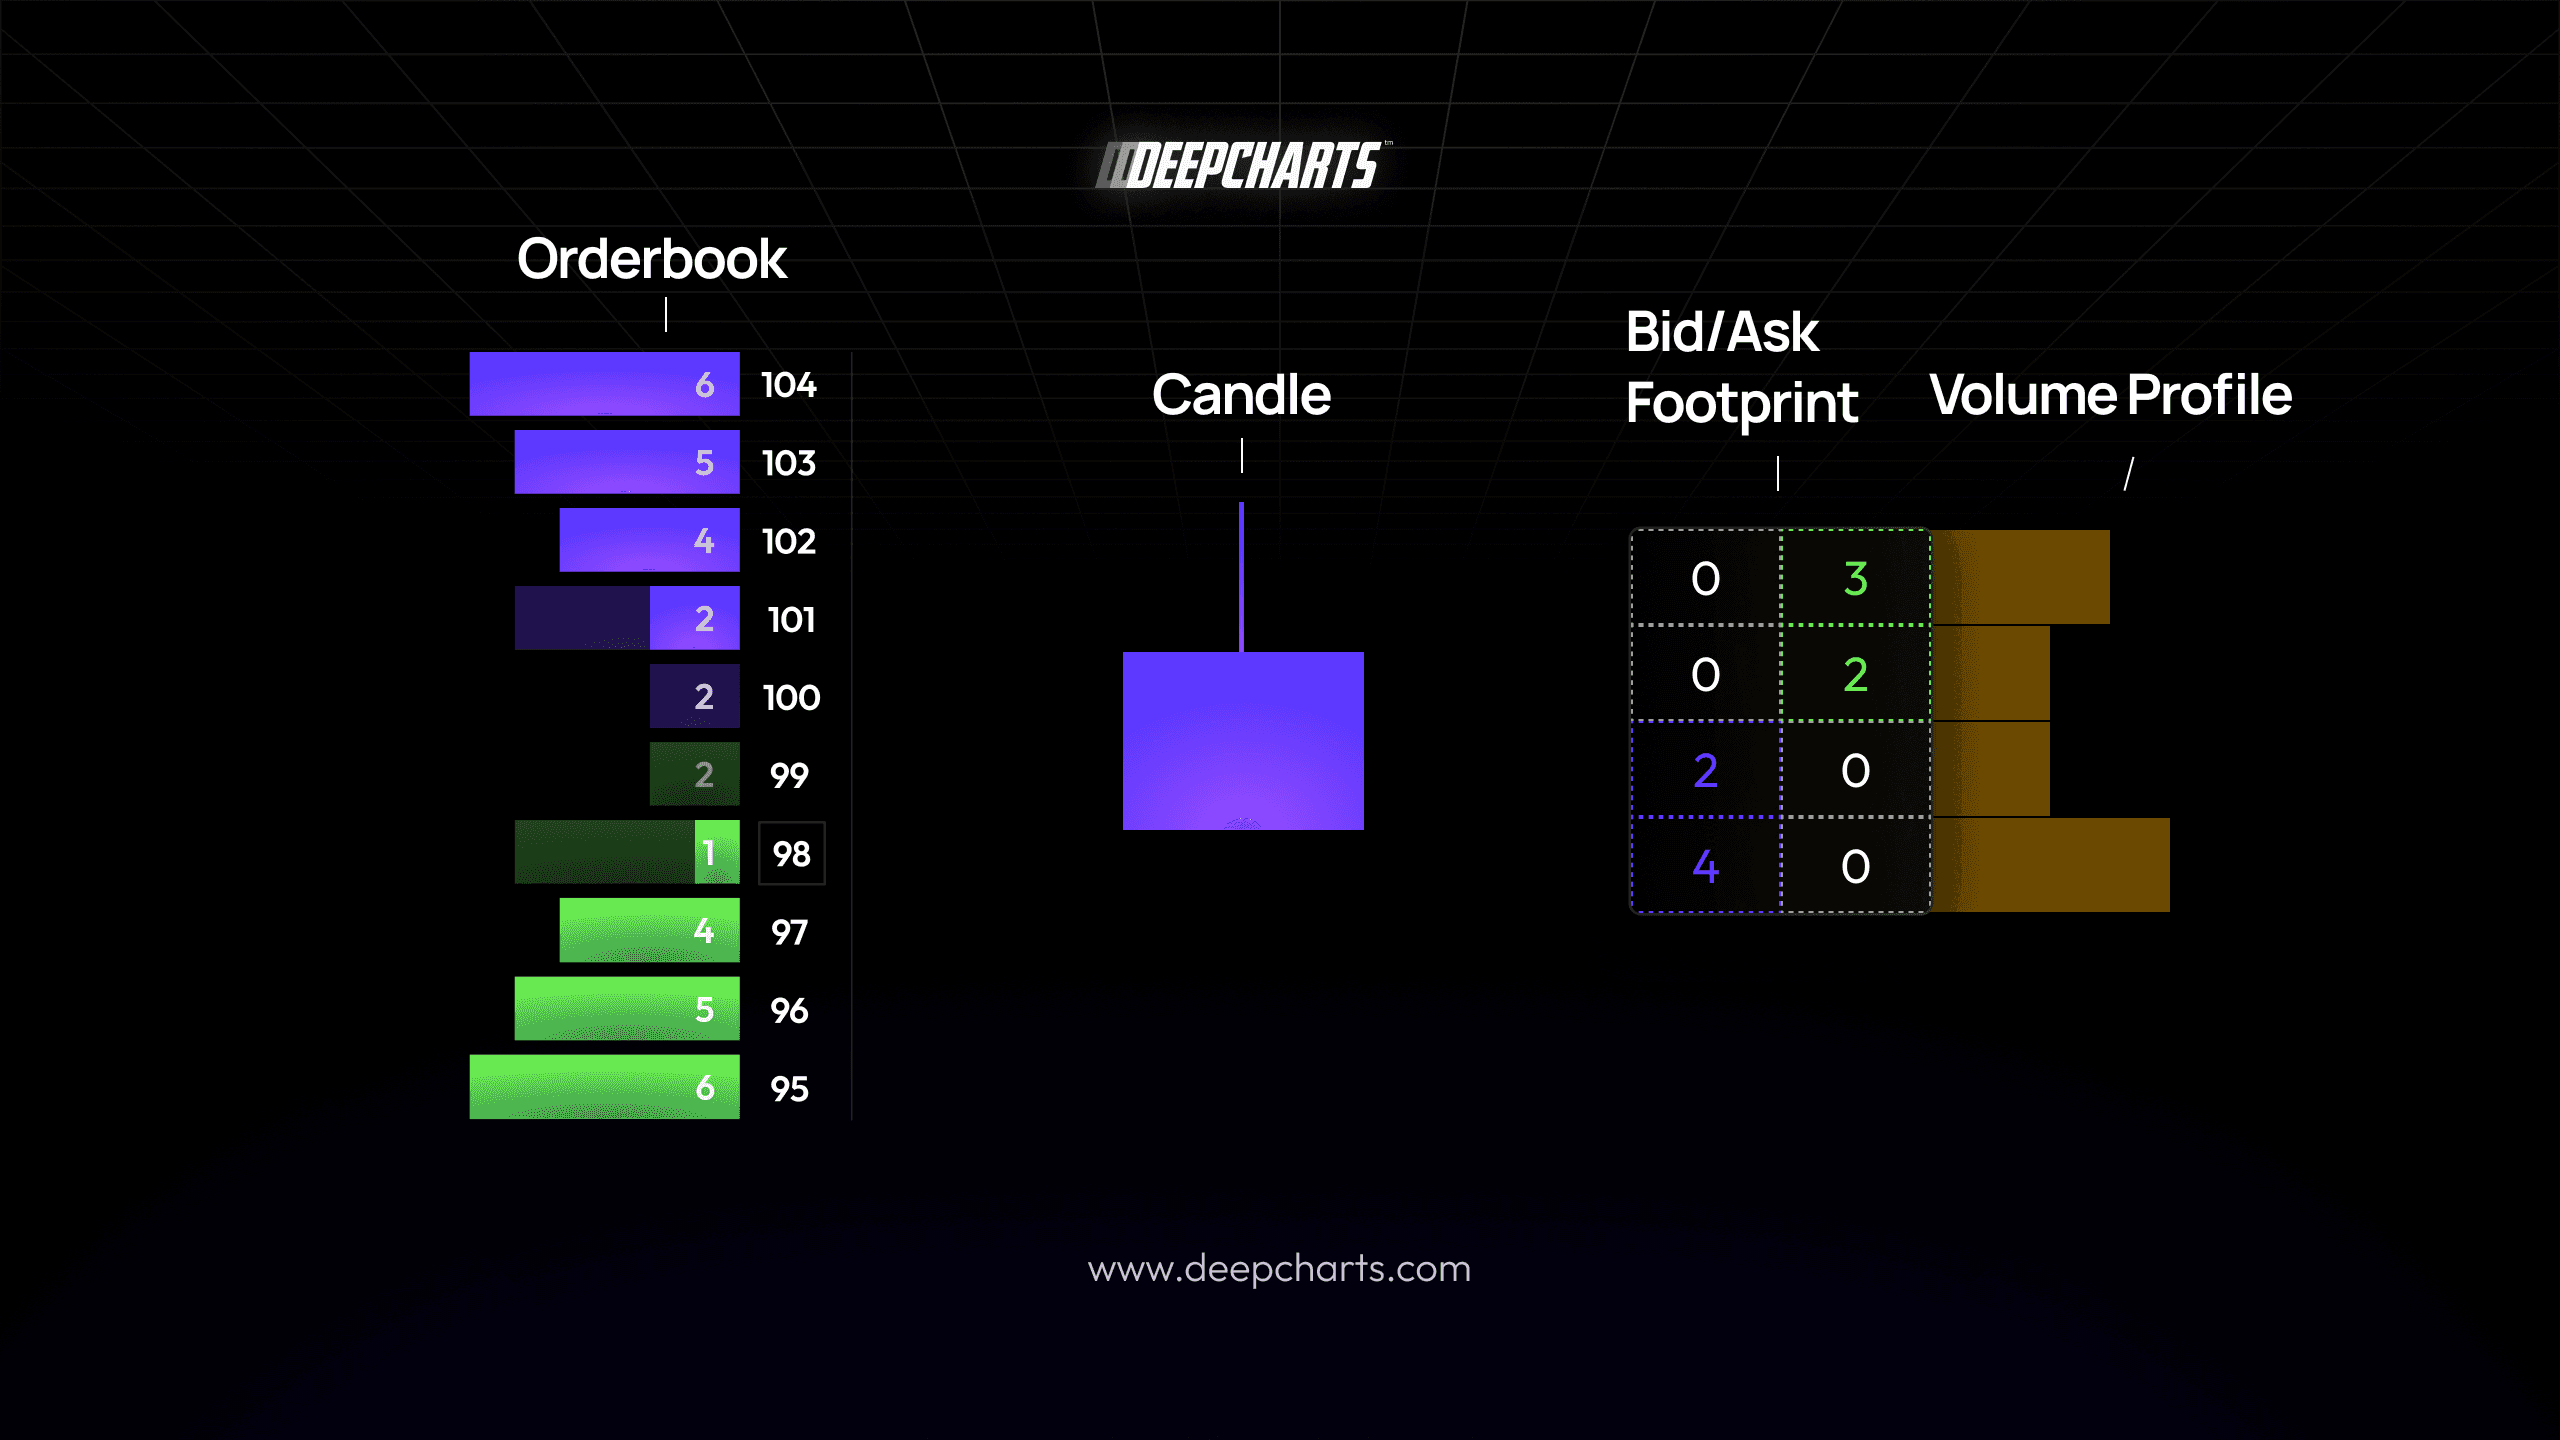
In our example:
At 100 → 0 contracts sold at the bid, 3 contracts bought at the ask.
On the footprint, this appears as 0 × 3 (bid × ask).
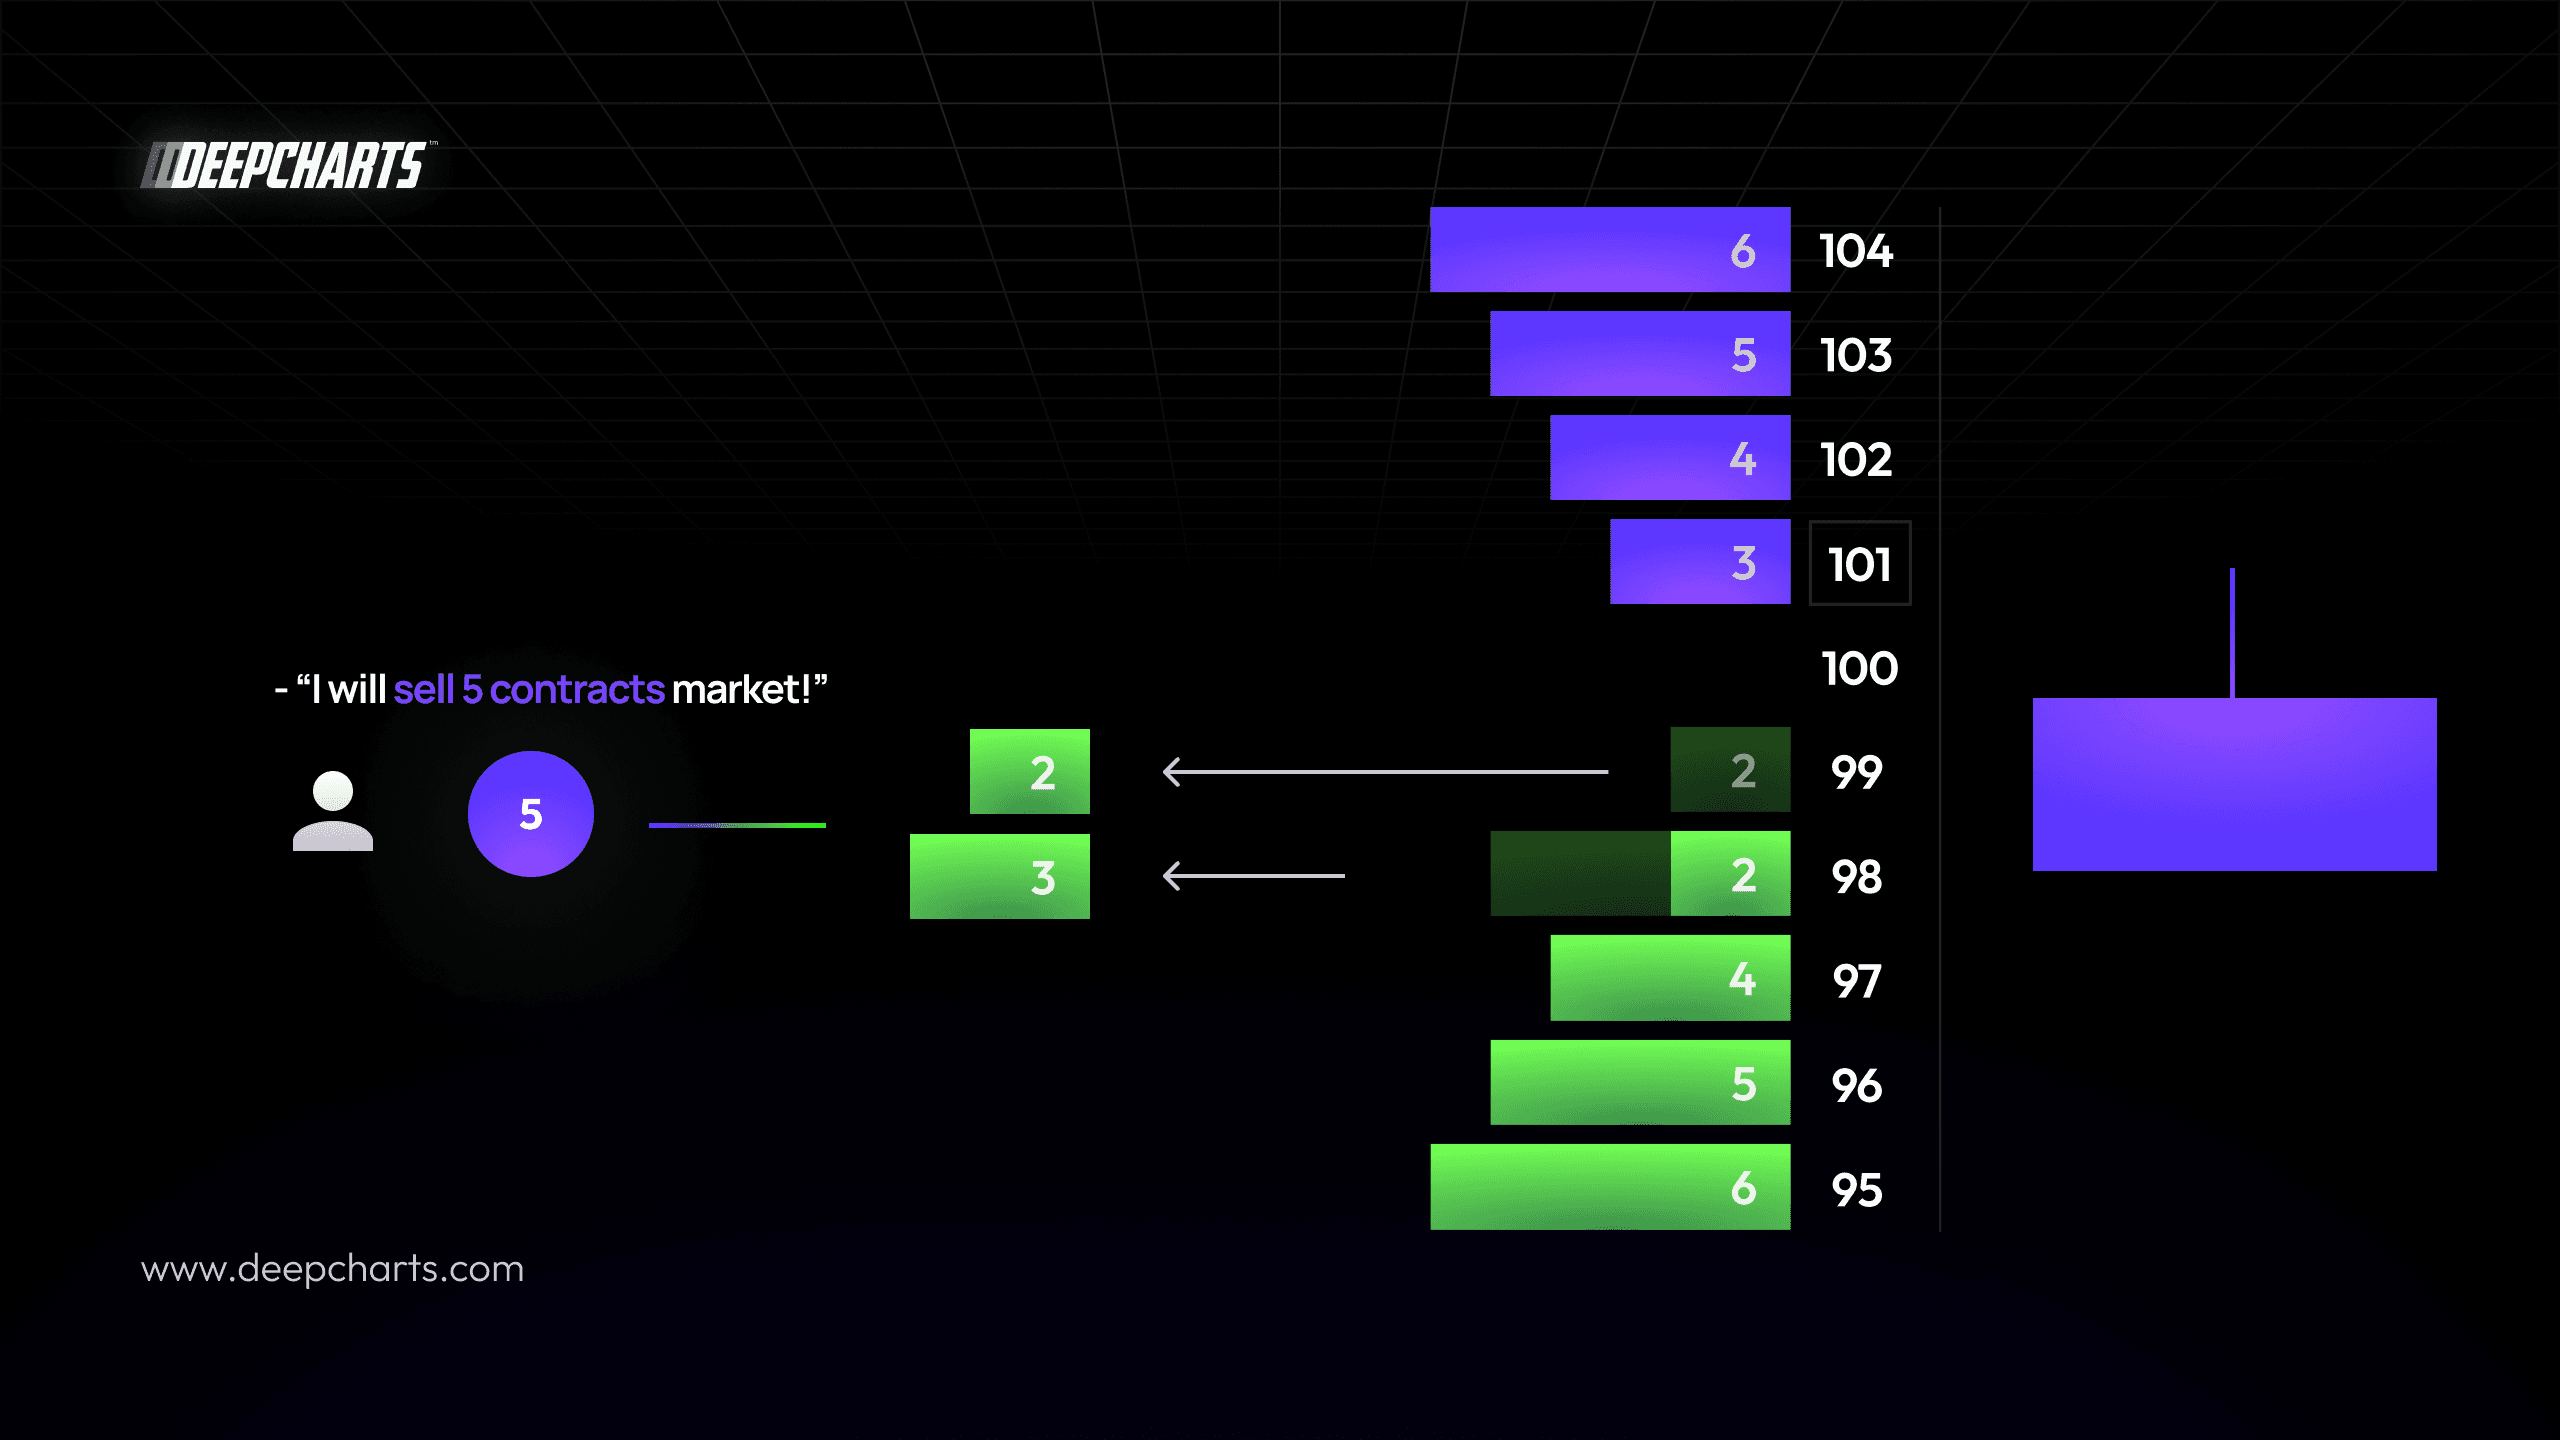
If a seller now hits the bid with 6 market orders:
At 99: 2 contracts traded.
At 98: 4 contracts traded.
→ The footprint displays these as 2 × 0 or 4 × 0, depending on which side was hit
Candle + Footprint Together
Now the candle turns red*:
Because aggressive sellers have pushed the price down from 100 to 98.
Each price level along the way records how much volume traded on each side.
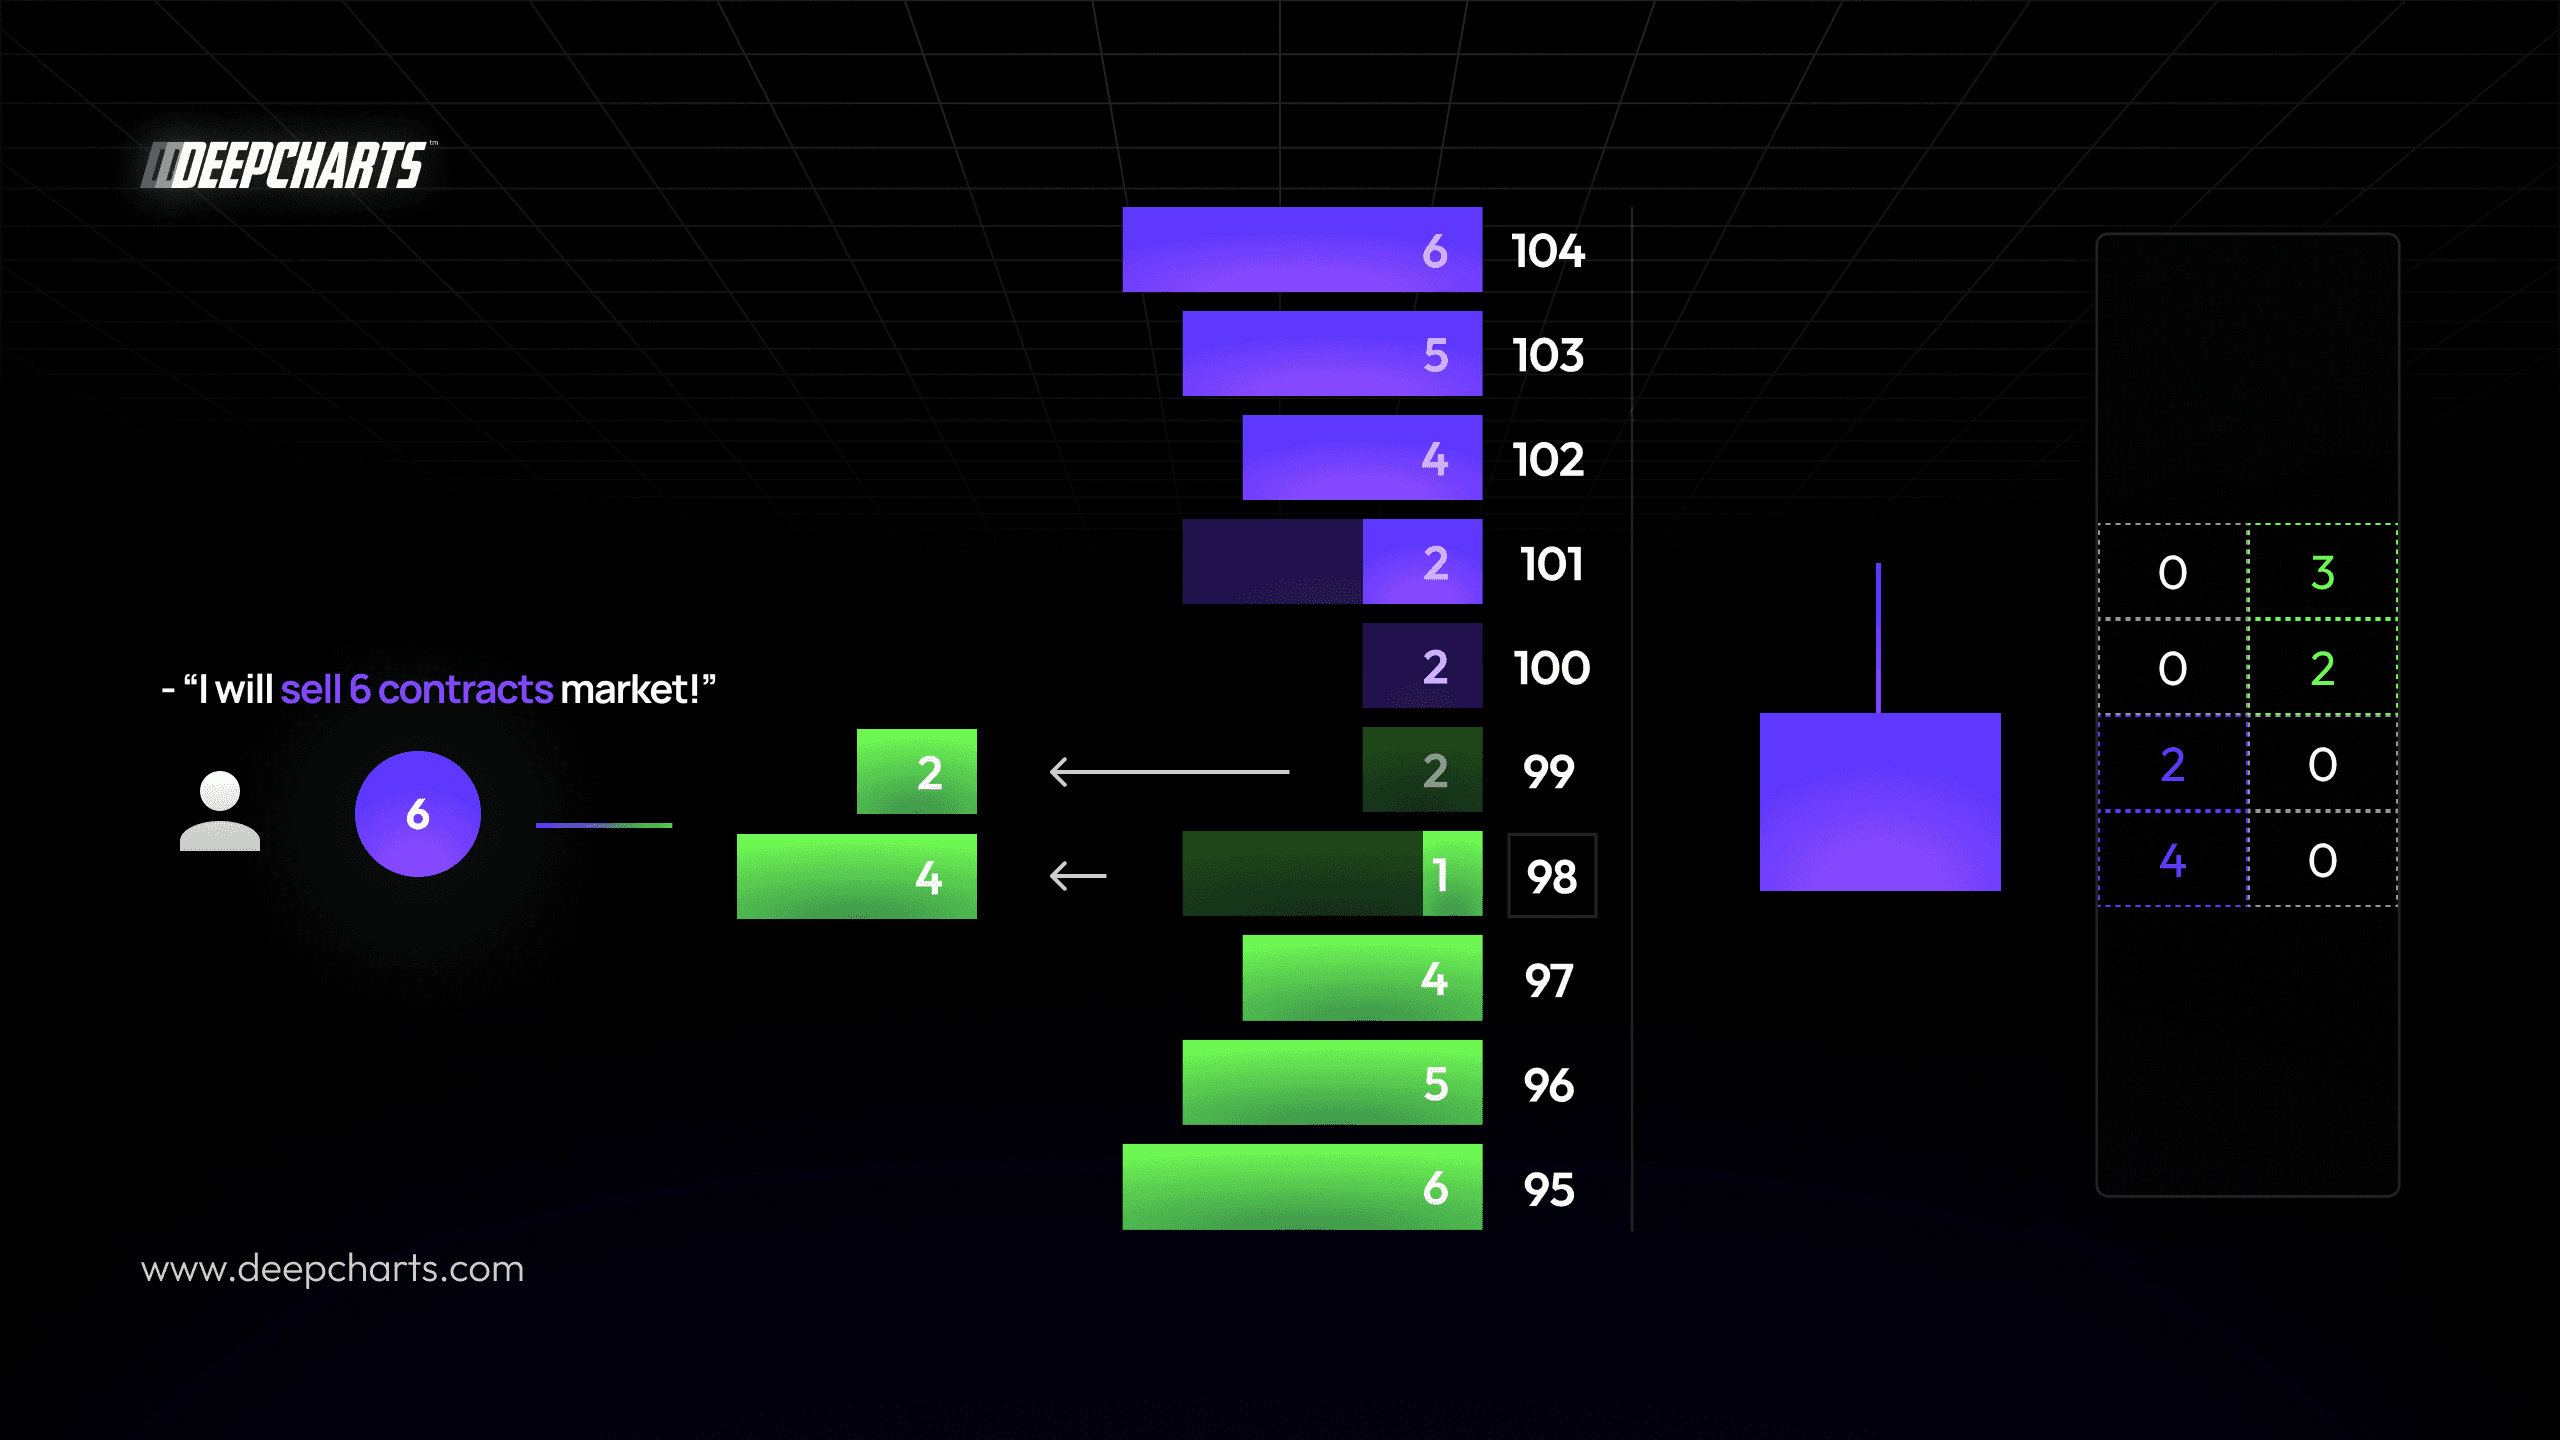
Next to the price chart:
The Footprint shows how the volume traded at each level (0×3, 0×2, 2×0,4×0…).
The Volume Profile shows where most of that trading activity happened overall
How It All Connects
Element | What It Shows | Practical Purpose |
Orderbook | Resting passive orders | Where the next trade may occur |
Price / Last | The most recent transaction | The instant equilibrium point |
Footprint | Bid/Ask volume at each level | Who’s being aggressive |
Candle | Summary of price action over time | Direction and momentum |
Volume Profile | Total volume distribution by price | Acceptance and rejection zones |

Deepcharts Team
·
Share this on