Indicatori
Updated:
L'indicatore Speed of Tape (instant) misura la velocità istantanea con cui le operazioni vengono eseguite sul mercato analizzando il flusso dei volumi in una finestra temporale specificata. Fornisce una visione in tempo reale dell'intensità dell'attività di mercato, aiutando i trader a individuare periodi di maggiore velocità degli scambi che spesso coincidono con movimenti di prezzo significativi, breakout o attività istituzionale. Tracciando la rapidità con cui il volume si accumula all'interno di ogni barra, questo indicatore rivela l'urgenza e l'aggressività dei partecipanti al mercato, rendendolo utile per lo scalping, il trading di momentum e per identificare potenziali fasi di accelerazione o decelerazione nei trend di mercato.
Impostazioni di utilizzo
Facendo clic sull'icona delle impostazioni dell'indicatore si aprirà la sua finestra di configurazione, all'interno della quale sarà possibile effettuare diverse scelte relative alla funzionalità dell'indicatore stesso.
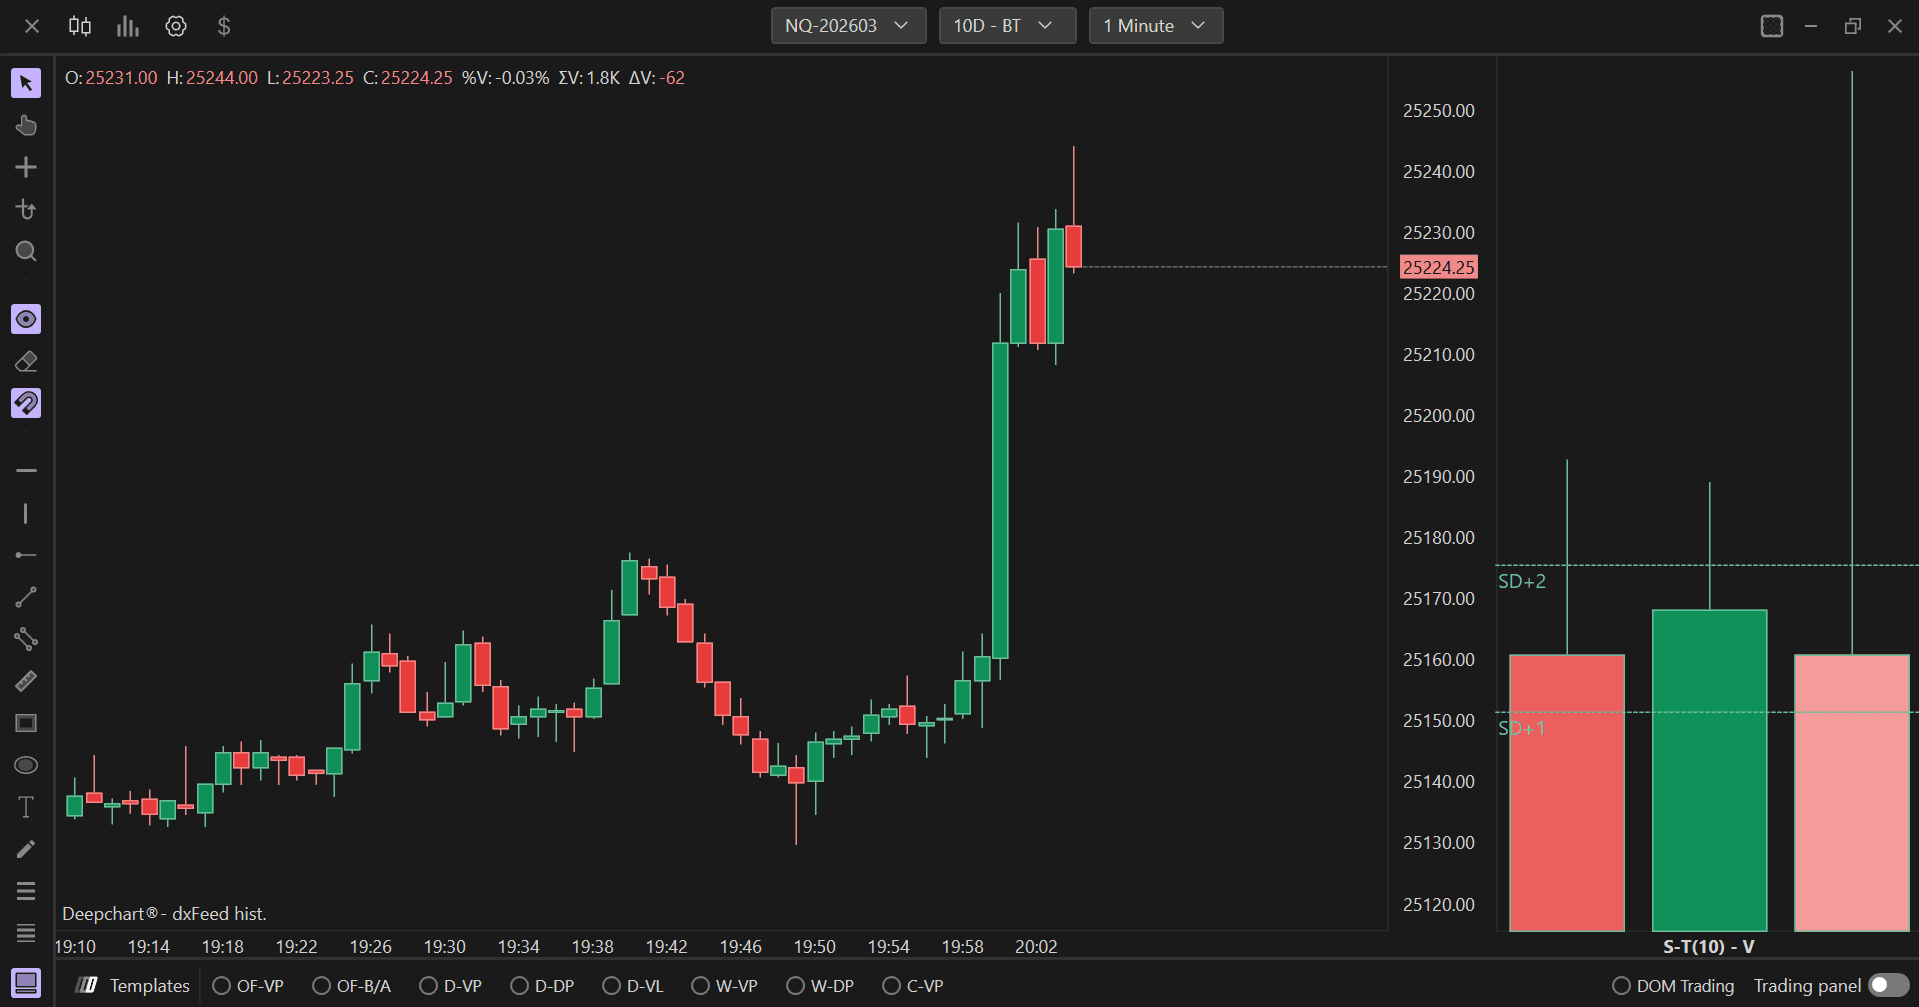
Comprendere la visualizzazione dello Speed of Tape
L'indicatore Speed of Tape viene visualizzato come un istogramma verticale in un pannello separato sotto il grafico principale del prezzo. La visualizzazione utilizza barre colorate per rappresentare la velocità di trading in ciascun periodo temporale, con l'altezza della barra che indica l'intensità della speed of tape e il colore che mostra la direzione del flusso degli ordini.
Caratteristiche delle barre:
Barre verdi/turchesi: Rappresentano periodi di delta positivo in cui prevale la pressione in acquisto. Barre verdi più alte indicano un'attività di acquisto rapida e una partecipazione aggressiva del mercato sul lato bid.
Barre rosse/rosa: Rappresentano periodi di delta negativo in cui prevale la pressione in vendita. Barre rosse più alte indicano un'attività di vendita rapida e una partecipazione aggressiva del mercato sul lato offer.
Altezza della barra: Corrisponde direttamente alla speed of tape - barre più alte indicano una maggiore velocità di trading (più volume o ordini eseguiti al secondo), mentre barre più basse indicano una velocità di trading inferiore.
Applicazioni di trading:
Conferma del momentum: Improvvisi picchi nella speed of tape (barre alte) spesso precedono o confermano movimenti di prezzo significativi, aiutando i trader a individuare potenziali scenari di breakout o breakdown.
Segnali di esaurimento: Un rapido calo della speed of tape dopo un movimento prolungato (barre che diventano progressivamente più basse) può indicare esaurimento del momentum e potenziali punti di inversione.
Fasi di accelerazione: Barre progressivamente più alte indicano una partecipazione di mercato in accelerazione, il che può segnalare trend in rafforzamento e migliori opportunità di ingresso.
Periodi a bassa velocità: Barre molto corte o assenti indicano bassa attività di trading, suggerendo fasi di consolidamento o una partecipazione istituzionale ridotta in cui il prezzo può muoversi in range.
Impostazioni del grafico

Barre da mostrare
Definisce quante barre storiche dei dati dello Speed of Tape verranno visualizzate sul grafico. Il valore predefinito è 3. Questo parametro controlla la cronologia visualizzata, consentendo di vedere i pattern recenti della velocità del tape senza affollare il grafico con troppi dati storici. Meno barre (1-3) si concentrano sull'attività attuale, mentre più barre (5-10) forniscono un contesto per confrontare la velocità attuale con i periodi recenti.
Valore minimo della scala
Imposta il valore minimo della scala dell'indicatore. Il valore predefinito è 0. Questo parametro stabilisce la base per la rappresentazione visiva della speed of tape, assicurando che il grafico mostri una scala coerente indipendentemente dai livelli effettivi di attività di mercato. Impostarlo a 0 garantisce che tutti i valori positivi di velocità siano chiaramente visibili sopra la base.
Generale (impostazioni delle candele)
Spessore linea
Regola lo spessore delle linee delle candele o delle barre utilizzate per visualizzare la speed of tape. Il valore predefinito è 1. Aumentare questo valore rende la rappresentazione visiva più evidente e più facile da vedere, particolarmente utile quando più indicatori sono visualizzati contemporaneamente o quando si consultano grafici su schermi più grandi. Linee più spesse offrono una migliore visibilità per identificare rapidamente i cambiamenti di velocità.
Grafico invertito
Quando è abilitato, inverte l'orientamento verticale del grafico dell'indicatore. Questo può essere utile per preferenze visive o quando si organizzano più indicatori in una specifica configurazione del layout. Quando è disabilitato (impostazione predefinita), l'indicatore viene visualizzato nell'orientamento standard, con le speed of tape più alte mostrate come barre più alte che si estendono verso l'alto.
Delta positivo
Imposta il colore delle barre che rappresentano i periodi di delta positivo, in cui il volume in acquisto o l'attività di acquisto aggressiva supera quella in vendita. Il colore predefinito mostrato è verde/turchese. Questa codifica cromatica aiuta i trader a identificare immediatamente i periodi di speed of tape rialzista e di pressione in acquisto, rendendo facile individuare i cambi di momentum e le potenziali opportunità di ingresso allineate con il flusso degli ordini positivo.
Delta negativo
Imposta il colore delle barre che rappresentano i periodi di delta negativo, in cui il volume in vendita o l'attività di vendita aggressiva supera quella in acquisto.
Delta positivo (secondario)
Imposta un'opzione di colore aggiuntiva per la visualizzazione del delta positivo.
Delta negativo (secondario)
Imposta un'opzione di colore aggiuntiva per la visualizzazione del delta negativo.
Impostazioni dei dati
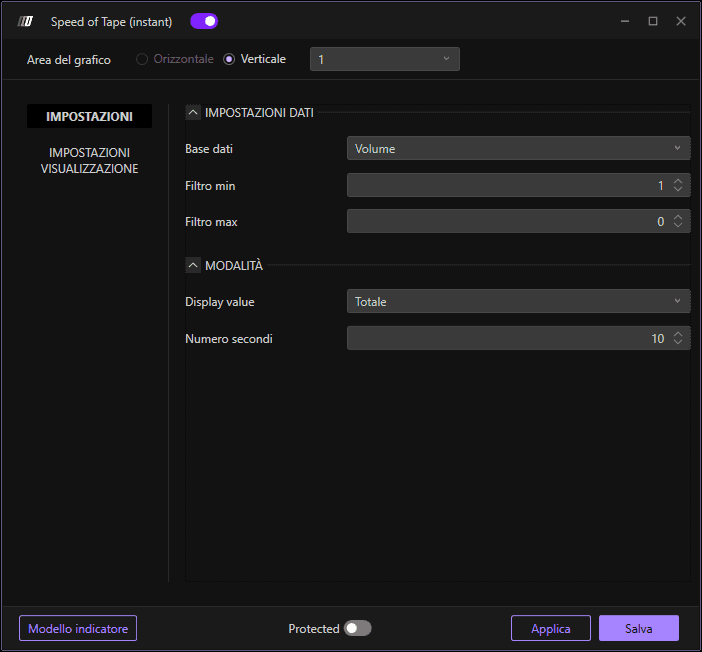
Dati in input
Specifica la sorgente dati utilizzata per calcolare la speed of tape. Le opzioni disponibili sono:
Volume: Utilizza i dati di volume di ogni barra per misurare la velocità di trading (predefinito). È l'impostazione più comune poiché riflette direttamente il numero di contratti o azioni scambiati, fornendo una misura chiara dell'intensità dell'attività di mercato.
Ordine: Utilizza i dati del flusso degli ordini per calcolare la speed of tape, il che può fornire indicazioni sull'aggressività dell'attività di acquisto rispetto a quella di vendita e sul momentum sottostante dei partecipanti al mercato.
L'impostazione predefinita "Volume" è consigliata per la maggior parte delle applicazioni, poiché offre la misura più immediata della velocità di trading e dei livelli di partecipazione al mercato.
Filtro min
Imposta la soglia minima di volume o di flusso degli ordini per i calcoli. Questo filtro esclude i periodi di bassa attività dal calcolo della velocità, aiutando a ridurre il rumore e a concentrarsi su misurazioni significative della velocità di trading. Le barre con attività inferiore a questa soglia non vengono incluse nel calcolo della speed of tape, assicurando che l'indicatore rifletta una reale partecipazione al mercato anziché scambi sporadici a basso volume.
Filtro max
Imposta la soglia massima di volume o di flusso degli ordini per i calcoli. Il valore predefinito è 0 (nessun limite massimo). Questo filtro può essere utilizzato per limitare periodi di attività estremamente elevata che potrebbero distorcere le letture dell'indicatore, anche se nella maggior parte dei casi lasciare questo valore a 0 consente all'indicatore di cogliere tutta l'attività di mercato significativa senza limitazioni artificiali.
Modalità
Valore visualizzato
Determina come viene calcolata e visualizzata la misurazione della speed of tape. L'impostazione predefinita è "Total", che aggrega tutta l'attività di trading all'interno della finestra temporale specificata per fornire una visione completa della velocità complessiva del mercato. Questa impostazione controlla se l'indicatore mostra la velocità cumulativa, la velocità media o altri metodi di calcolo per la lettura del tape.
Numero di secondi
Definisce la finestra temporale, in secondi, su cui viene calcolata la speed of tape. Il valore predefinito è 10 secondi. Questo parametro determina quanto rapidamente l'indicatore risponde ai cambiamenti nella velocità di trading. Finestre temporali più brevi (ad es. 5-10 secondi) rendono l'indicatore molto reattivo ai picchi improvvisi di attività, ideale per lo scalping e per individuare cambi di momentum immediati. Finestre temporali più lunghe (ad es. 15-30 secondi) smussano le letture e offrono una visione più stabile dell'intensità di trading sostenuta, più adatta allo swing trading o per filtrare brevi picchi di attività.