


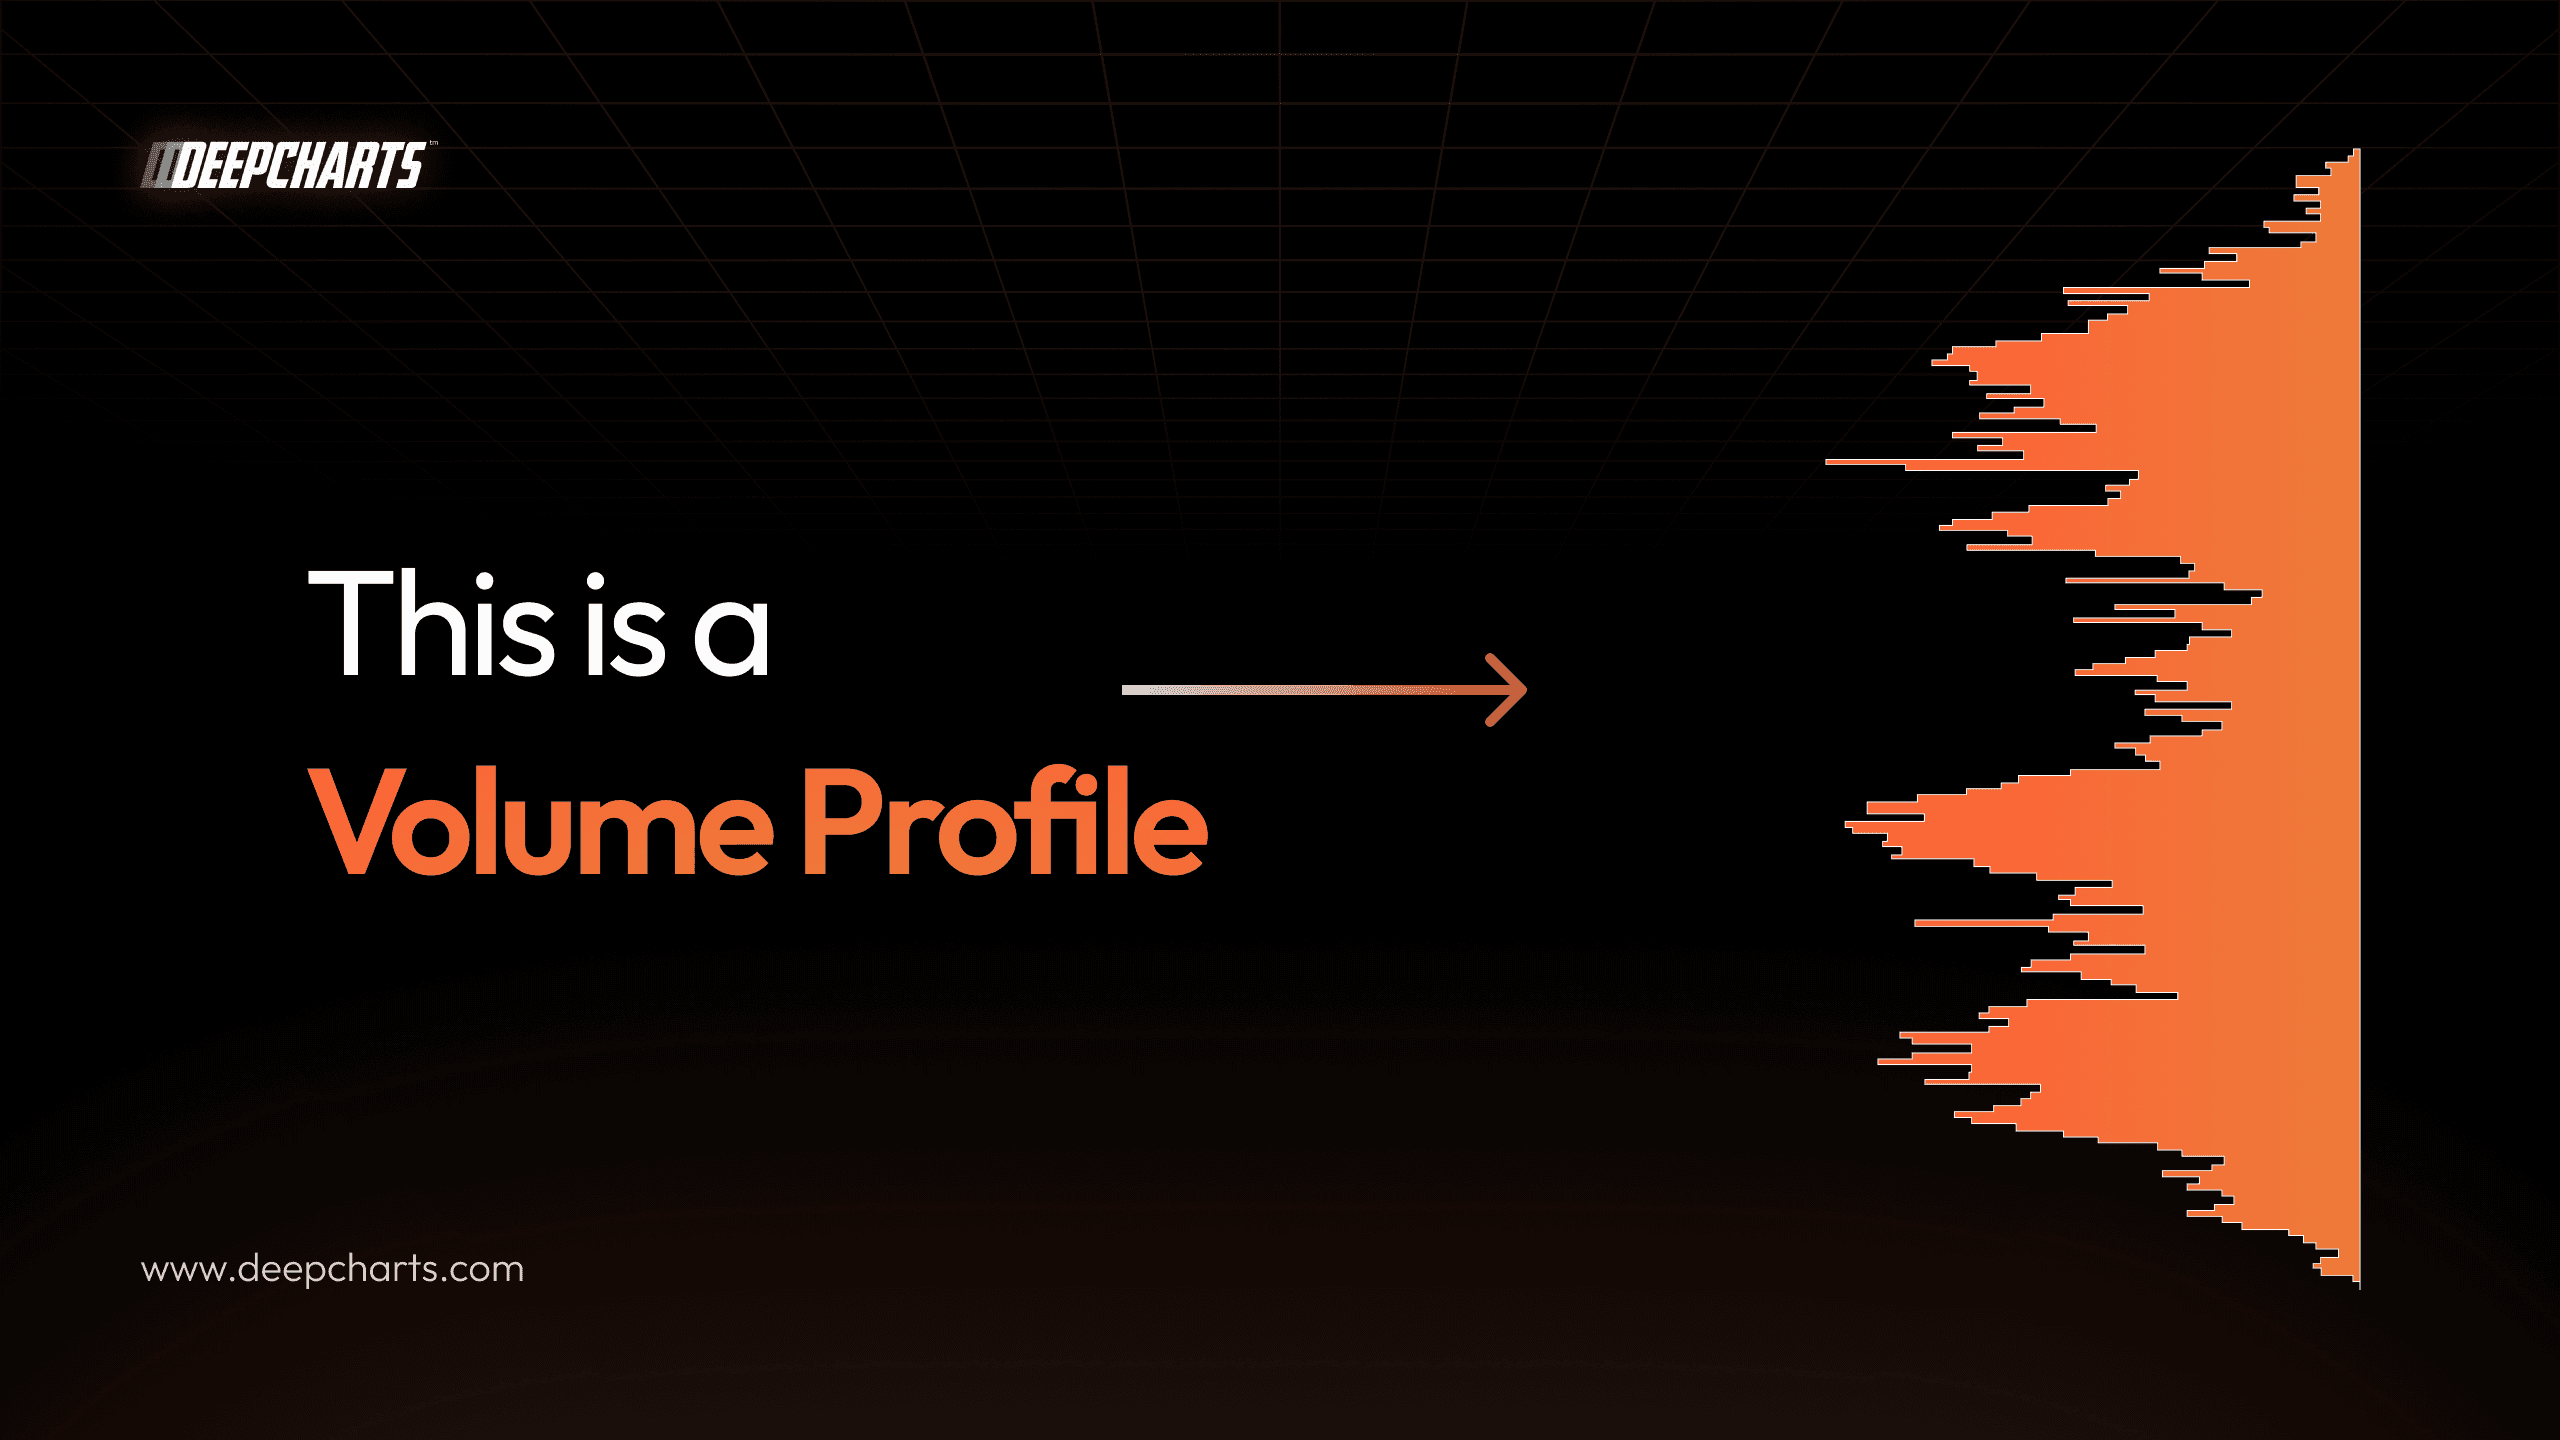
Volume Profile shifts the focus from what price did to where capital was actually traded.
Instead of guessing breakouts or drawing arbitrary support and resistance lines, it reveals where value was accepted, where it was rejected, and where real imbalance began.
This is not about predicting the next candle.
It is about understanding how the market auction works and how money truly moves price.
In this guide, we will cover:
How to Set Up Volume Profile Correctly
What is Volume Profile
High Volume Nodes, Low Volume Nodes and the 70% Value Area
Practical Volume Profile trading strategies
How to Set Up Volume Profile Correctly
To set up Volume Profile correctly in DeepCharts, you must start with real exchange data, not tick-based proxies.
Open a futures contract (for example the S&P 500 - ES) and ensure you are connected to the actual CME data feed, because the accuracy of the Point of Control and Value Area depends on real traded volume, not approximations.
Right-click on the chart, go to Indicators, search for Deep Profile, and add it to your chart. This is the profile built on real exchange volume, which is essential for institutional-grade analysis.
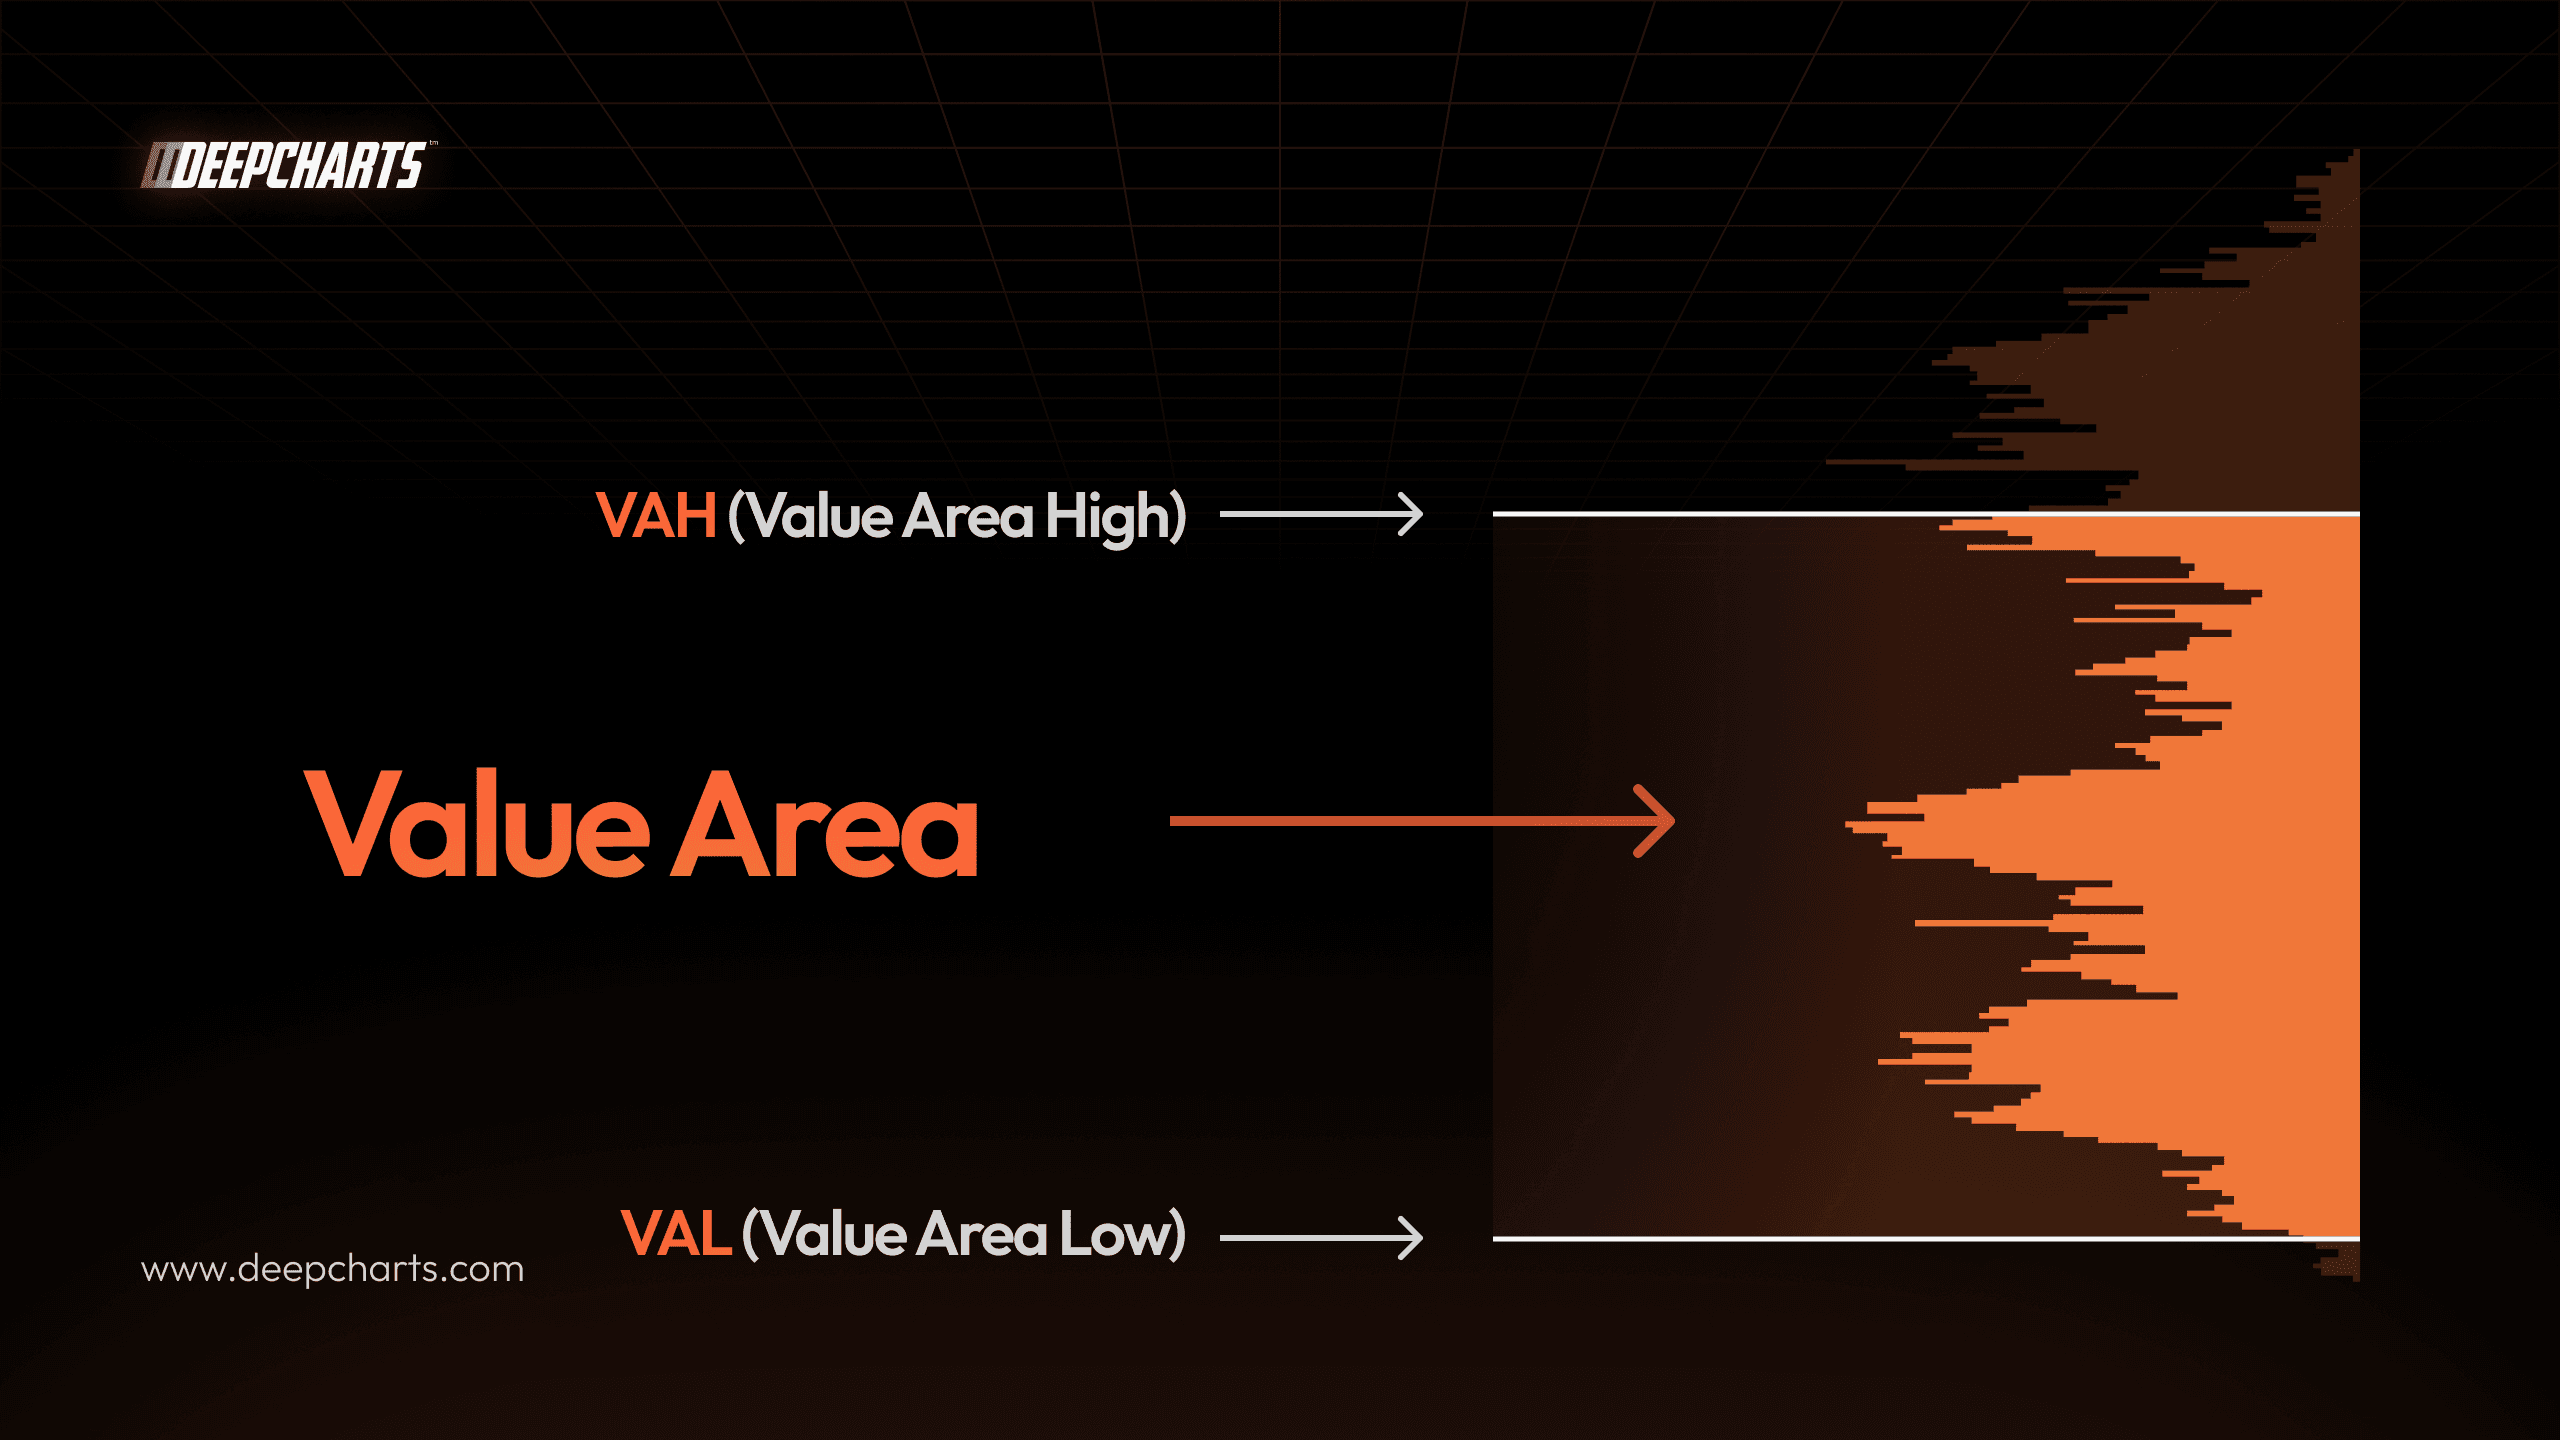
Use the Daily Session Volume Profile as your primary structure. This allows you to see the current day’s volume distribution, the Value Area (approximately 70% of traded volume), the Point of Control (POC), and the High and Low Volume Nodes (HVN and LVN). This daily profile becomes the foundation for identifying balance, failed auctions, and qualified breakouts.
In the profile settings, enable Volume + Delta instead of volume alone. Delta shows net buying versus selling pressure at each price level (buy volume minus sell volume), allowing you to see where aggressive buyers or sellers took control. This adds a deeper layer of execution insight beyond simple volume distribution.
Activate the VWAP (Volume Weighted Average Price) and, if available, the developing VWAP. VWAP represents the session’s volume-weighted average price and is widely used by institutional execution algorithms, making it a key reference level.
Enable RTH split (Regular Trading Hours) to separate the cash session from the overnight (Asia + London) session. Most institutional volume is traded during regular trading hours, so prioritizing the RTH profile improves the reliability of your levels.
Finally, add a Composite Volume Profile (for example over 30–90 days) to establish higher timeframe bias. This broader distribution helps you identify major acceptance zones and understand where capital has accumulated over time.
A correct DeepCharts setup therefore includes: real exchange volume, the Daily Deep Profile, Value Area (70%), POC, Volume + Delta, VWAP, RTH split, and a Composite profile for macro bias.
What Is Volume Profile
Volume Profile is a tool that displays how much trading activity occurred at each price level over a specific period of time.
Unlike traditional volume indicators, which show volume by time, Volume Profile shows volume by price.
This means it reveals where the market spent the most capital and not just when the activity happened.
Every transaction in the market is the result of a buyer and a seller agreeing on a price. Volume Profile aggregates these transactions and builds a distribution that highlights the relevant price activity within that range
The result is a clear visual representation of how value was built inside an auction.
How Markets Reveal Acceptance and Rejection
When large amounts of volume concentrate at specific price levels, we get what are called High Volume Nodes (HVNs).
These areas represent acceptance: buyers and sellers agreed on value and were willing to transact heavily there. Price tends to rotate, pause, and build structure around these zones.
On the other hand, when volume is thin and price moves quickly through an area, we get Low Volume Nodes (LVNs).
These represent rejection or imbalance: one side dominated the auction, and the market moved aggressively away in search of a new fair price.
Most volume profiles also highlight the Value Area, which statistically contains about 70% of all traded volume within a session.
This reflects the concept of normal distribution:
Inside the value area = fair priced activity
Outside the value area = potential anomaly
When price moves outside this 70% range, it is either:
Being rejected and likely to revert (we might witness the so called “failed auction”)
Or being accepted, signaling the start of a new value distribution
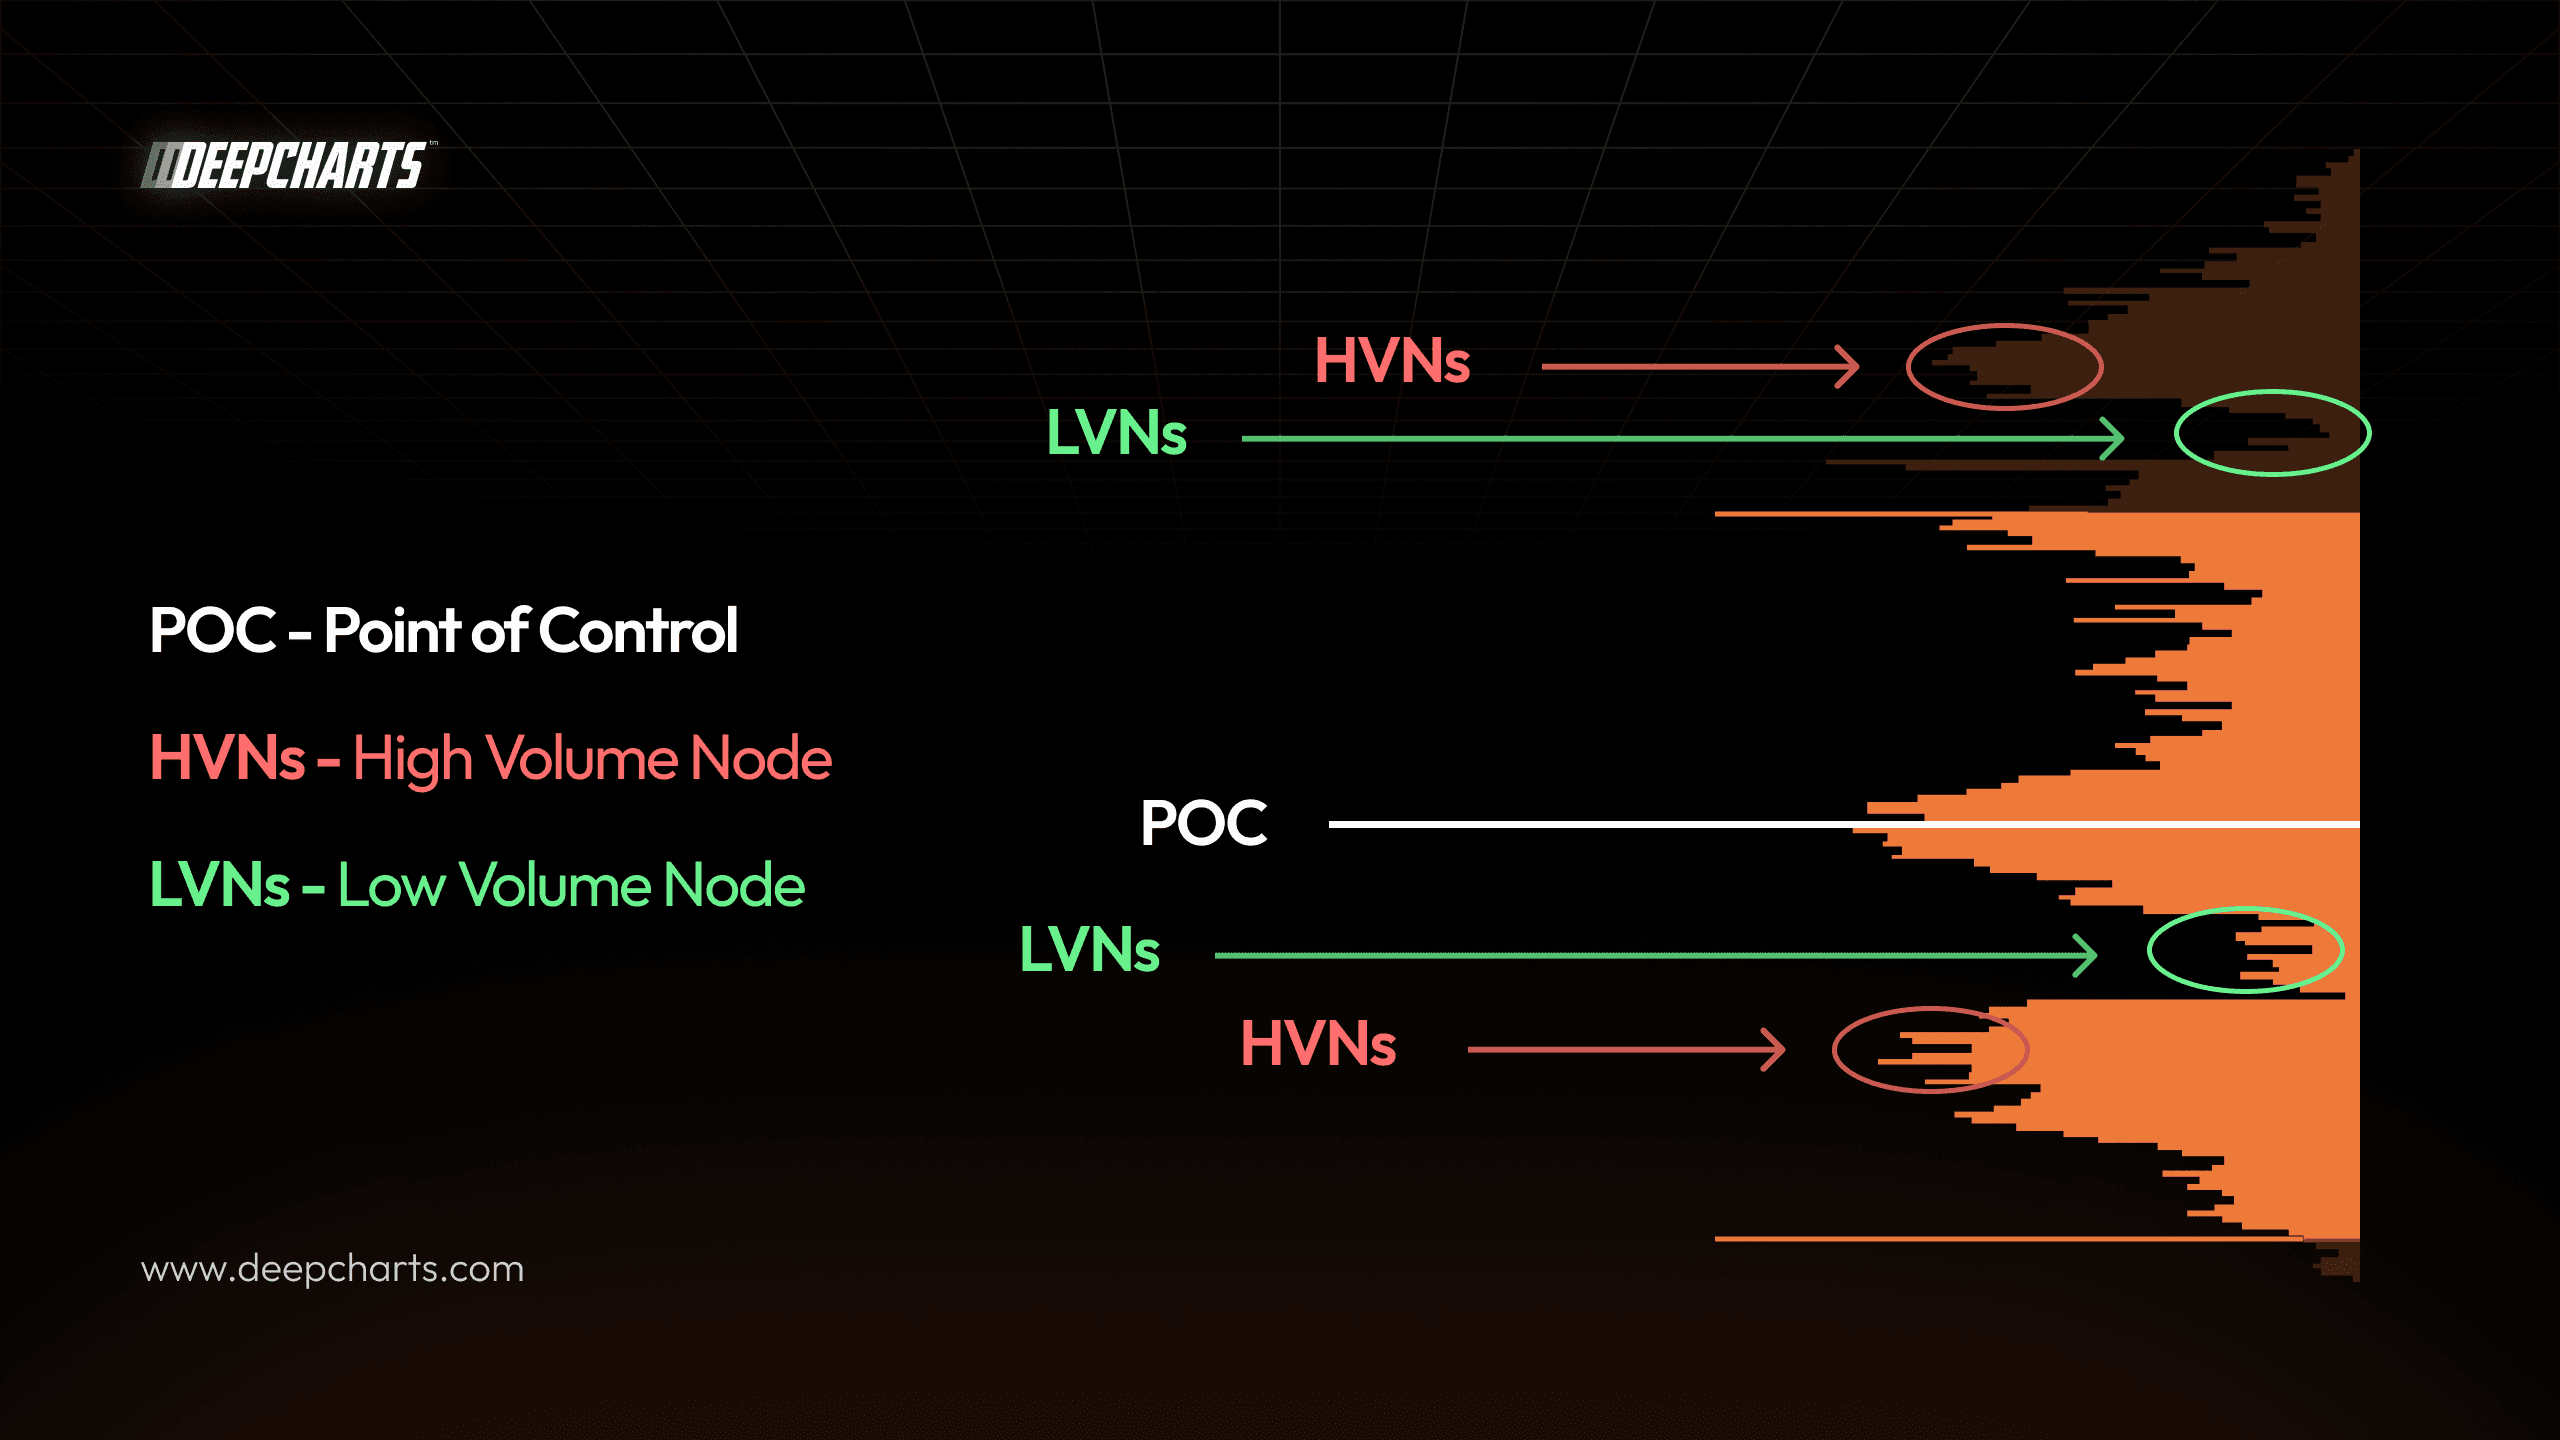
High volume means acceptance. Low volume means imbalance.
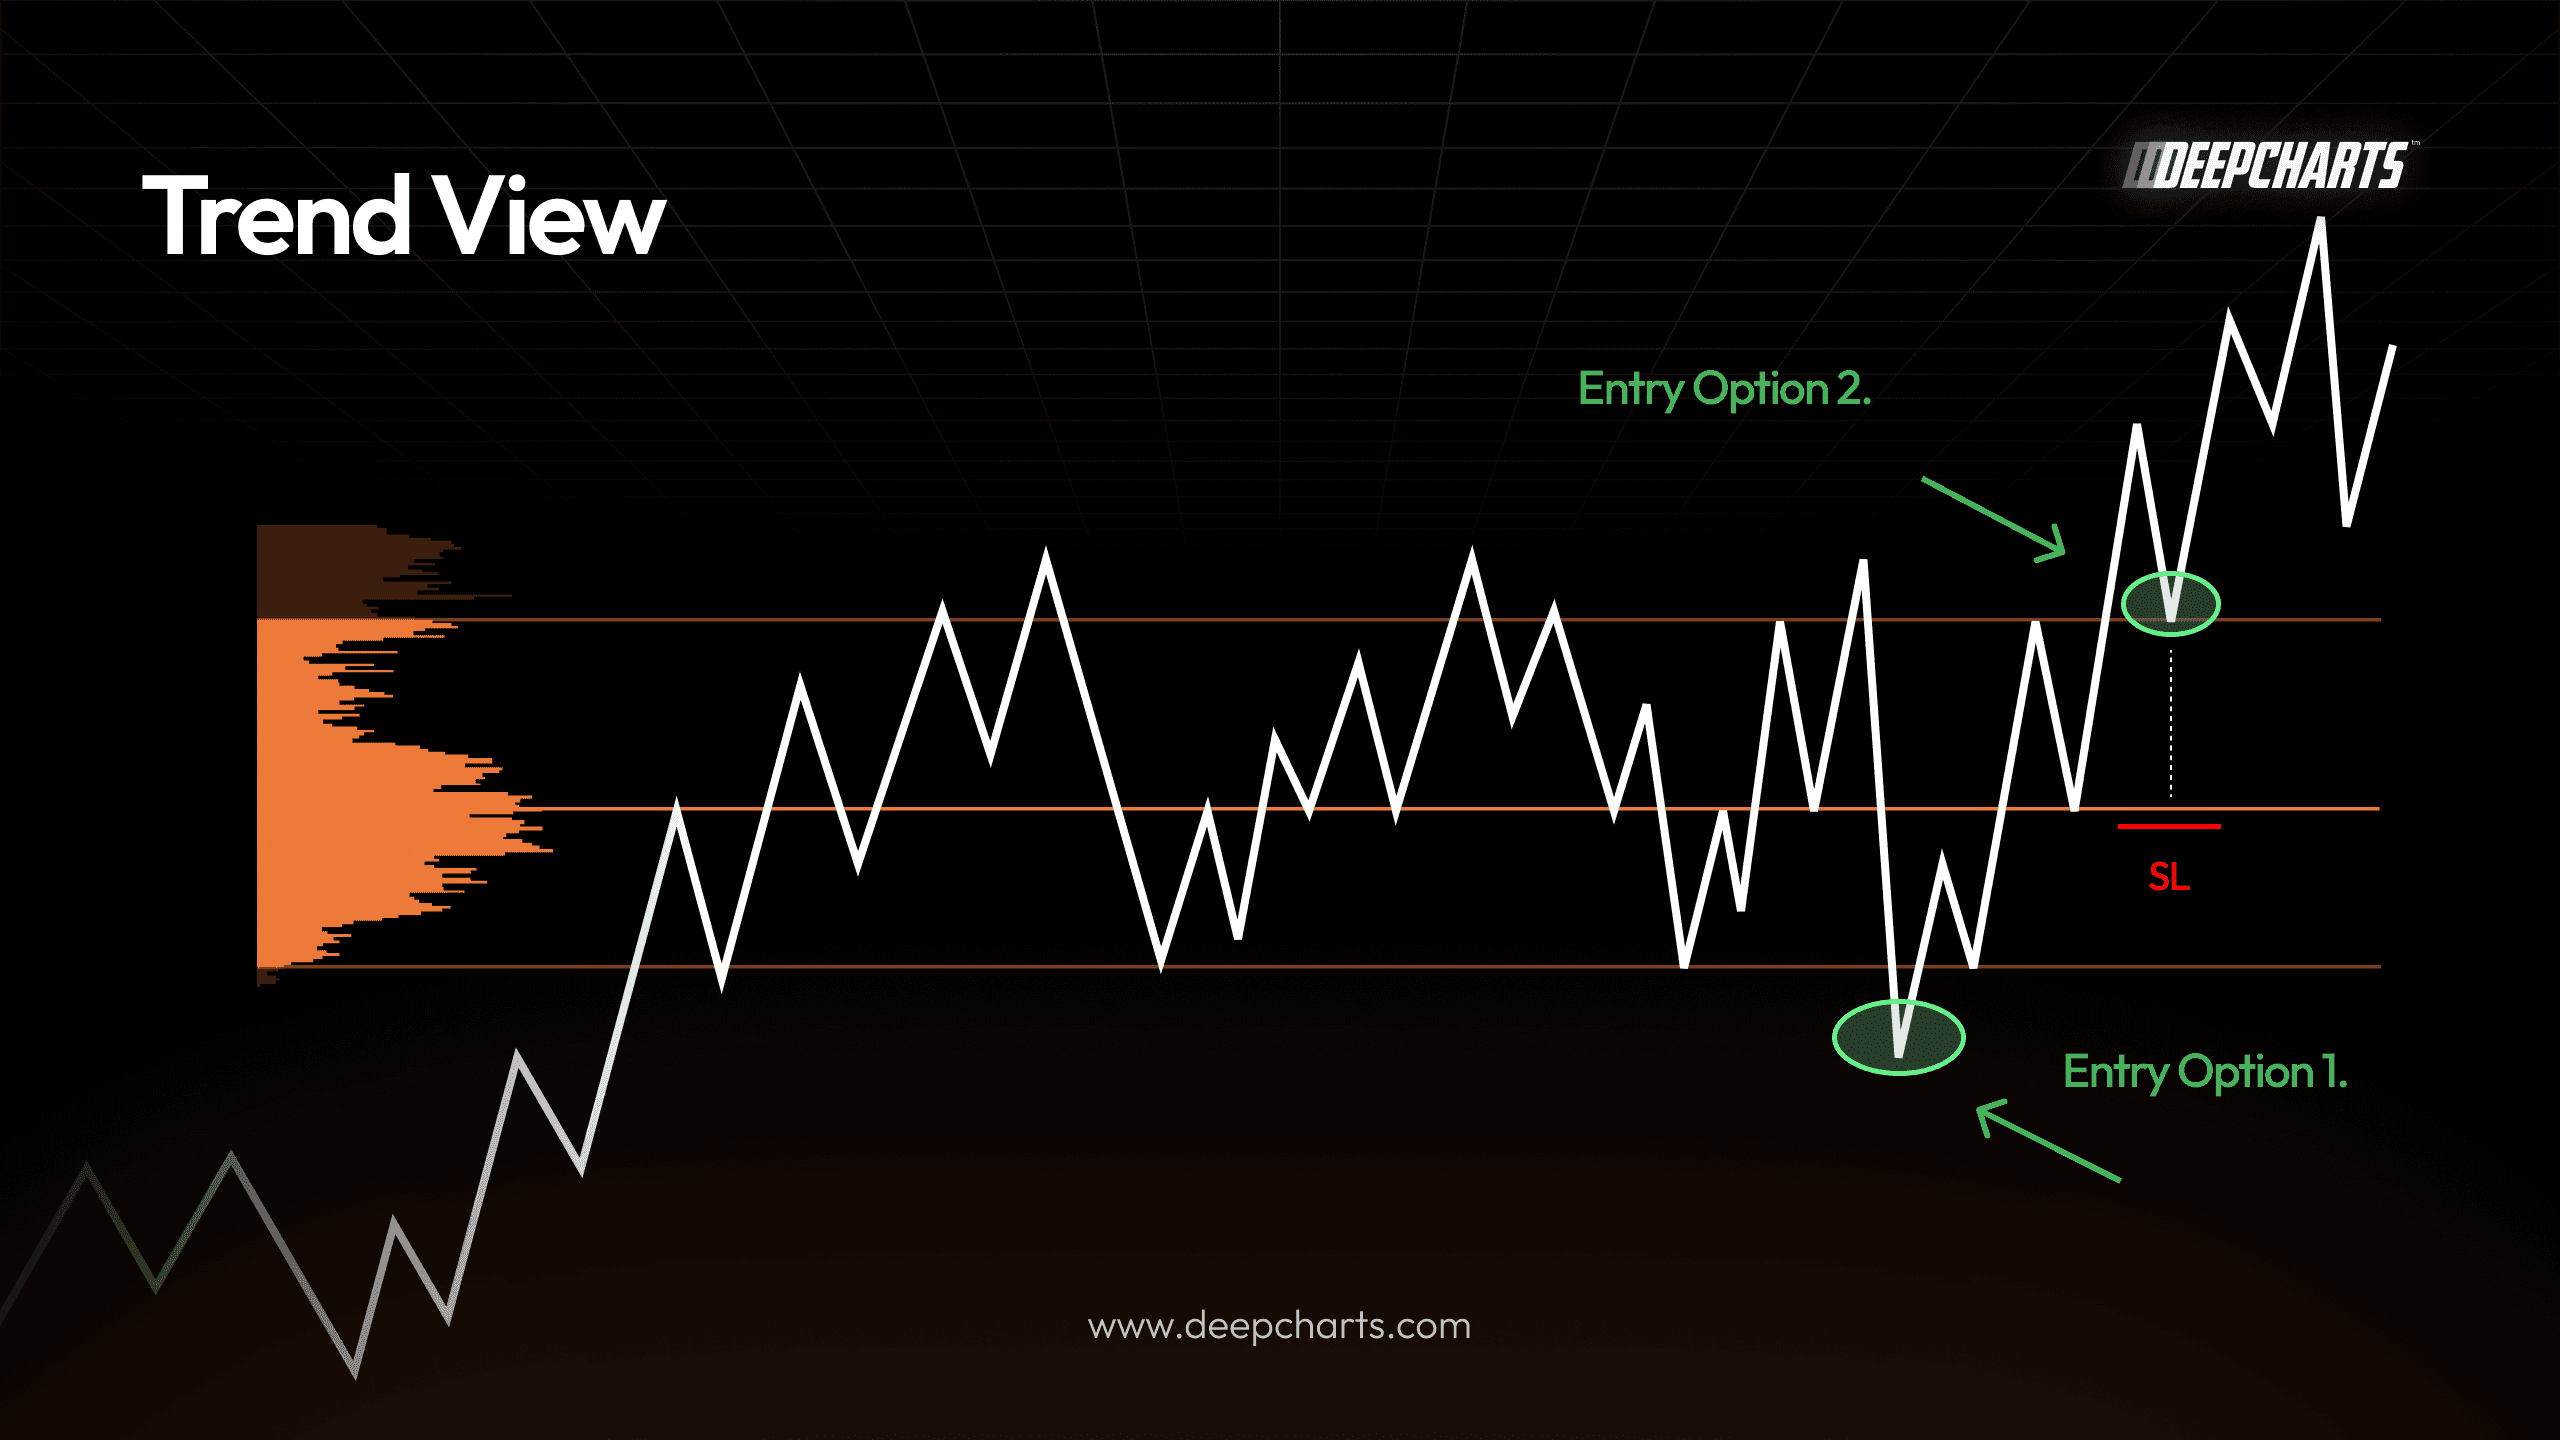
Practical Volume Profile Trading Strategies
Volume Profile is not just a visual tool: it defines context, location, and execution within one structured framework.
Bias comes first.
When the entire volume distribution shifts higher and new High Volume Nodes (HVNs) form above previous ones, value is migrating upward (this confirms a structurally bullish environment).
When volume builds lower, value is migrating down (this confirms bearish conditions).
Do not define trend only by price structure; define it by where value is being accepted.
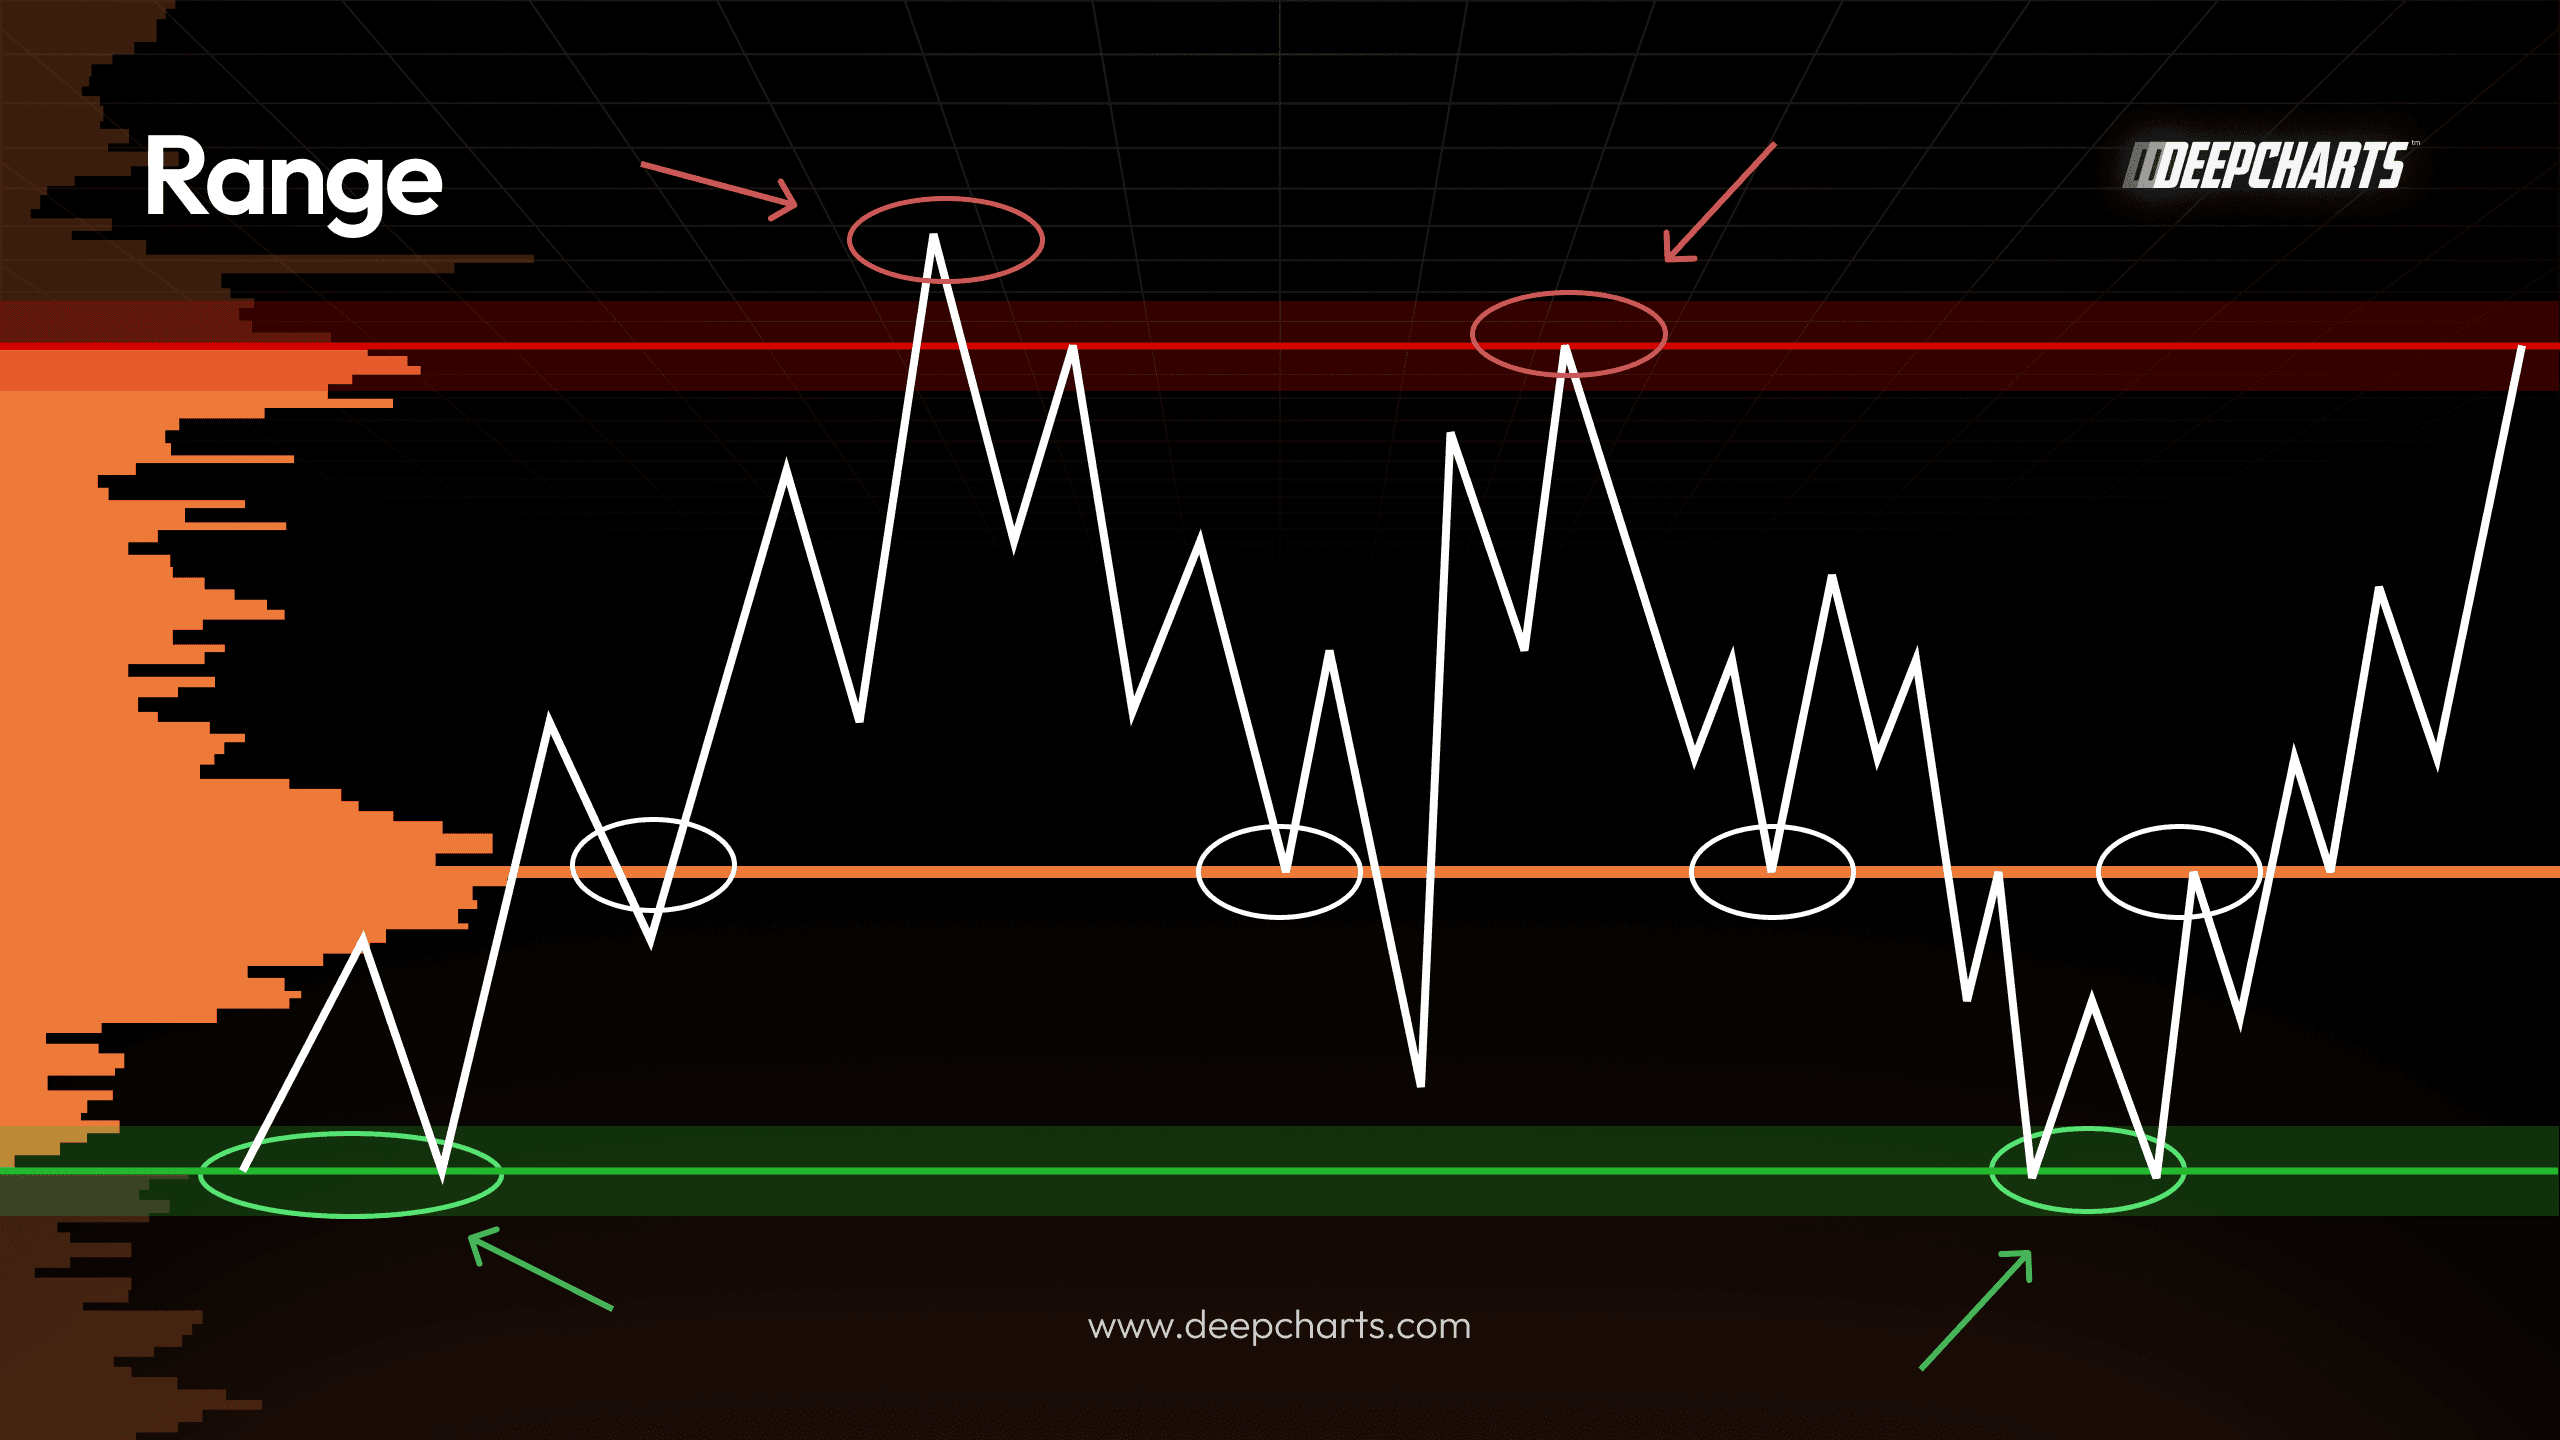
Then comes location.
Roughly 70% of volume trades inside the Value Area. When price rotates within it, the market is in balance.
This is where range strategies apply: sell the upper edge of value and buy the lower edge, particularly when a breakout attempt fails and price re-enters the distribution (a failed auction).
Targets naturally gravitate toward the POC or the opposite side of the Value Area.
Then comes continuation.
When price leaves the Value Area and begins building new volume outside the previous distribution, that is acceptance — not just a breakout, but a shift in capital.
In this case, pullbacks toward the newly formed HVN become continuation entries, targeting expansion toward the next Low Volume Node (LVN), where price often accelerates due to lower historical participation.
Understand the roles of nodes.
HVNs act as magnets and battle zones, areas where heavy trading occurred and where price often reacts or rotates.
LVNs act as fast lanes, zones of imbalance where price tends to move quickly.
Finally, execution.
Short-term volume shifts and delta imbalances inside candles can serve as entry triggers, but only when aligned with the broader value context
So this was Volume Profile Explained
Now, before you go..
If you want to truly understand Volume Profile trading and how to read real market structure, this is just the beginning
In the video below, you’ll see how to use POC, Value Area, HVN/LVN and spot real imbalances and failed auctions on the chart
👇 Watch the full breakdown here
Subscribe for more on order flow, volume profile, and data-driven trading

Deepcharts Team
·
Share this on