Updated:
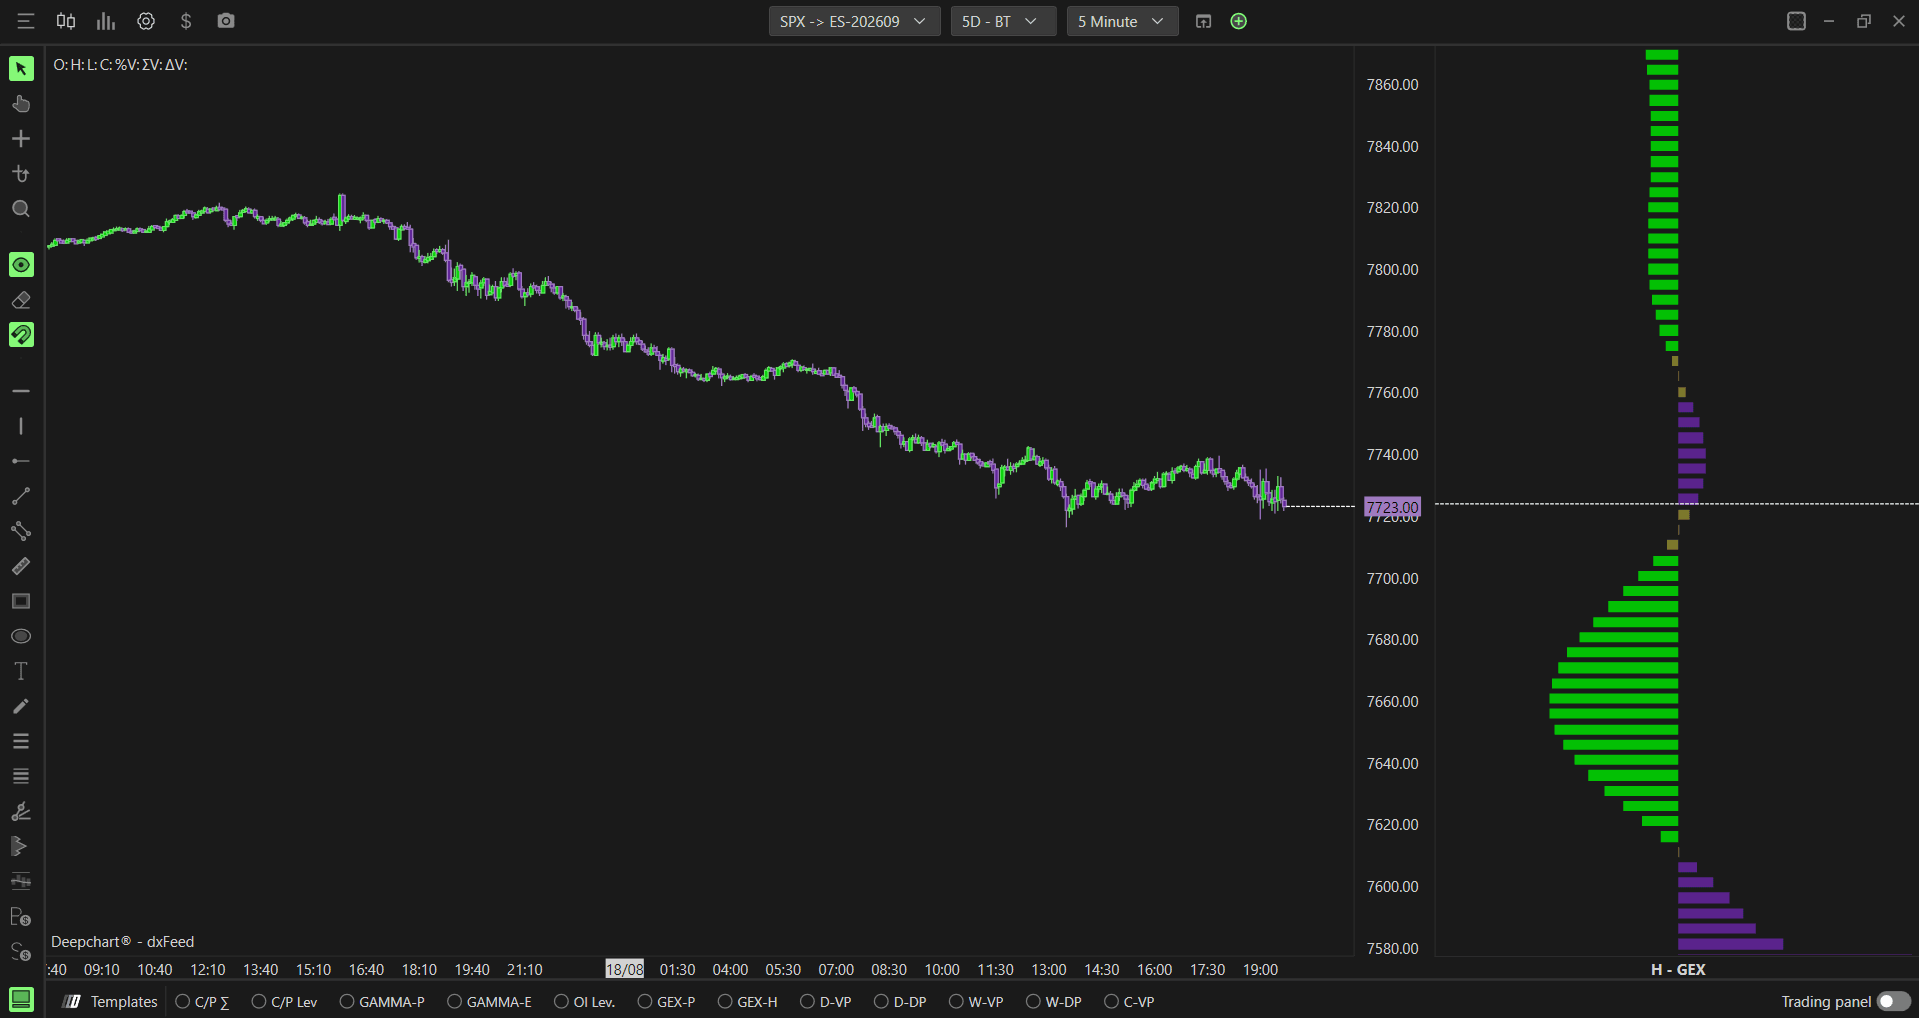
Option Gex Profile Hedging displays a vertical profile panel showing how Market Makers are likely to adjust their hedging at each strike price, based on implied volatility and the option Greeks rather than gamma exposure alone. Instead of just showing where dealer exposure is concentrated, it shows the likely direction of that hedging activity if price moves toward each level, helping you anticipate whether Market Maker hedging will amplify or dampen a move.
Note: Option Gex Profile Hedging is available on SPX only, as it requires CBOE data.

How to Add Option Gex Profile Hedging
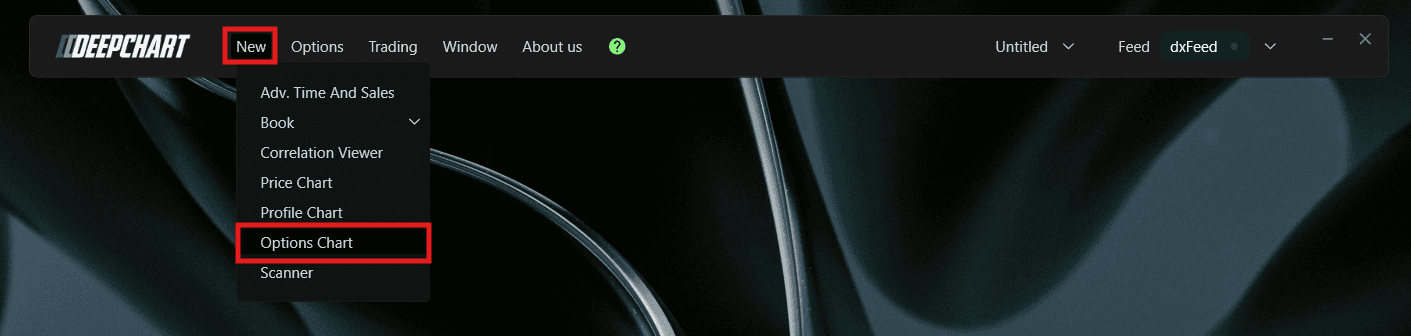
Go to New in the top menu
Click on Option Chart
A Select Instrument dialog will appear. Since Option Gex Profile Hedging requires CBOE data, select SPX - Symbol: ES-CME, Exchange: CME
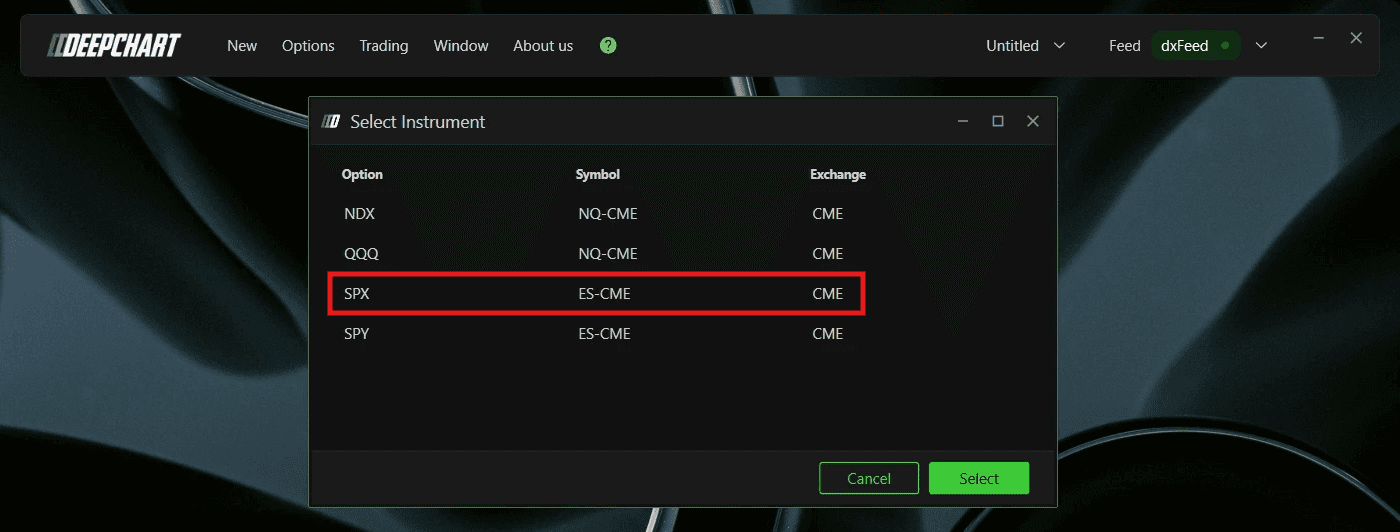
Click to open the chart
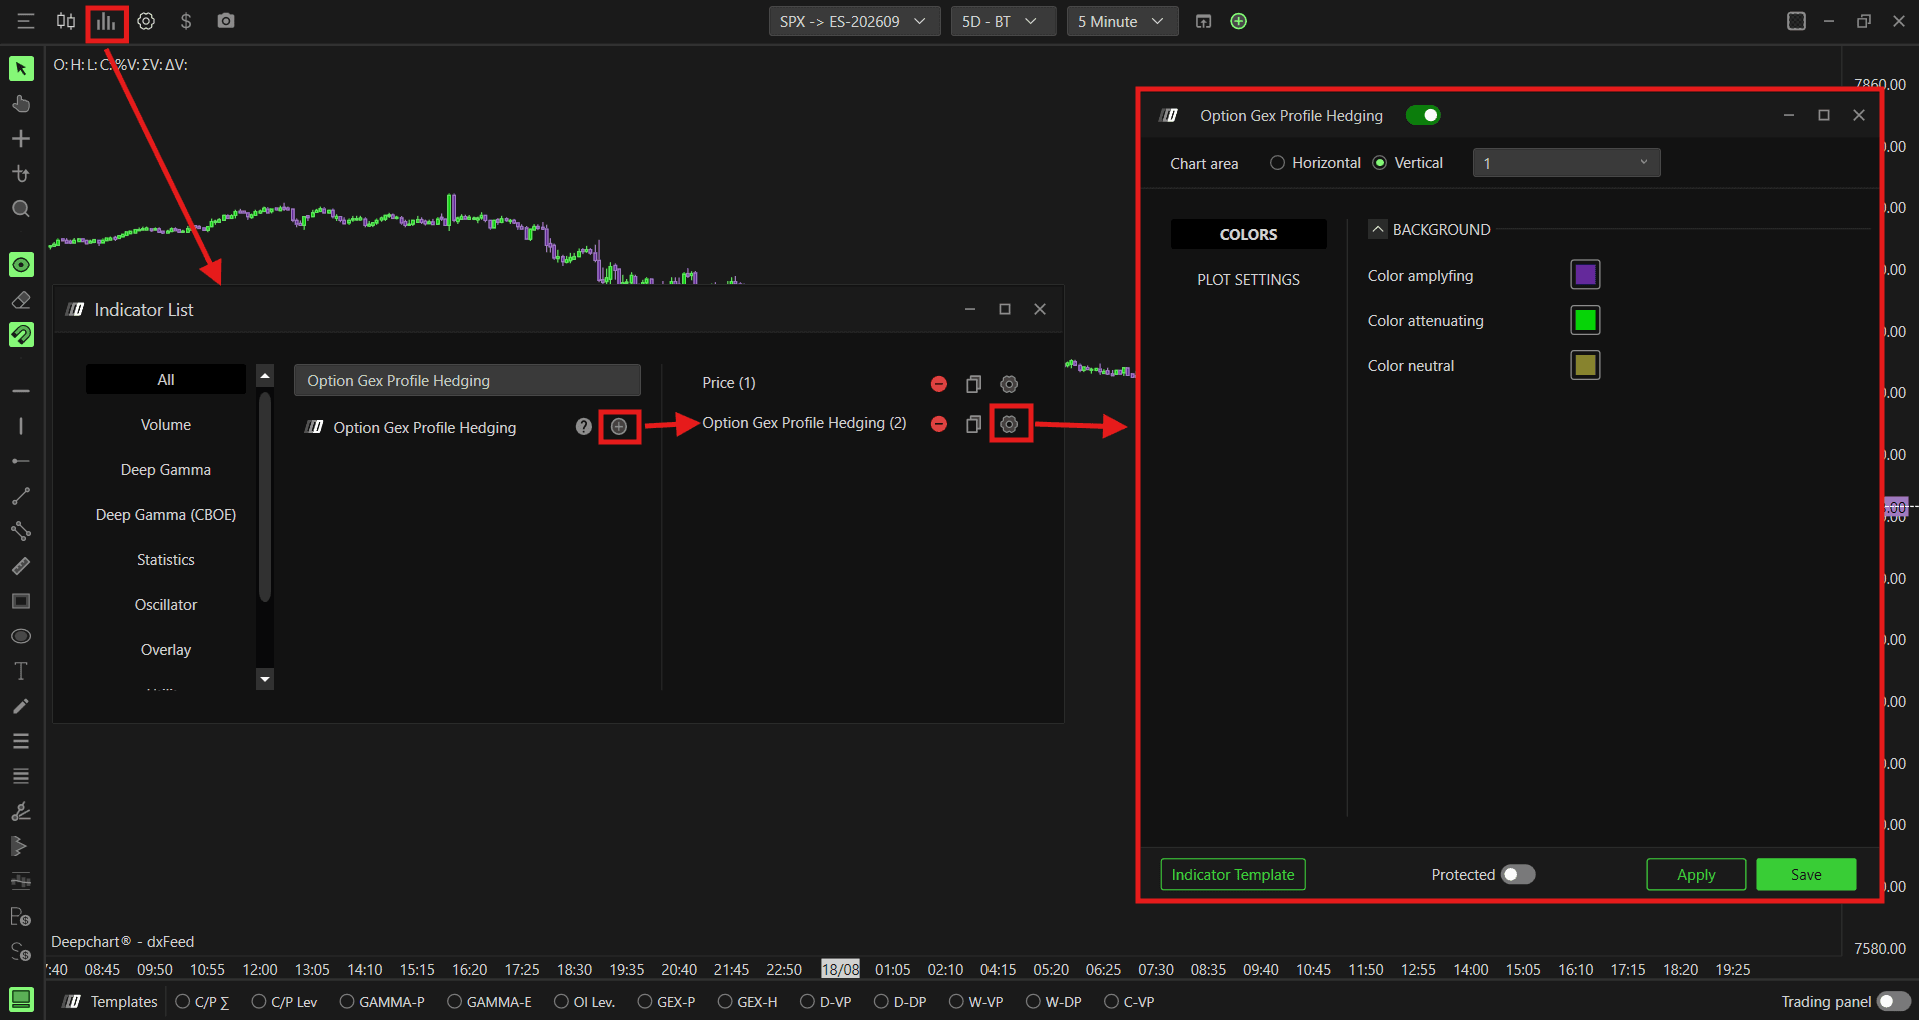
Once the Option Chart is loaded, click the Indicator Add button on the chart toolbar
Search for Option Gex Profile Hedging and click + to add it
Click the settings icon to open the configuration window
Understanding the Profile
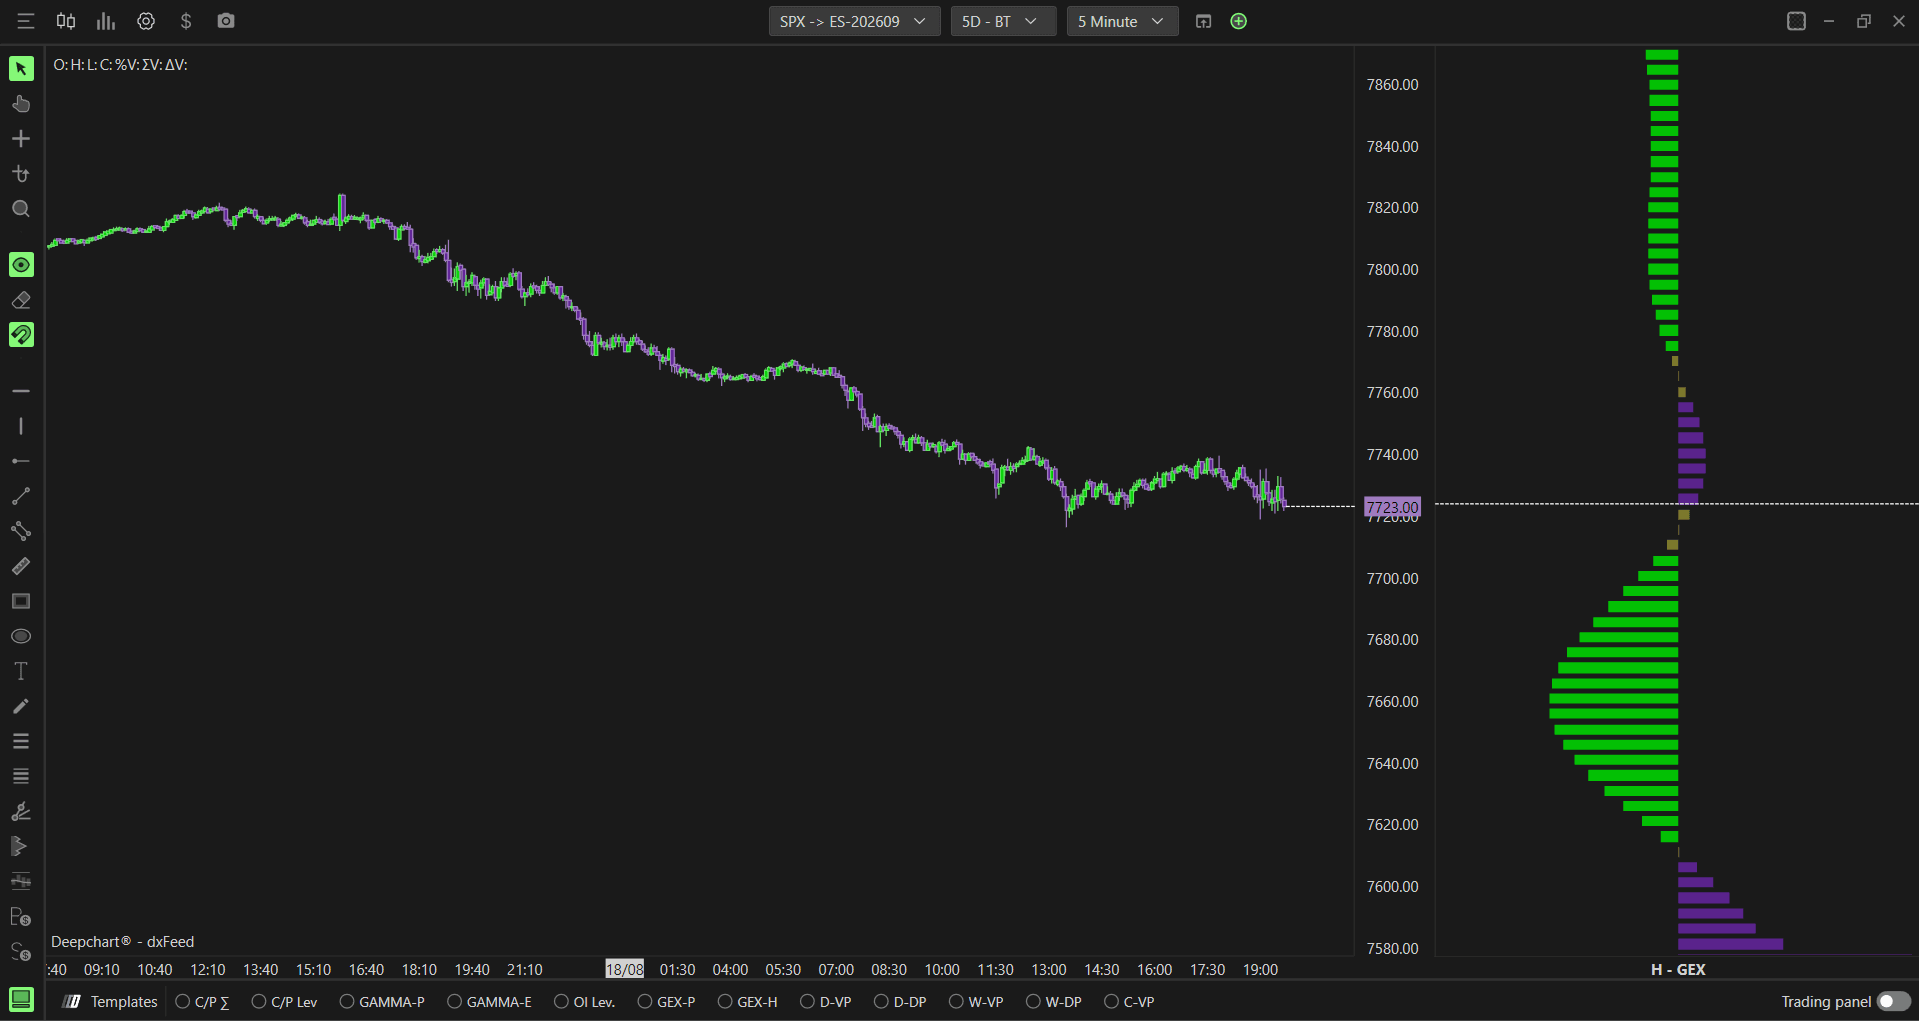
Unlike a standard GEX profile, which shows where dealer gamma exposure is concentrated, the Hedging profile shows how dealers are likely to react as price approaches each strike. At every strike, DeepChart evaluates the implied volatility and Greeks to estimate whether Market Maker hedging at that level would push price further in the direction it is already moving, or work against the move and slow it down.
Purple bars (amplifying) - Market Maker hedging at this level is likely to amplify the move. If price is falling and reaches this strike, dealer hedging may add further selling pressure. If price is rising and reaches this strike, dealer hedging may add further buying pressure
Green bars (attenuating) - Market Maker hedging at this level is likely to attenuate the move, working against it and slowing price down as it approaches the strike
Neutral (olive/yellow) - Strikes where the hedging impact is not clearly amplifying or attenuating
Understanding Key Terms
Before reading the profile, it helps to understand a few core options concepts:
Call - An option that gives the buyer the right to buy the underlying at a set price. Traders buy calls when they expect price to go up
Put - An option that gives the buyer the right to sell the underlying at a set price. Traders buy puts when they expect price to go down
Gamma - A measure of how much an option’s delta changes as price moves. High gamma means dealers need to hedge more aggressively as price approaches a strike
Implied Volatility - The market’s expectation of how much the underlying price will move, which directly affects options pricing and how aggressively dealers need to hedge
Greeks - A set of measures (including delta, gamma, and others) that describe how an option’s price and risk change as market conditions shift. The Hedging profile uses these together, not just gamma alone, to estimate dealer behavior
Settings
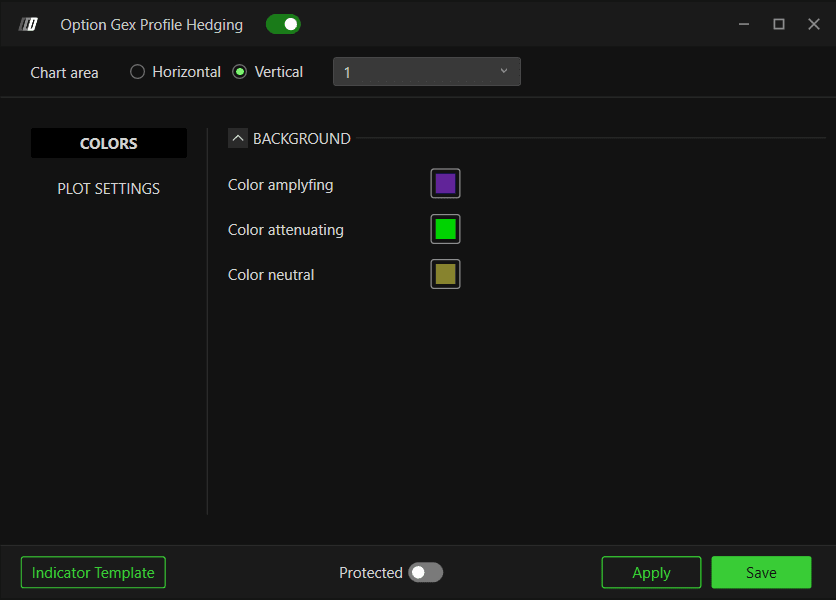
Colors
Color amplifying - Set the color for strikes where hedging is likely to amplify price movement. Default is purple
Color attenuating - Set the color for strikes where hedging is likely to attenuate price movement. Default is green
Color neutral - Set the color for strikes where hedging impact is neutral. Default is olive/yellow
Plot Settings
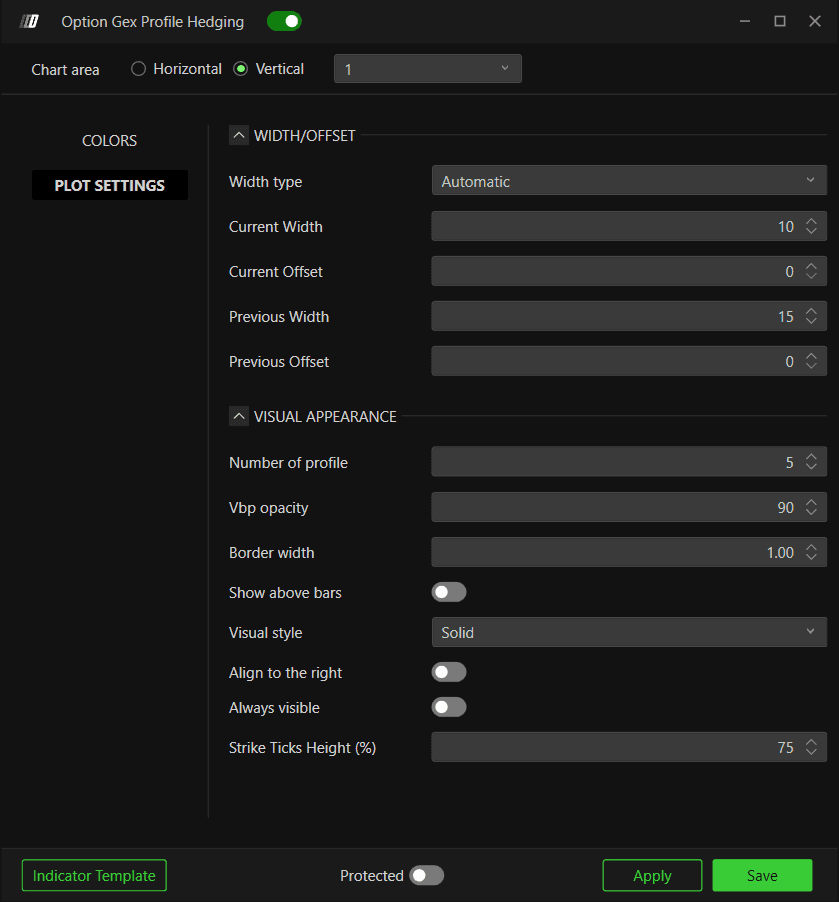
Width/Offset
Width type - Choose how the profile width is calculated. Options available:
Automatic (default) - DeepChart automatically sets the profile width based on the current chart view
Percentual period - sets the width as a percentage of the visible chart period
Window width - sets the width based on the current visible window
Fixed bars - sets a fixed number of bars for the profile width
Current Width - Set the width of the current session profile. Default is 10
Current Offset - Set the horizontal offset of the current session profile. Default is 0
Previous Width - Set the width of previous session profiles. Default is 15
Previous Offset - Set the horizontal offset of previous session profiles. Default is 0
Visual Appearance
Number of profile - Set how many session profiles are displayed on the chart. Default is 5
Vbp opacity - Set the opacity of the profile bars. Default is 90
Border width - Set the border width of the profile bars. Default is 1.00
Show above bars - When enabled, the profile is displayed on top of the price bars. Default is disabled
Visual style - Choose between Solid or Hollow profile bars. Default is Solid
Align to the right - When enabled, aligns the profile to the right side of the chart. Default is disabled
Always visible - When enabled, keeps the profile visible even when scrolling outside its range. Default is disabled
Strike Ticks Height (%) - Set the height of each strike’s bar as a percentage. Default is 75
Example - How to Use Option Gex Profile Hedging
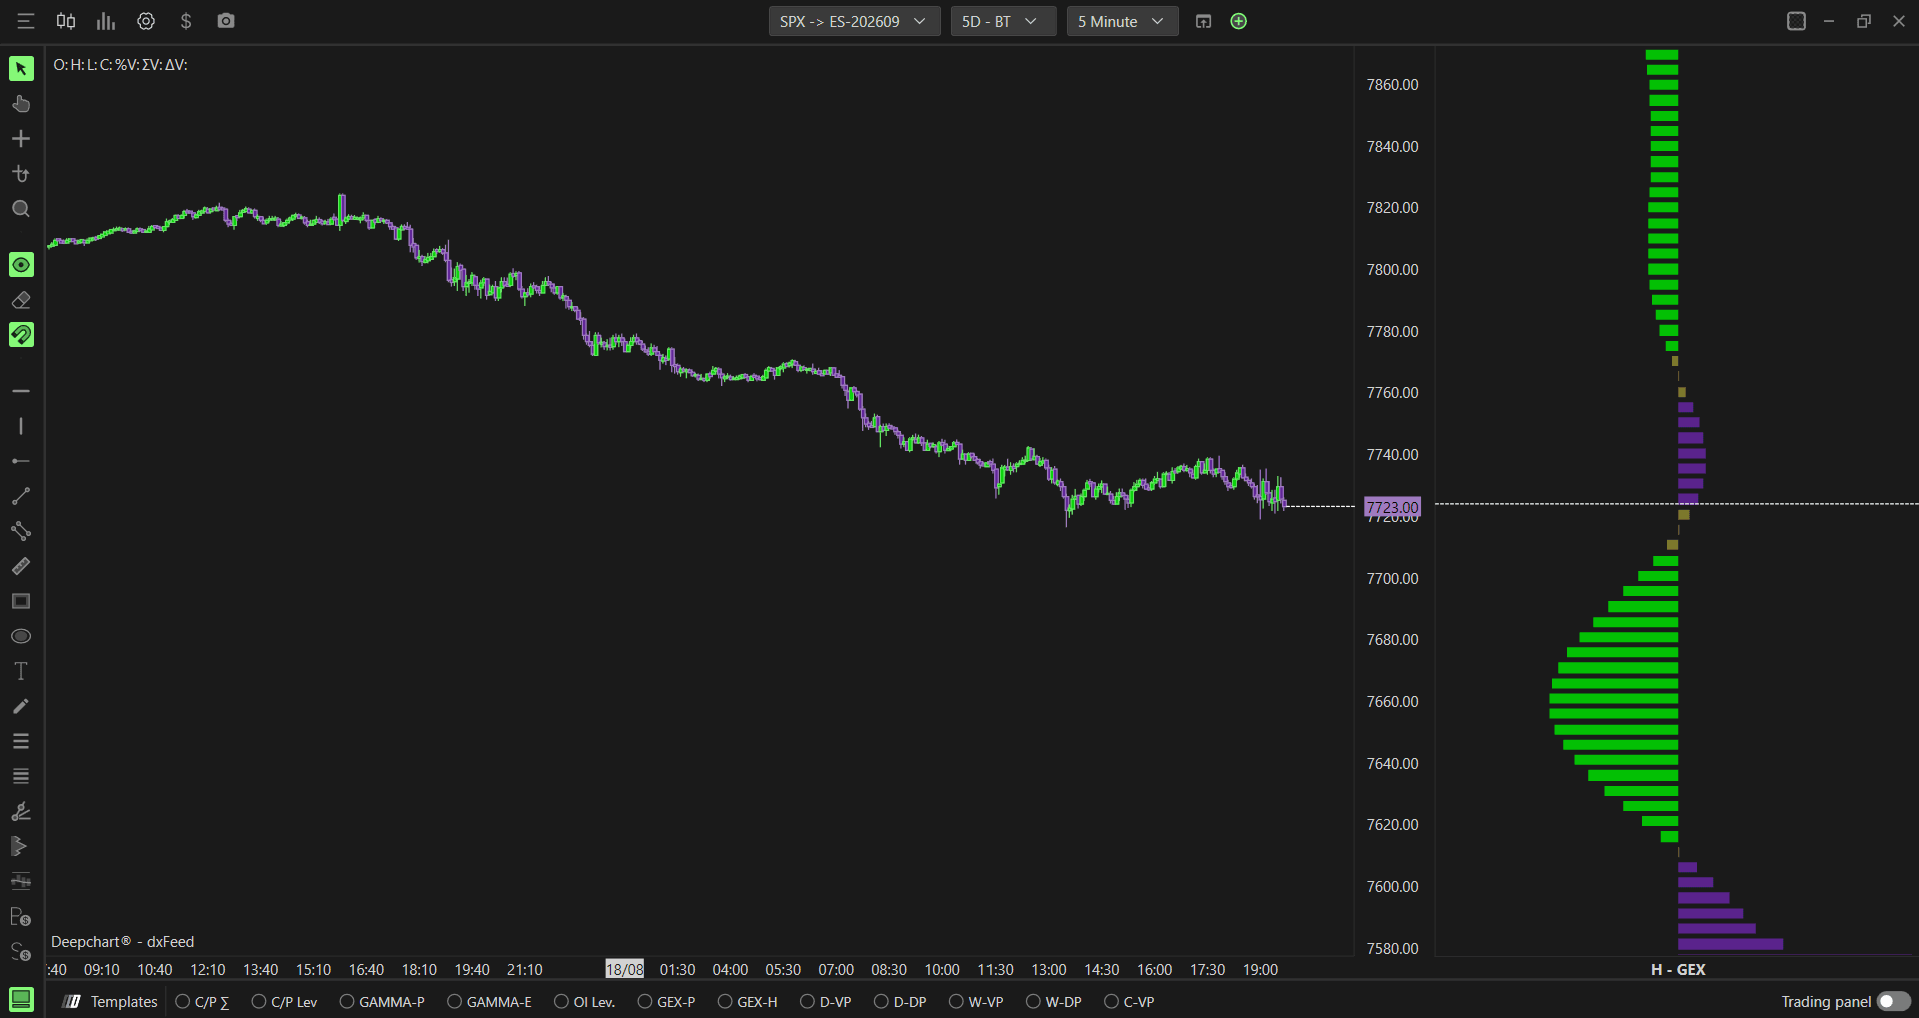
Once added to your chart, you will see a vertical profile with purple, green, and neutral colored bars at different strikes. Here is a simple way to use it:
If price is falling and approaching a strike with purple (amplifying) bars, be aware that dealer hedging may accelerate the decline as price reaches that level
If price is falling and approaching a strike with green (attenuating) bars, dealer hedging may slow the decline and offer some support
The same logic applies on the upside. Purple strikes above price suggest hedging could accelerate a rally, while green strikes suggest hedging could cap or slow it
Combining with other GEX profiles
You can place the Hedging profile side by side with Option Gex Profile (Market Maker) and Option Gex Profile (Volume based) on the same chart for a fuller picture:
H - GEX (Hedging) tells you whether dealer hedging at a strike is likely to amplify or attenuate a move
GEX (MM) tells you where real market maker gamma exposure is concentrated
GEX (Vol) tells you where the classic volume based gamma exposure is concentrated
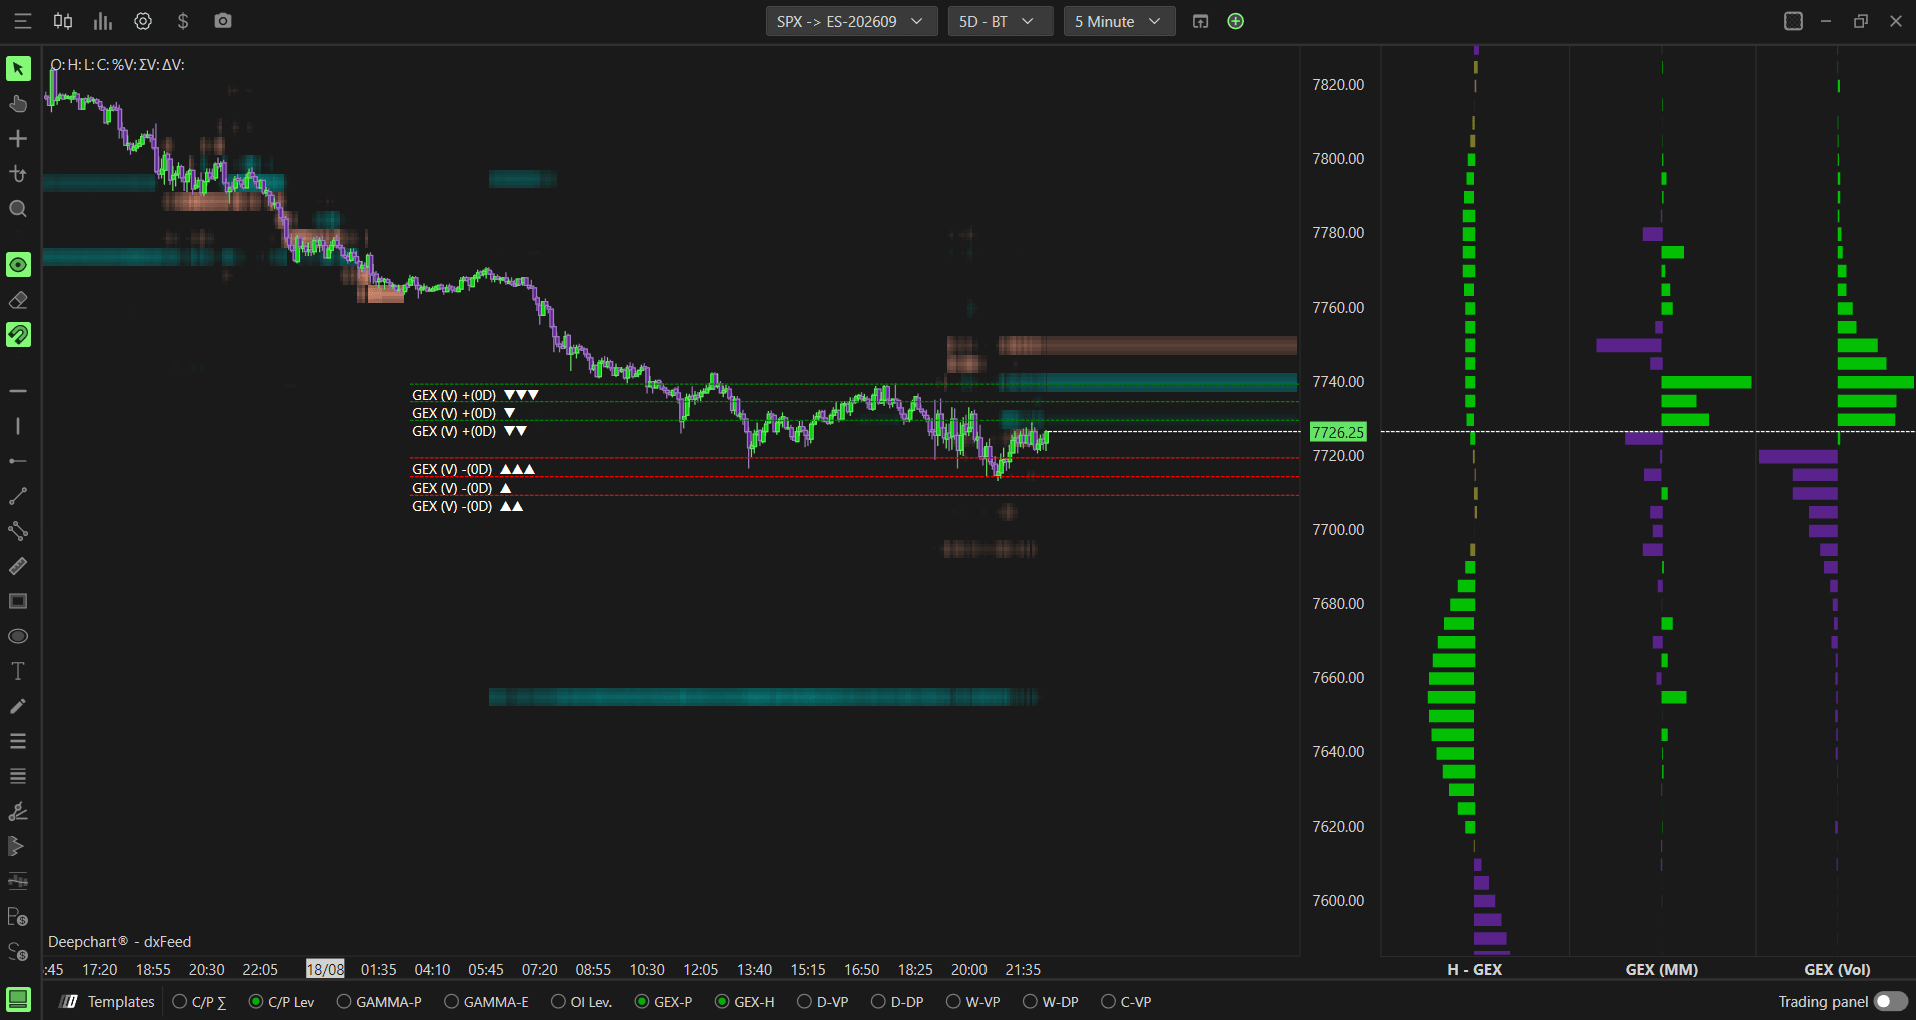
When a strike shows strong exposure on both GEX (MM) and GEX (Vol), and also shows purple (amplifying) on the Hedging profile, that level carries more weight since dealer positioning and hedging behavior are lining up in the same direction. If the same strike shows green (attenuating) instead, it suggests the level may act as a brake on the move rather than accelerating it, even though dealer exposure is concentrated there.
Any Questions?
Our support team is available 24/7 and ready to help you with any question.
When reaching out, please include:
Screenshot (if any)
Briefly describe the assistance or support you require
DeepCharts Live Support - Chat with our agents directly using the live chat box on www.deepcharts.com, or click here for 24/7 Live Chat for immediate access.
Email Support - Reach us at support@deepcharts.com - please note that email responses may take a little longer than a live support chat.
