General
Updated:
Manage Indicators / Indicator Lists
To see / manage current Indicators or to see full Indicator List, click on the bar graph icon on the top left (See Image).
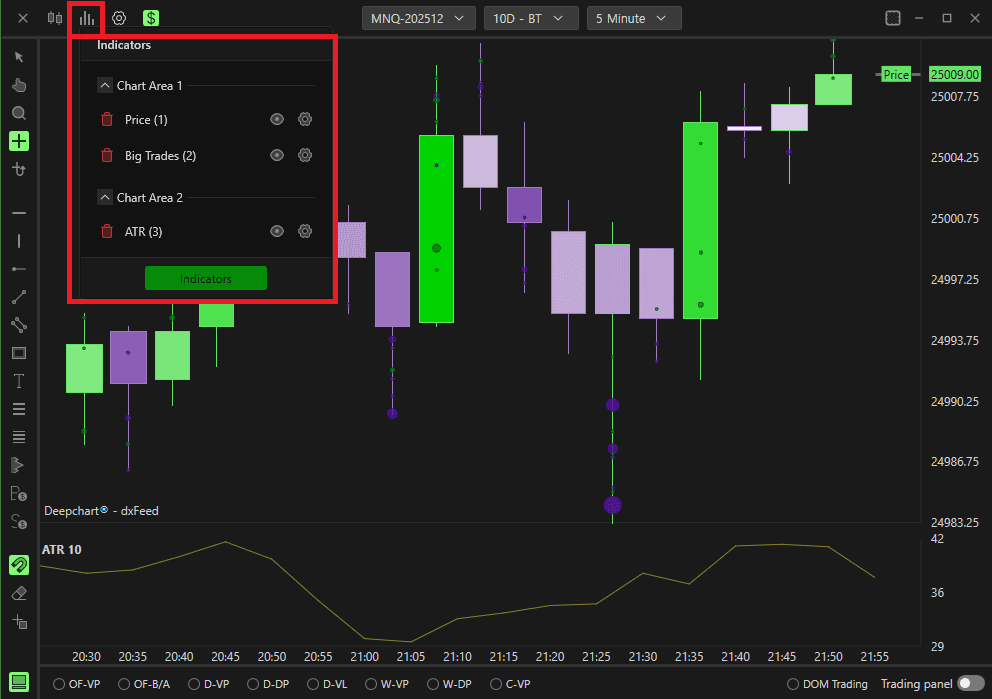
You can remove current indicator by clicking on the recycle bin icon
You can hide the indicator by clicking on the eye icon
You can change the settings of the indicator by clicking on the gear icon
Chart Area defines where the indicators are placed on the price chart
On the Price Chart, you can change the size of the chart area by clicking on the line where area is divided and dragging.Click on Indicators to see full Indicator List
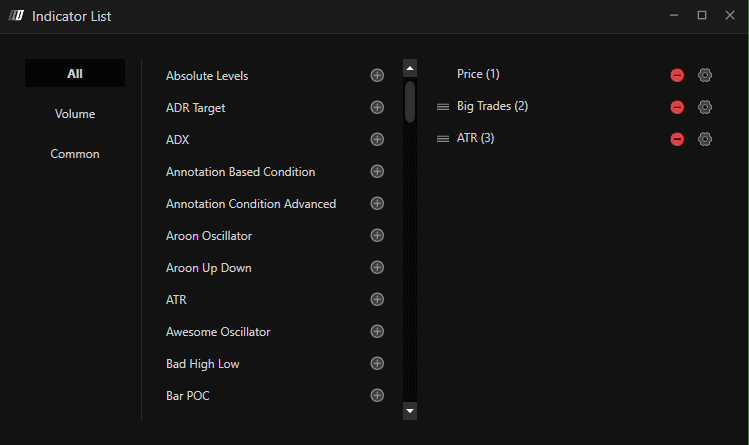
In the Indicator List, you can add preferred indicator by clicking on + button. Added Indicator will show on the right side.
You can remove the added indicator by clicking on - button on the right panel.
You can change the settings of the added indicator by clicking on the gear icon
You can change the order of the indicator by dragging three line icon upward or downward.
Indicator Toolbar (Preset Indicators)
Each chart has a Toolbar in the lower left corner, in which some volumetric indicators are already preset and can be enabled in a very simple way.
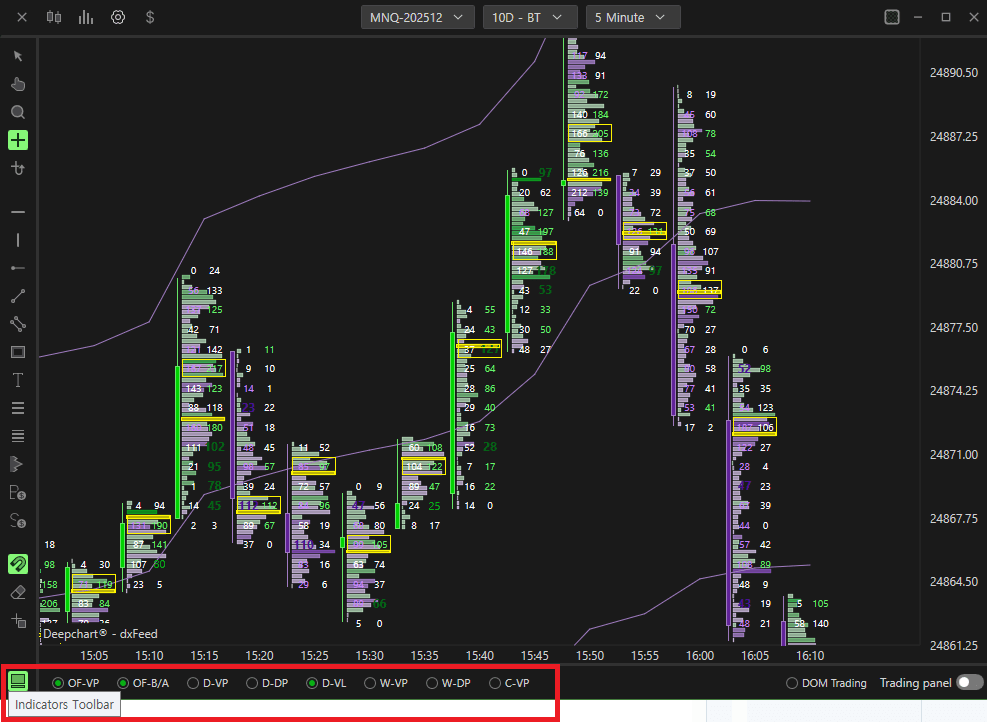
OF-VP: Order Flow Volume Profile
OF-B/A: Order Flow Bid / Ask
D-VP: Daily Volume Profile
D-DP: Daily Delta Profile
D-VL:
W-VP: Weekly Volume Profile
W-DP: Weekly Delta Profile
C-VP: Composite Volume Profile
Navigation on Price Chart
X-Axis
To move the X-axis, simply make a scroll with the cogwheel of the mouse, alternatively click with the left button of the mouse on the timeline and drag.
Auto Scroll : Right click on x-axis to set auto scroll which when enabled, the price will advance automatically as the bars advance.
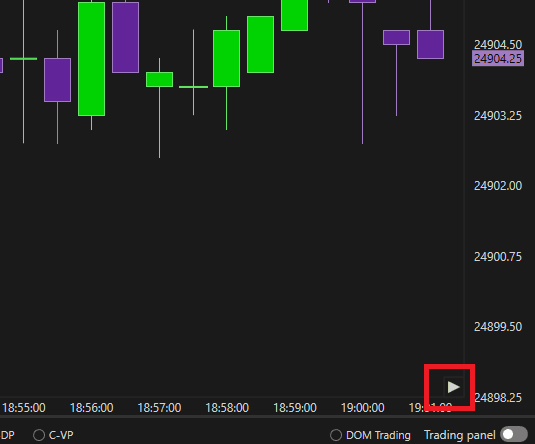
Double click or press play button on the bottom right (see image) to return the chart to the current bar (latest bar).
Y-Axis
Auto Scroll: Right click on y-axis to set auto scroll which when enabled, the axis will follow the price if out of the current chart's view.
Moving Y-Axis: Right click to see settings.
Param Type
Automatic Detection:
If you position yourself in the chart part of the Y-axis, pressing with the left button of the mouse you will be able to move the axis, while if you position yourself at the axis where prices are shown, up or down, you will be able to resize its size.Move Axis Range:
Pressing with the left button of the mouse anywhere on the Y-axis (both chart and the price) will move chart up or down.Resize Axis Range:
Pressing with the left button of the mouse anywhere on the Y-axis (both chart and the price) will resize price ranges.
Annotations (Drawings)
You can right click on the chart to view/manage annotation tools
For shortcut, you can find annotations on the left end of the price chart.
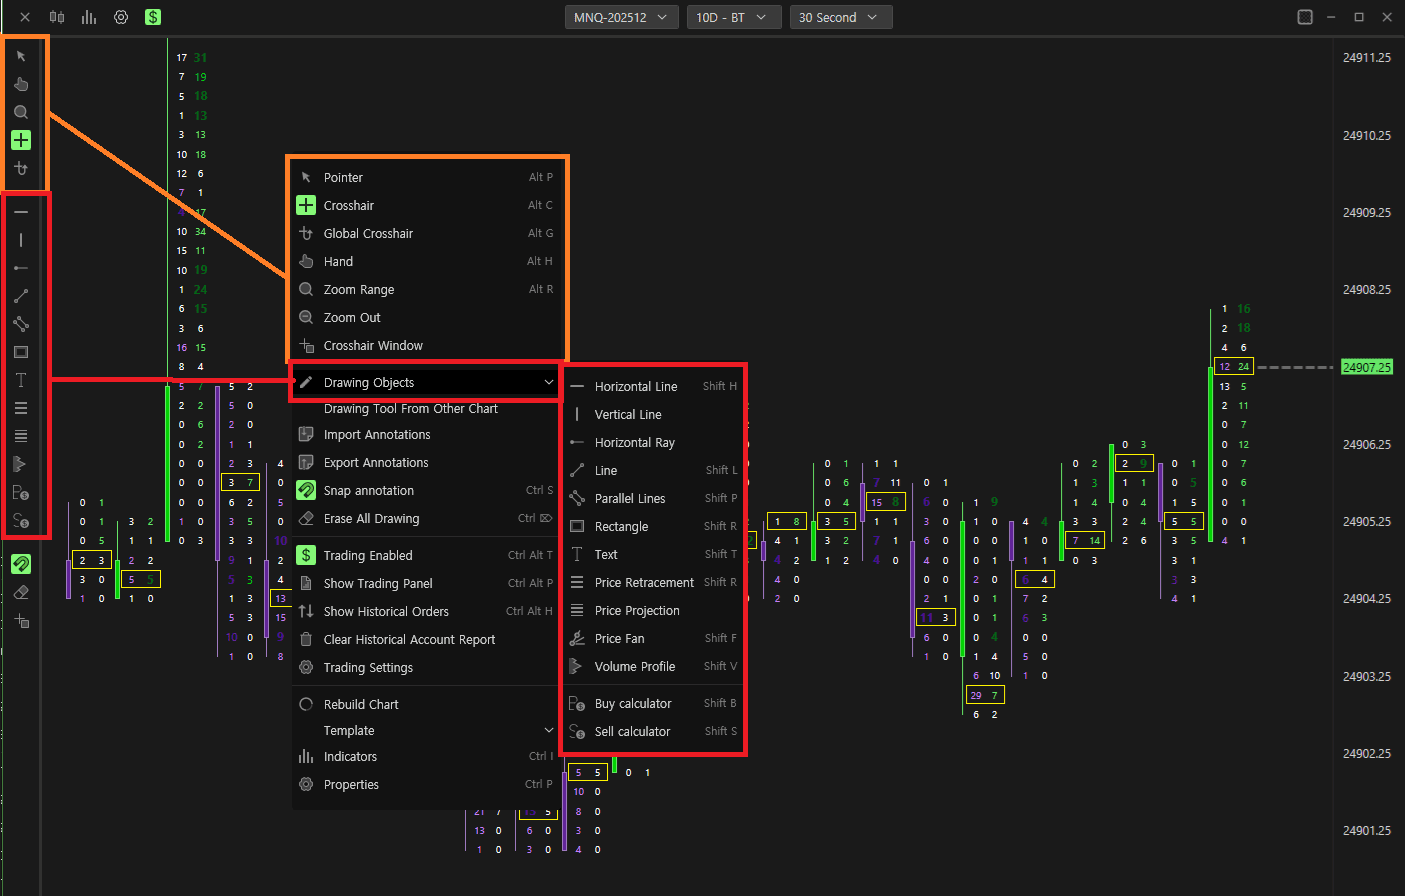
Pointer
Enable Pointer (default)
Scope
Enable Crosshair
Global Viewfinder
Enable the crosshair global
ability to simultaneously see the crosshair on all graphs of the same instrument present in the work plan
Hand
Allows you to move the chart vertically and horizontally by clicking on the chart itself with the left button of the mouse.
Zoom Range
Allows you to zoom in on a section you want. Left Click the start and Left Click the end section of the zoom.
Zoom Out
Reset Zoom Range
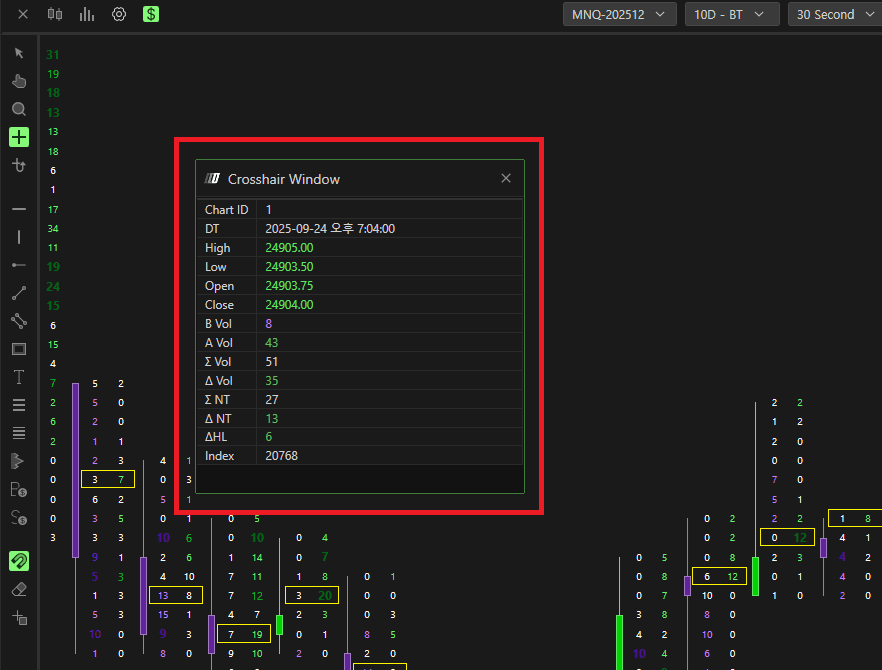
Crosshair Window
Opens Crosshair Window.
Crosshair Window shows where you can see the details of where your crosshair is and range of information for each bar where you point the crosshair to it, such as High, Low, Open and Close or summation volume and summation trades (see image)
Drawing Objects
Horizontal Line
Vertical Line
Horizontal Radius
Line
Parallel lines
Rectangle
Text
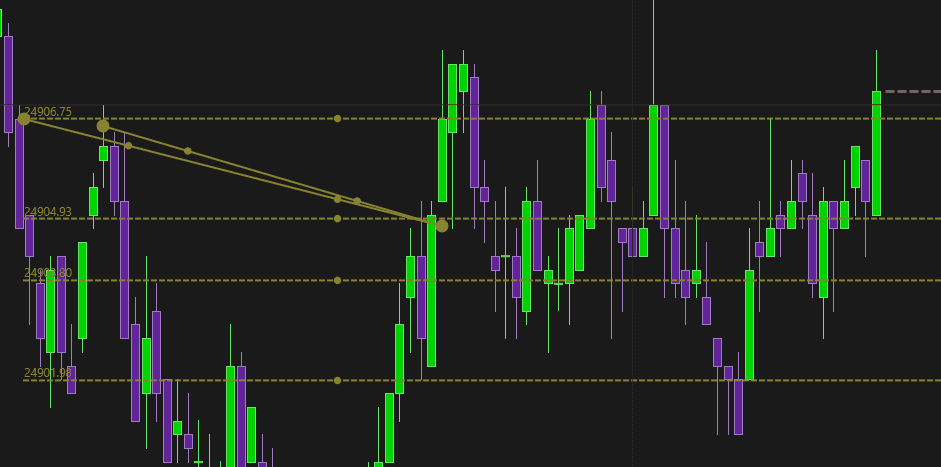
Price Retracement (Fibonacci Retracement)
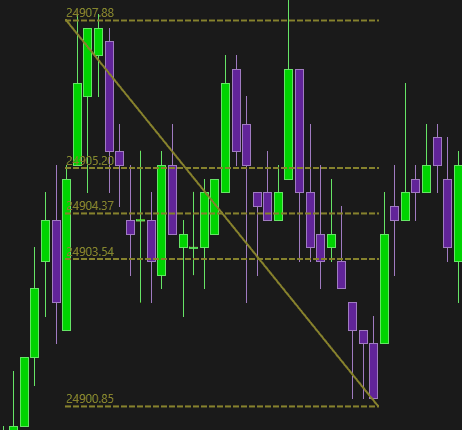
Price Projection (Fibonacci Projections)
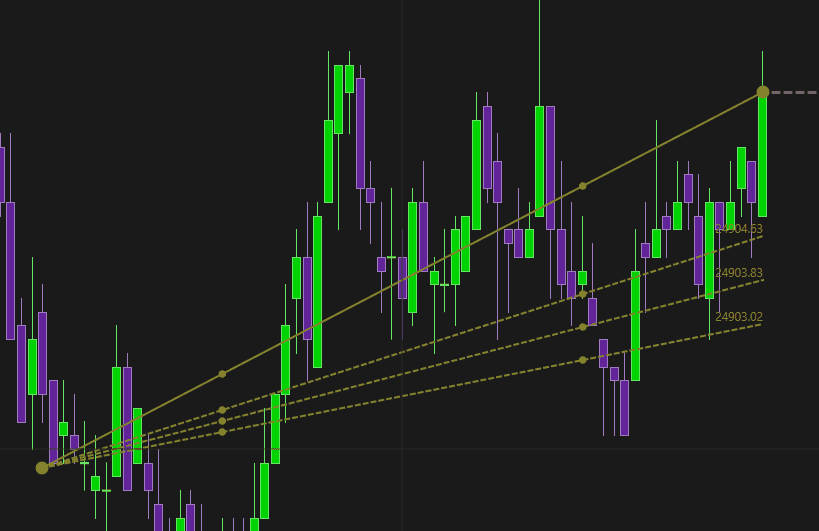
Price Fan
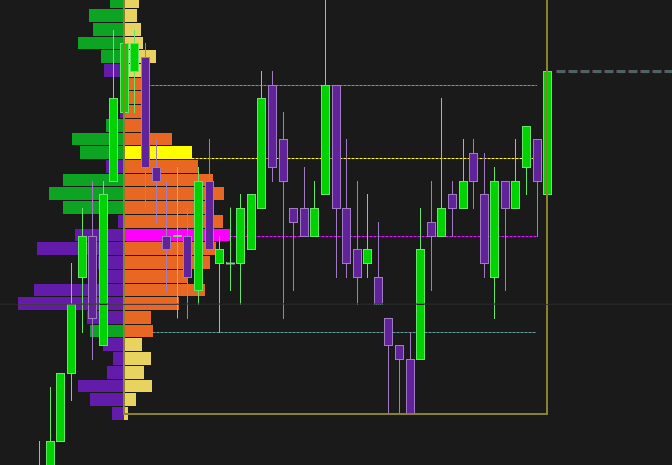
Volume Profile: Creates Volume Profile on your preferred section
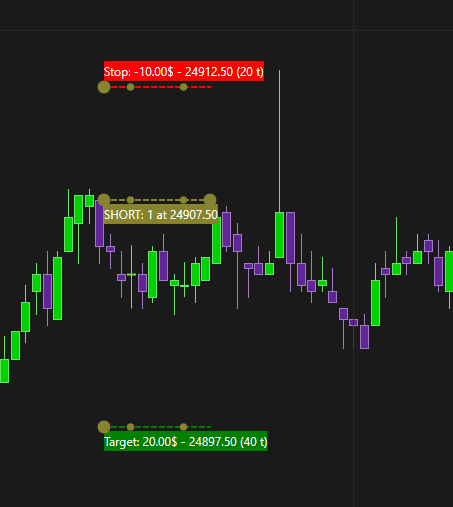
Buy Calculator
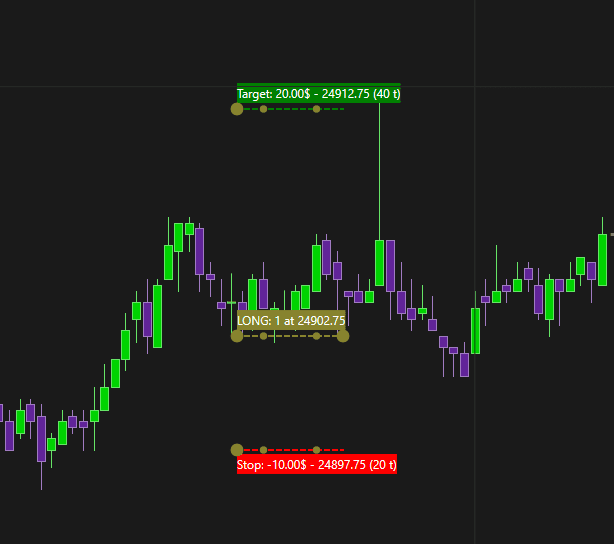
Sell Calculator
Drawing Object Settings
Annotation Settings
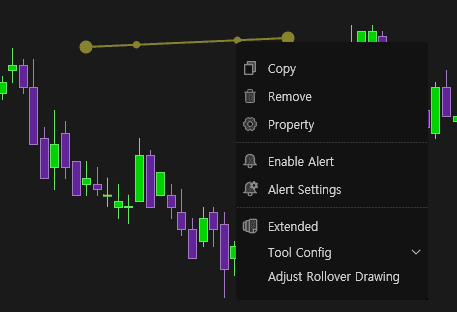
To open the drawing objects' settings, left click on the drawing and when you are scoped to the drawing, you can right click to open Settings. Go to Property to open Annotation Settings
You can also double left click to open Annotation Settings
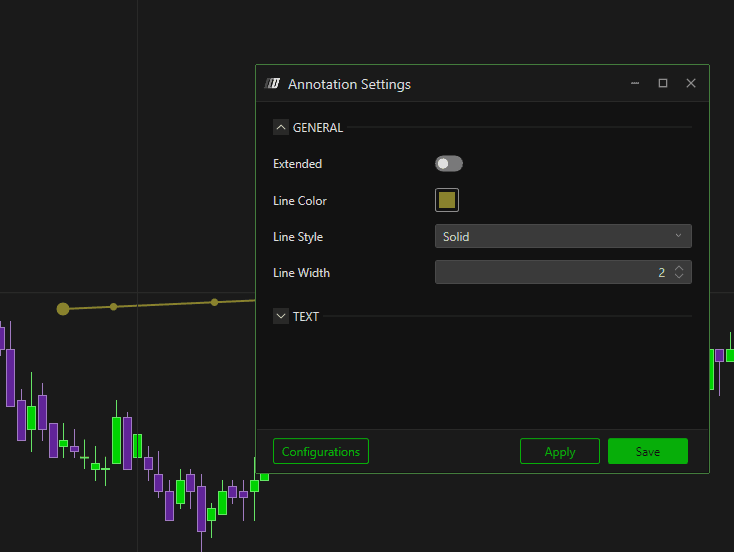
You can change colors and styles in Annotation Settings.
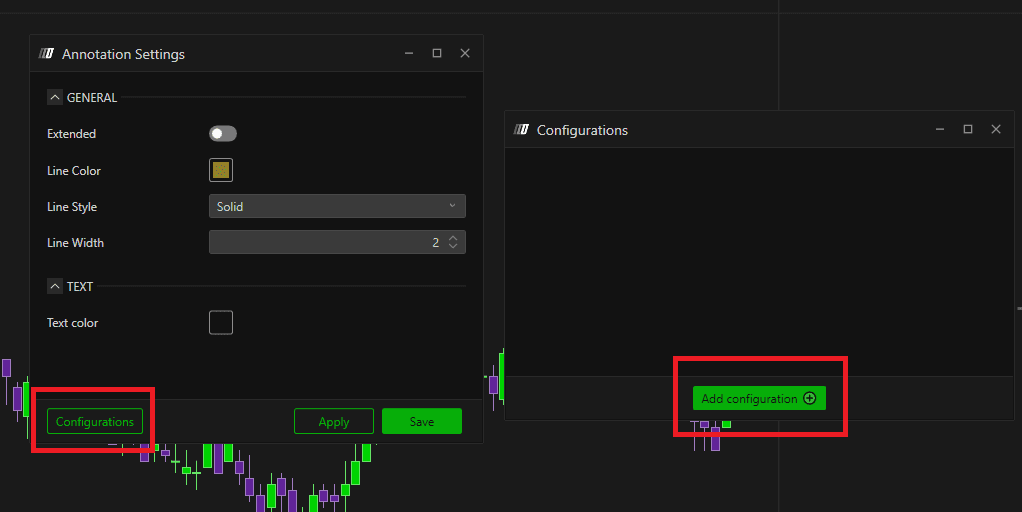
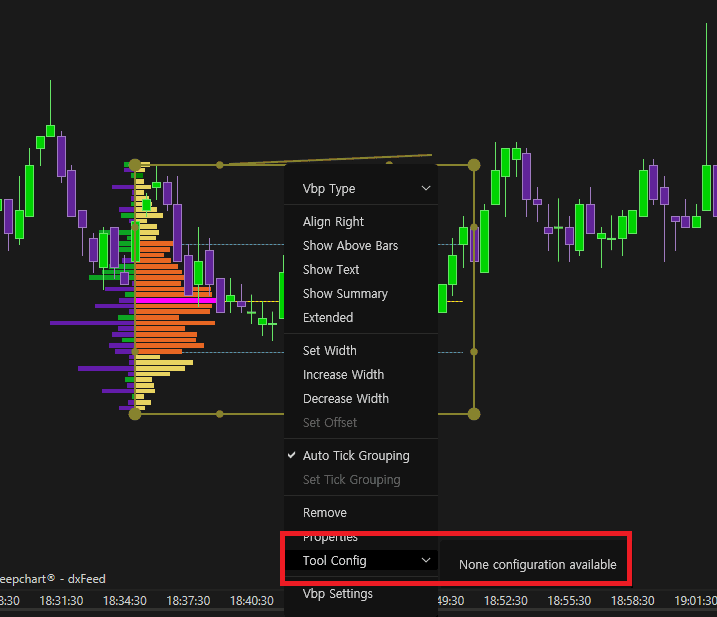
Annotation Configurations
Once you have set your settings, you can save the configurations for future uses.
You can recall the configuration by clicking and right click on the drawing and opening Tool Config
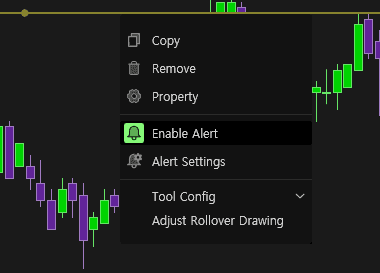
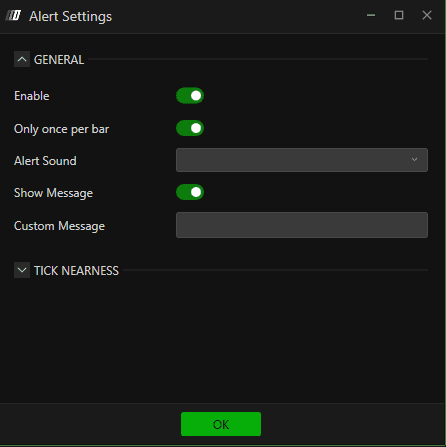
Alert
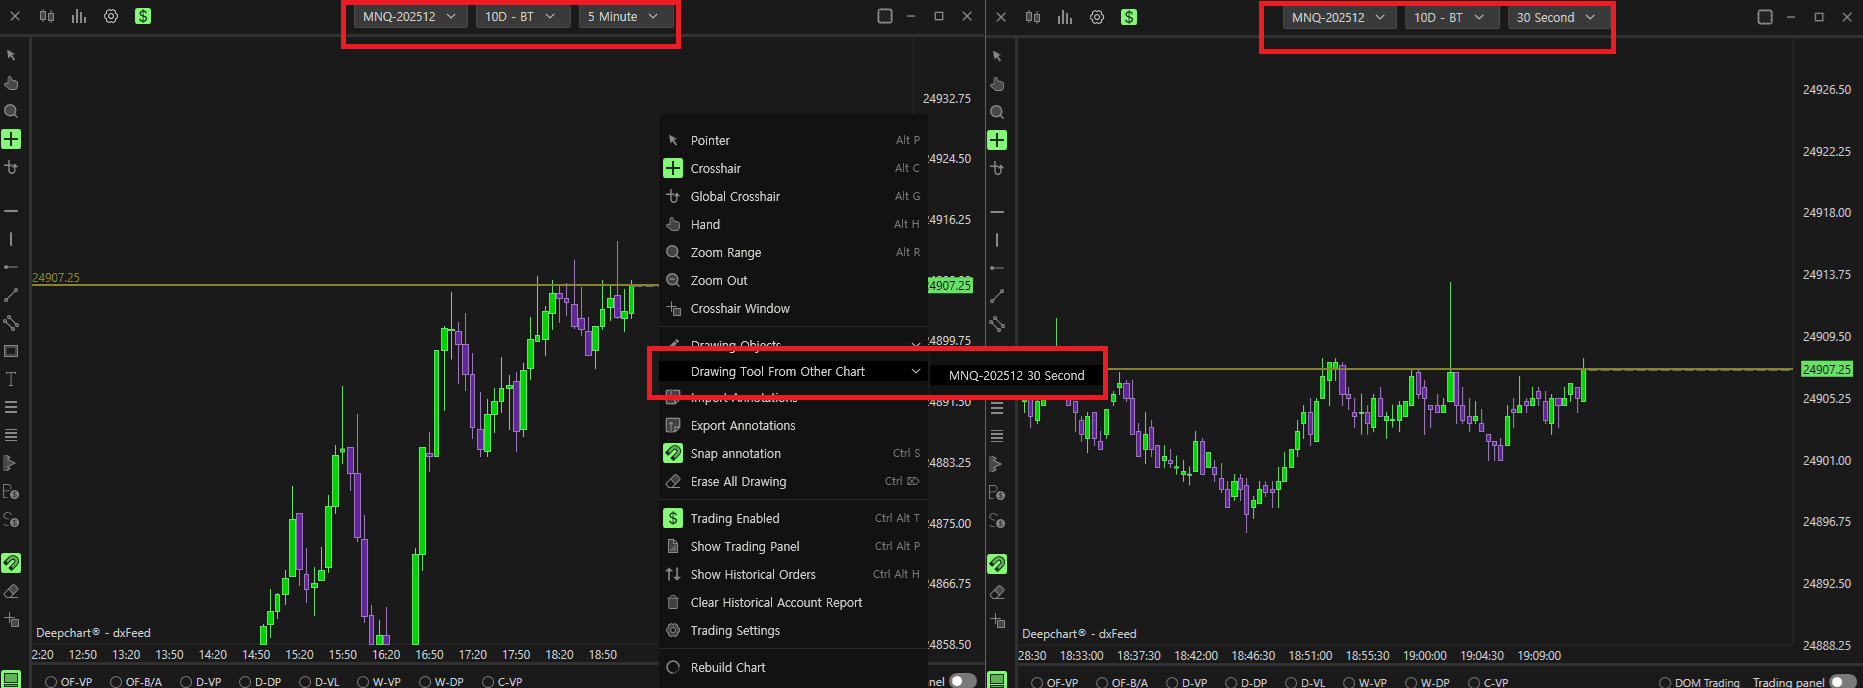
Drawing Tools From Other Chart
You can bring in the same drawings from other chart
Import/Export Annotation
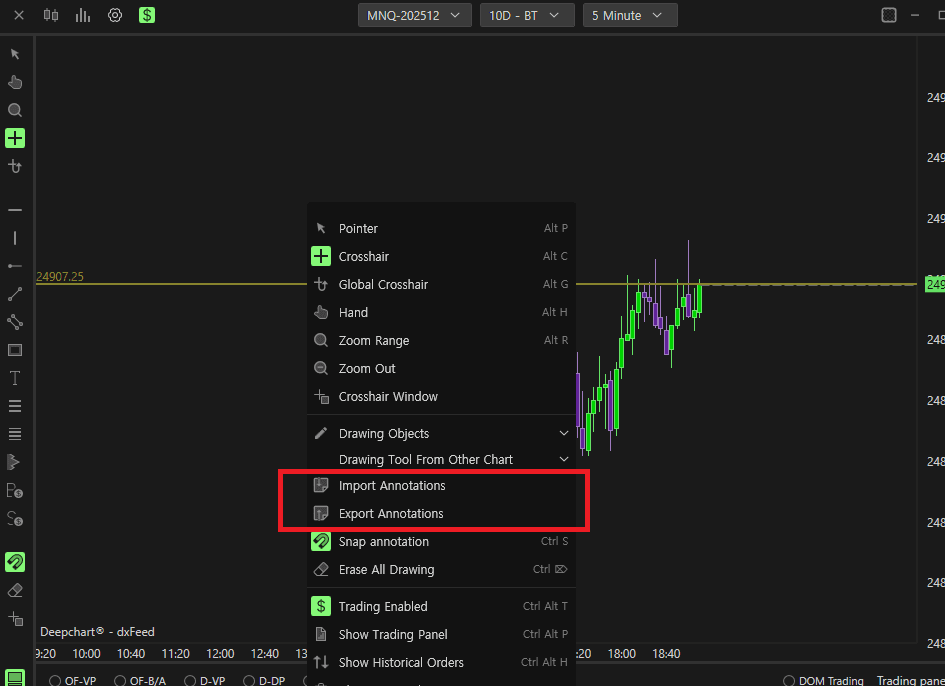
You can import / export annotation with saved files.
Rebuild Chart
Reload the chart.
Template
You can Load / Save the whole Price Chart Template
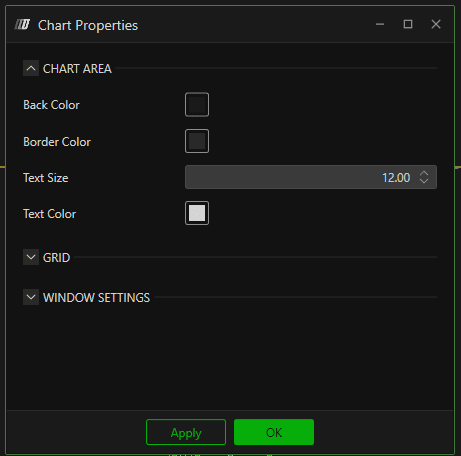
Properties
You can change the colors (i.e. background), size, and name of the chart window