Indicators
Updated:
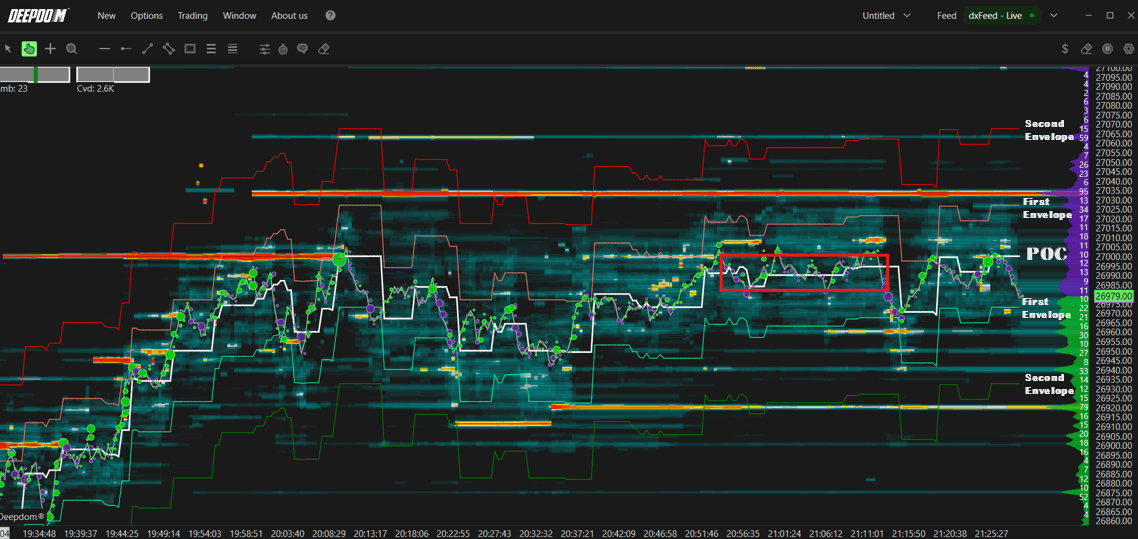
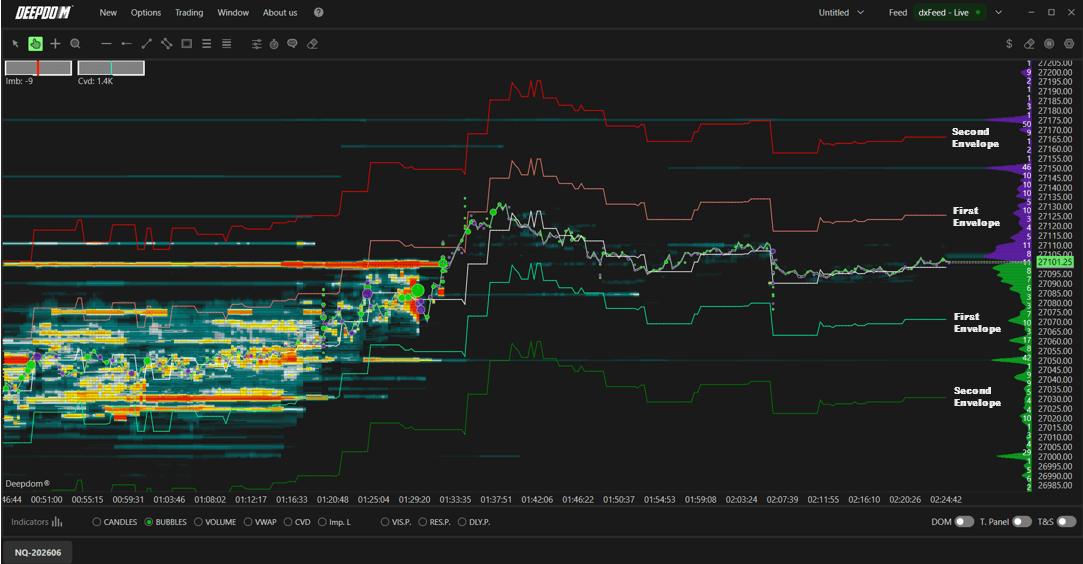
The POC Dynamic indicator displays the Point of Control (POC) — the price level where the highest volume has been traded — calculated on a rolling basis over the last n minutes. In addition to the POC line itself, it allows you to plot standard deviation bands above and below it, helping you contextualize how far price is straying from the most active volume level in real time.
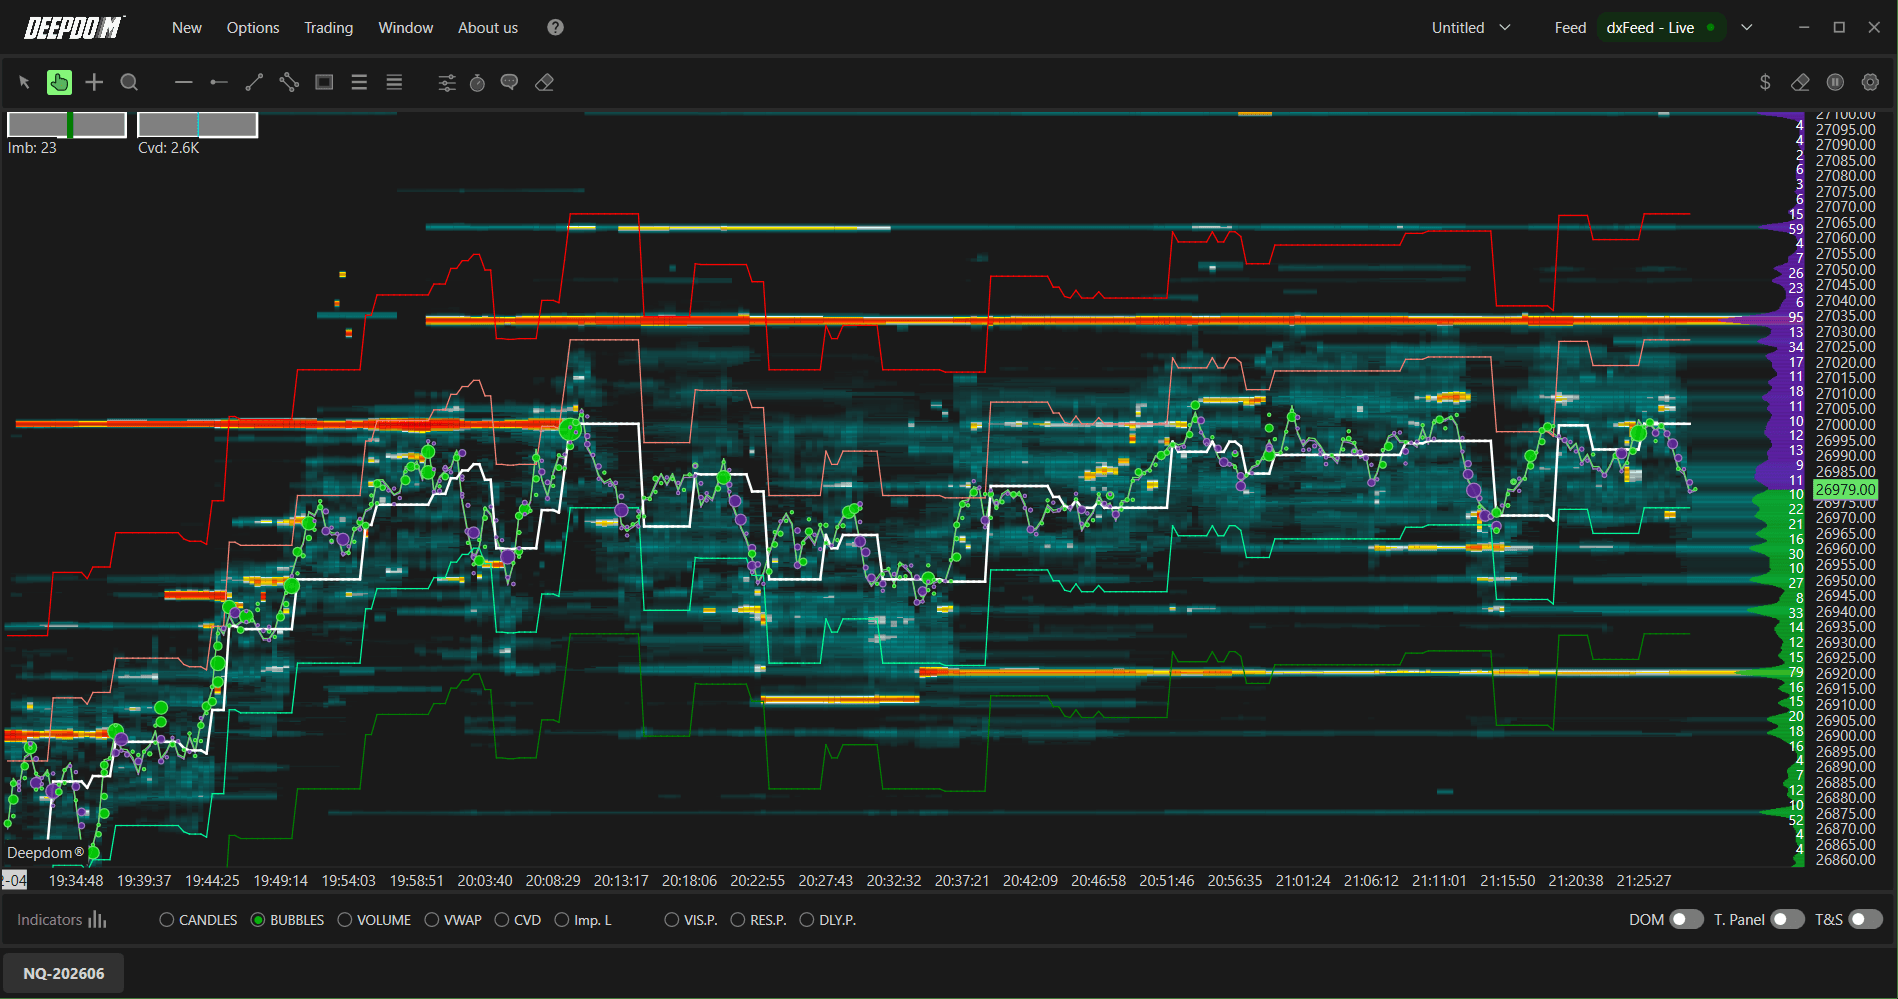
What is the Point of Control (POC)? Imagine all the trading activity that happened over a period of time laid out across different price levels. The POC is simply the price level where the most buying and selling took place. It acts like a magnet — price tends to gravitate back toward it because it represents the area where the market found the most agreement between buyers and sellers. Traders watch the POC closely as a key reference point for fair value.
How to Add POC Dynamic to Your Chart
Click the Indicators icon on the chart
Find POC Dynamic in the list and click + to add it
Click the settings icon on the indicator to open its configuration window
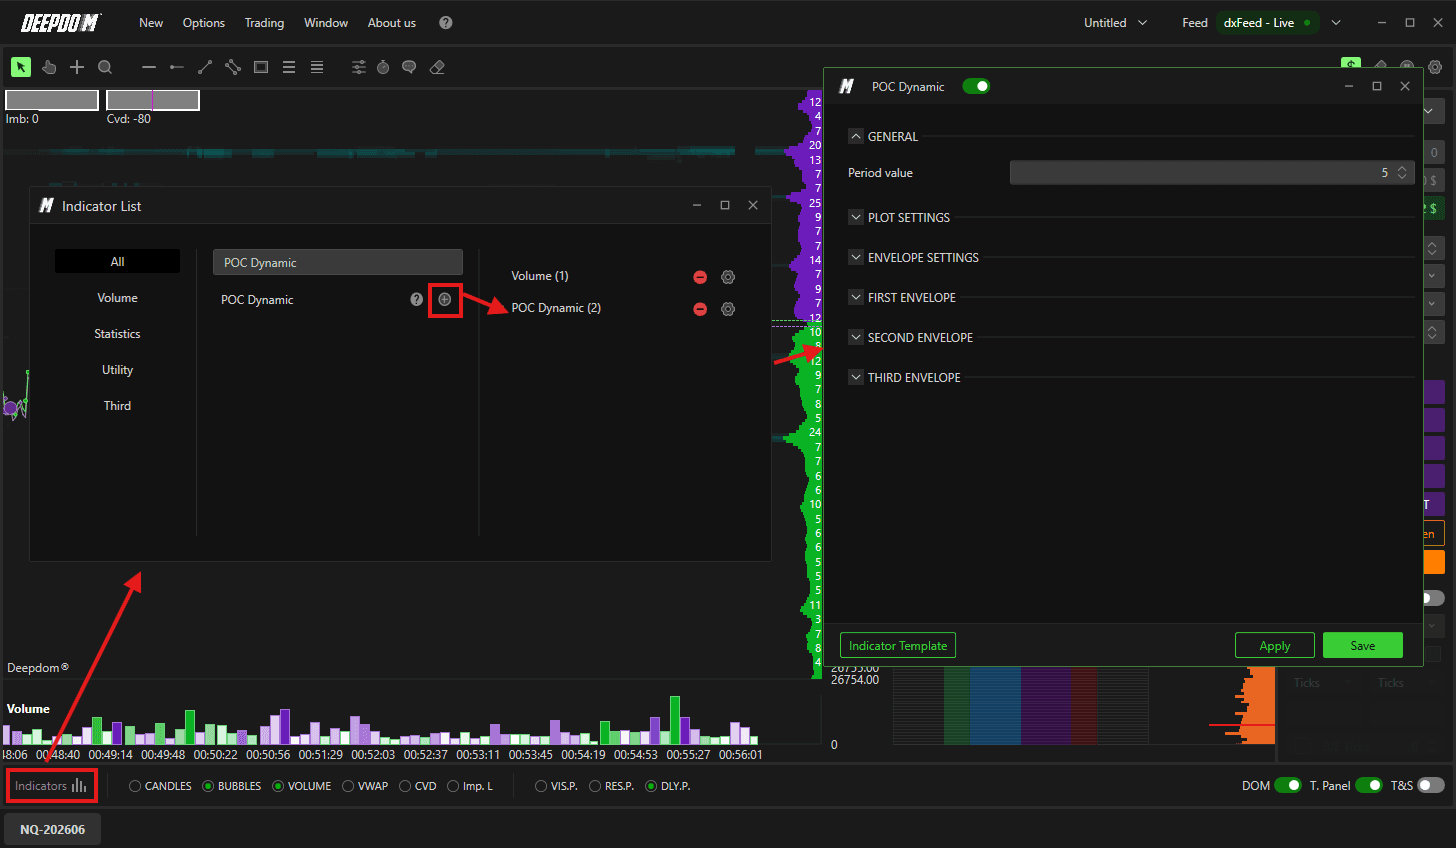
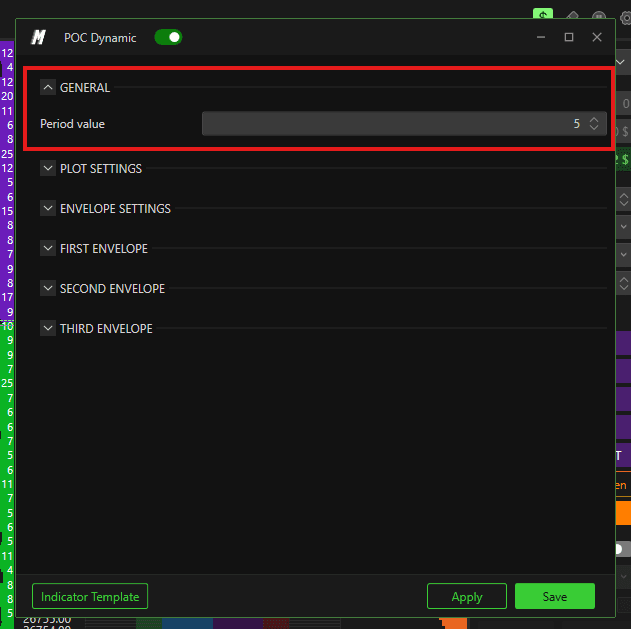
General Settings
Period Value Defines the number of minutes used to calculate the POC. For example, setting this to 5 means DeepDom will continuously calculate the POC based on the last 5 minutes of volume data, updating it in real time as new data comes in. A shorter period makes the POC more reactive to recent activity, while a longer period gives a broader, more stable view of where volume has been concentrated.
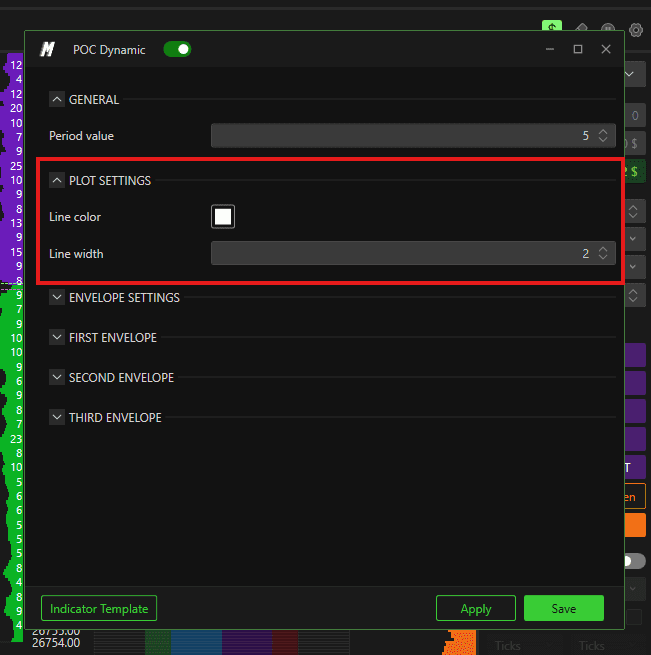
Plot Settings
Defines the visual appearance of the POC line:
Set the color of the POC line
Set the thickness of the POC line
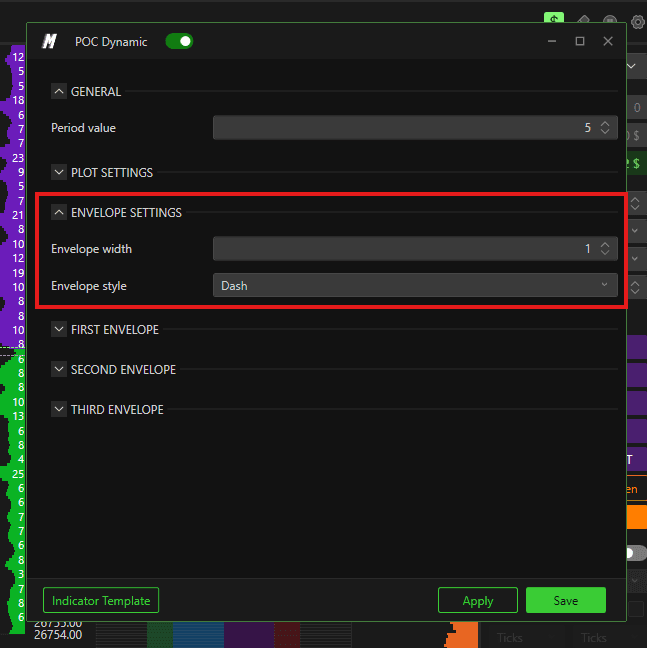
Envelope Settings
Defines the appearance of the standard deviation bands plotted around the POC:
Set the thickness of the bands
Set the line style of the bands — for example solid, dashed, or dotted
What are Standard Deviation Bands? Standard deviation bands are lines plotted above and below the POC that show how far price is moving away from the most active volume level. Think of them as zones of distance from fair value. When price is inside the first band, it is relatively close to fair value. When price reaches the second or third band, it is moving further into territory that is statistically less common — which can signal that price is overextended and may be due for a pullback toward the POC.

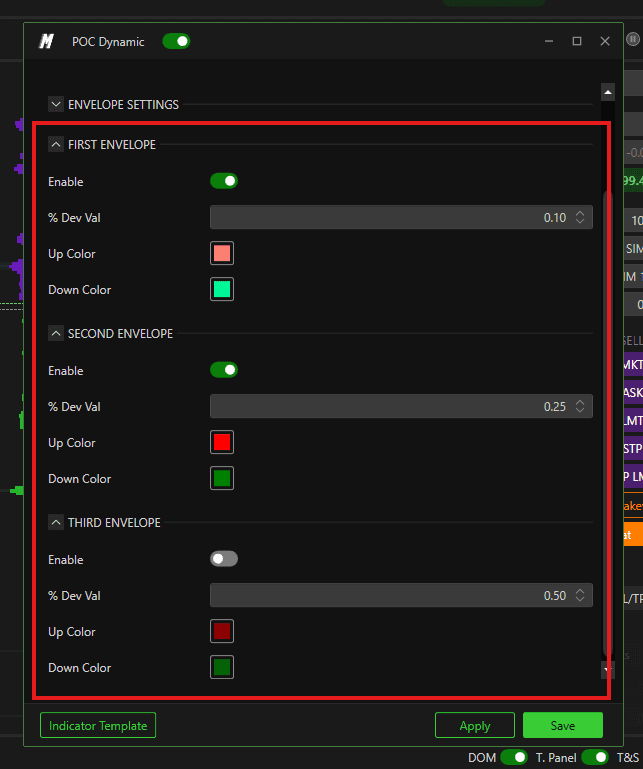
First, Second & Third Band
Each of the three standard deviation bands can be individually configured:
Enable or disable each band independently
Set the standard deviation value for each band
Set a custom color for each band
You can choose to display only the bands relevant to your analysis — for example enabling just the first band while leaving the second and third off. This keeps the chart clean and focused on what matters most to your trading style.
Conclusion
The POC Dynamic indicator gives you a continuously updated view of where the market has concentrated the most volume over a rolling time window. Combined with the standard deviation bands, it provides a dynamic framework for identifying fair value and spotting when price is moving into extended territory relative to recent volume activity.
Still Having Trouble?
Our support team is available 24/7 and ready to help you with any issue you encounter.
When reaching out, please include:
A screenshot of the issue
A brief description of what you were trying to do
Support Ticket (Fastest Response) Visit www.deepcharts.com and create a support ticket directly on our website.
Email Support Reach us at support@deepcharts.com — please note that email responses may take a little longer than a support ticket.