Indicators
Updated:
The Spread Bid/Ask indicator measures and plots the distance between the best bid and best ask prices (the bid–ask spread) in ticks. It helps you see when liquidity conditions change – for example, when spreads suddenly widen during low liquidity or high volatility and can generate alerts when the spread exceeds a level you define.
1. Concept: Bid–Ask Spread
In every market there is a bid – the highest price buyers are currently willing to pay – and an ask (or offer) – the lowest price at which sellers are willing to sell. The bid–ask spread is the difference between these two prices and represents both a transaction cost and a direct measure of market liquidity.
Narrow spreads usually indicate a liquid, competitive market where it is easy to enter and exit positions, while wide spreads often occur in thin or highly volatile conditions and imply higher execution risk for market orders.
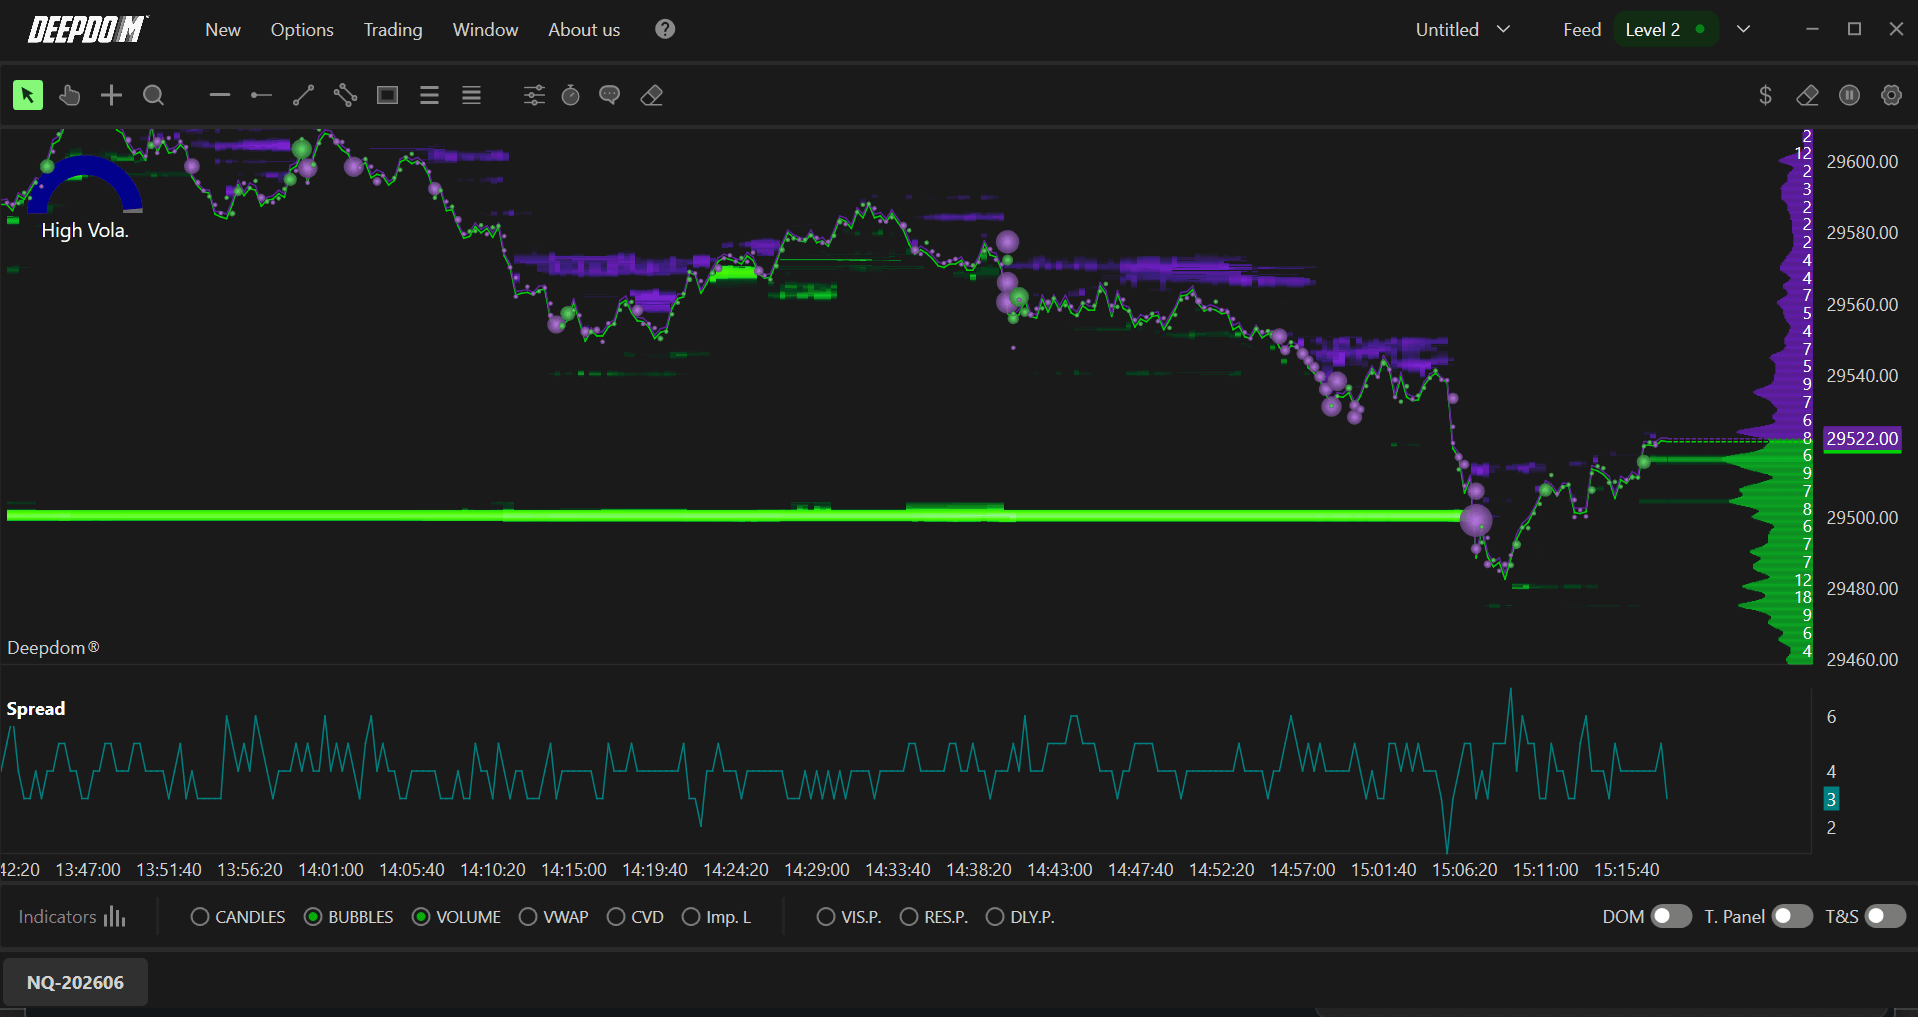
On DeepDom you can already see the spread in the Chart area 2 window; the Spread Bid/Ask indicator summarises this information over time in a separate panel, making patterns obvious even when you are zoomed out.
2. What the Indicator Shows
When applied, Spread Bid/Ask creates a line plot in a separate panel under the chart. Each point of the line shows the current spread in ticks for that moment in time. Sudden spikes in the line correspond to moments when the spread widens, while flat, low values indicate stable, tight conditions.
You can use this visual to quickly answer questions such as: "Did spreads blow out around this news candle?", "Is the product currently trading with a consistently wide spread?", or "Is my strategy about to trade into a low‑liquidity environment ?
3. Alert Settings
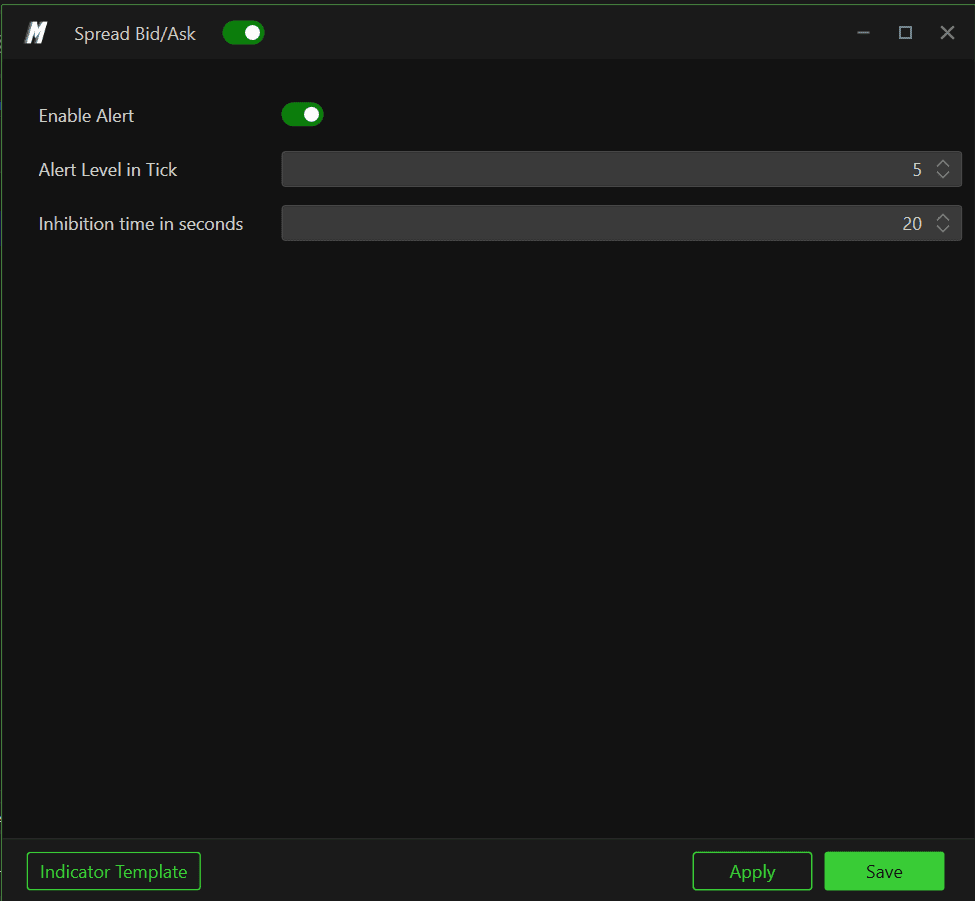
The Spread Bid/Ask settings window focuses on simple but powerful alert logic.
3.1 Enable Alert
Enable Alert turns the spread alert on or off. When enabled, DeepDom continuously monitors the current spread and triggers an alert whenever it crosses your configured threshold.
3.2 Alert Level in Tick
Alert Level in Tick defines how wide the spread (in ticks) must become before an alert is fired. For example:
Setting the level to 5-6 ticks highlights even modest widening, useful for scalping or very tight‑spread instruments.
Values like 10-15 ticks or more focus only on extreme conditions, such as during major news or when liquidity suddenly disappears.
3.3 Inhibition Time in Seconds
Inhibition time in seconds acts as a cooldown period. After an alert is triggered, DeepDom will wait for this amount of time before allowing a new spread alert. This prevents repeated notifications if the spread fluctuates around your threshold.
For example, with an alert level of 5 ticks and inhibition of 20 seconds, you will get at most one alert every 20 seconds even if the spread repeatedly jumps above 5 ticks during that window.
4. Practical Trading Uses
4.1 Avoiding Bad Fills
Wide spreads increase slippage and execution cost for market orders. A spread alert can warn you not to chase into a move when liquidity temporarily vanishes – for example around scheduled macro news or at the start of illiquid sessions.
4.2 Regime Detection
By watching the spread line over time you can distinguish between "normal" and "stress" regimes for each product. Strategies that rely on very tight spreads (scalping, high‑frequency mean reversion) can be disabled automatically or manually when spreads remain above your threshold for long periods.
4.3 Combining with Order‑Flow Tools
Spread Bid/Ask becomes even more powerful when combined with DeepDom tools such as Imbalance Tracker, Deep Reload or Deep Trades. For example, a sudden spread spike plus aggressive imbalances and reloads often accompanies news events or liquidity grabs, which you may want to treat differently from normal rotations.
5. Best Practices
Calibrate per instrument: determine typical spreads for each symbol and set the alert level slightly above that normal range so you only see genuinely unusual widening.
Account for session changes: some products naturally trade with wider spreads in the overnight session; you may want different templates per session.
Use inhibition wisely: short inhibition gives more detail but can create many alerts; longer inhibition is better for high‑volatility days or when monitoring several markets at once.
Still Having Trouble?
Our support team is available 24/7 and ready to help you with any issue you encounter.
When reaching out, please include:
A screenshot of the issue
A brief description of what you were trying to do
Support Ticket (Fastest Response) Visit www.deepcharts.com and create a support ticket directly on our website.
Email Support Reach us at support@deepcharts.com — please note that email responses may take a little longer than a support ticket.