Indicators
Updated:
The Session Imbalance indicator highlights key price levels from the first hour of trading, known as the Initial Balance. These levels are considered significant because the majority of trading volume in any session enters during this opening hour.

For U.S. futures, this corresponds to 9:30 – 10:30 a.m. market time. Over the course of the session, these levels often act as important support, resistance, or reaction zones.
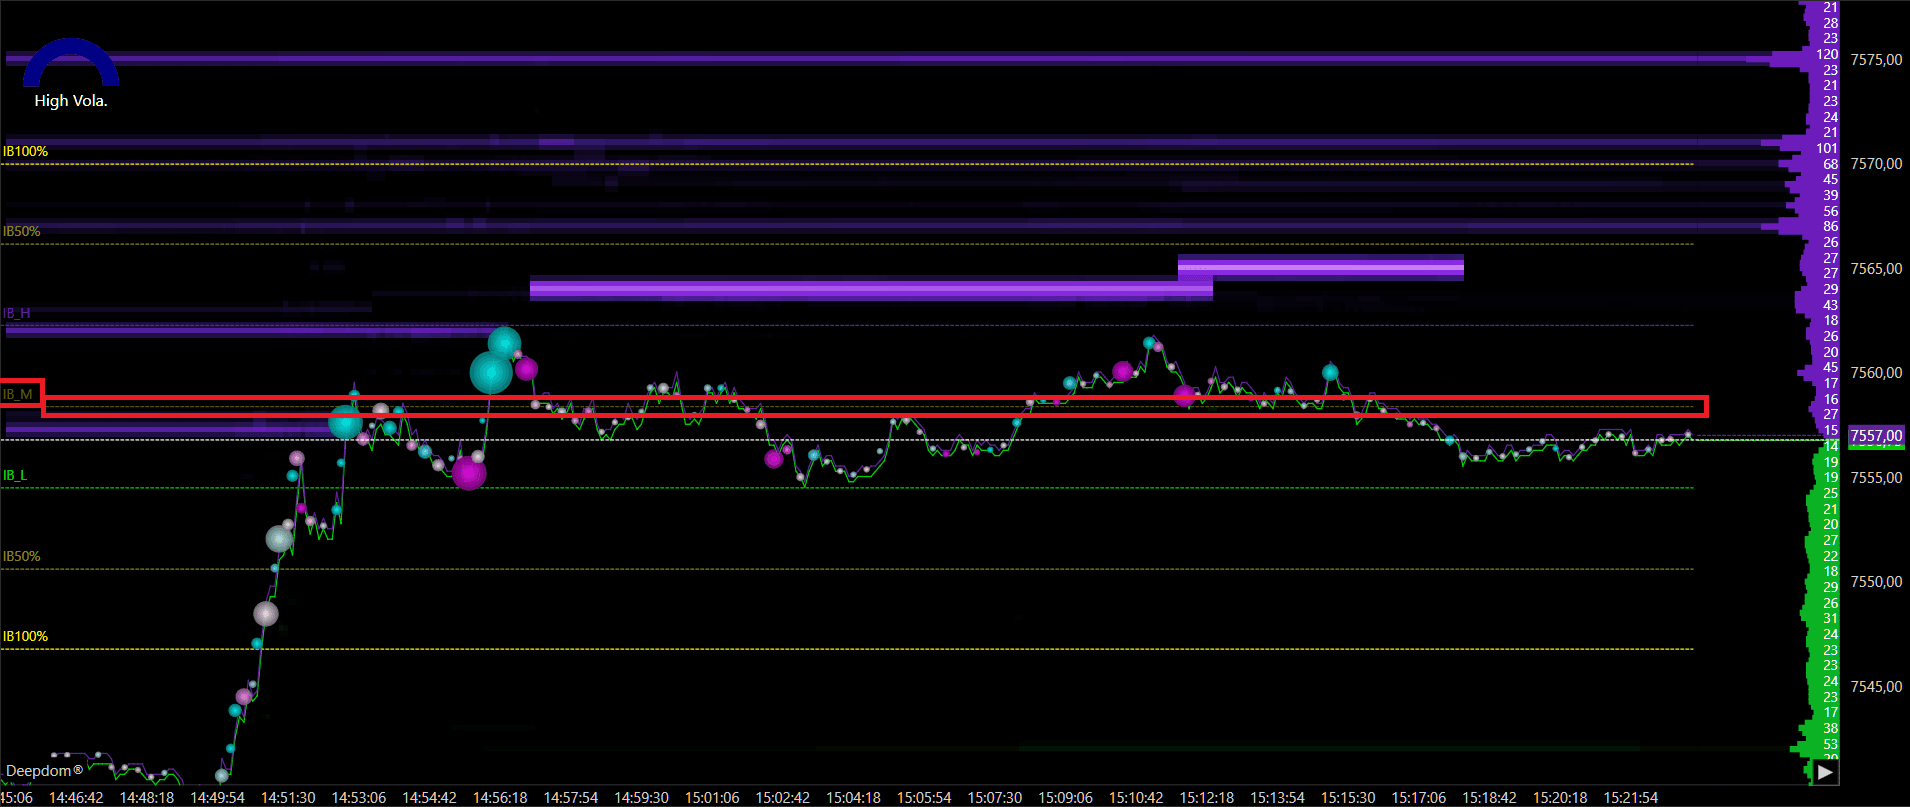
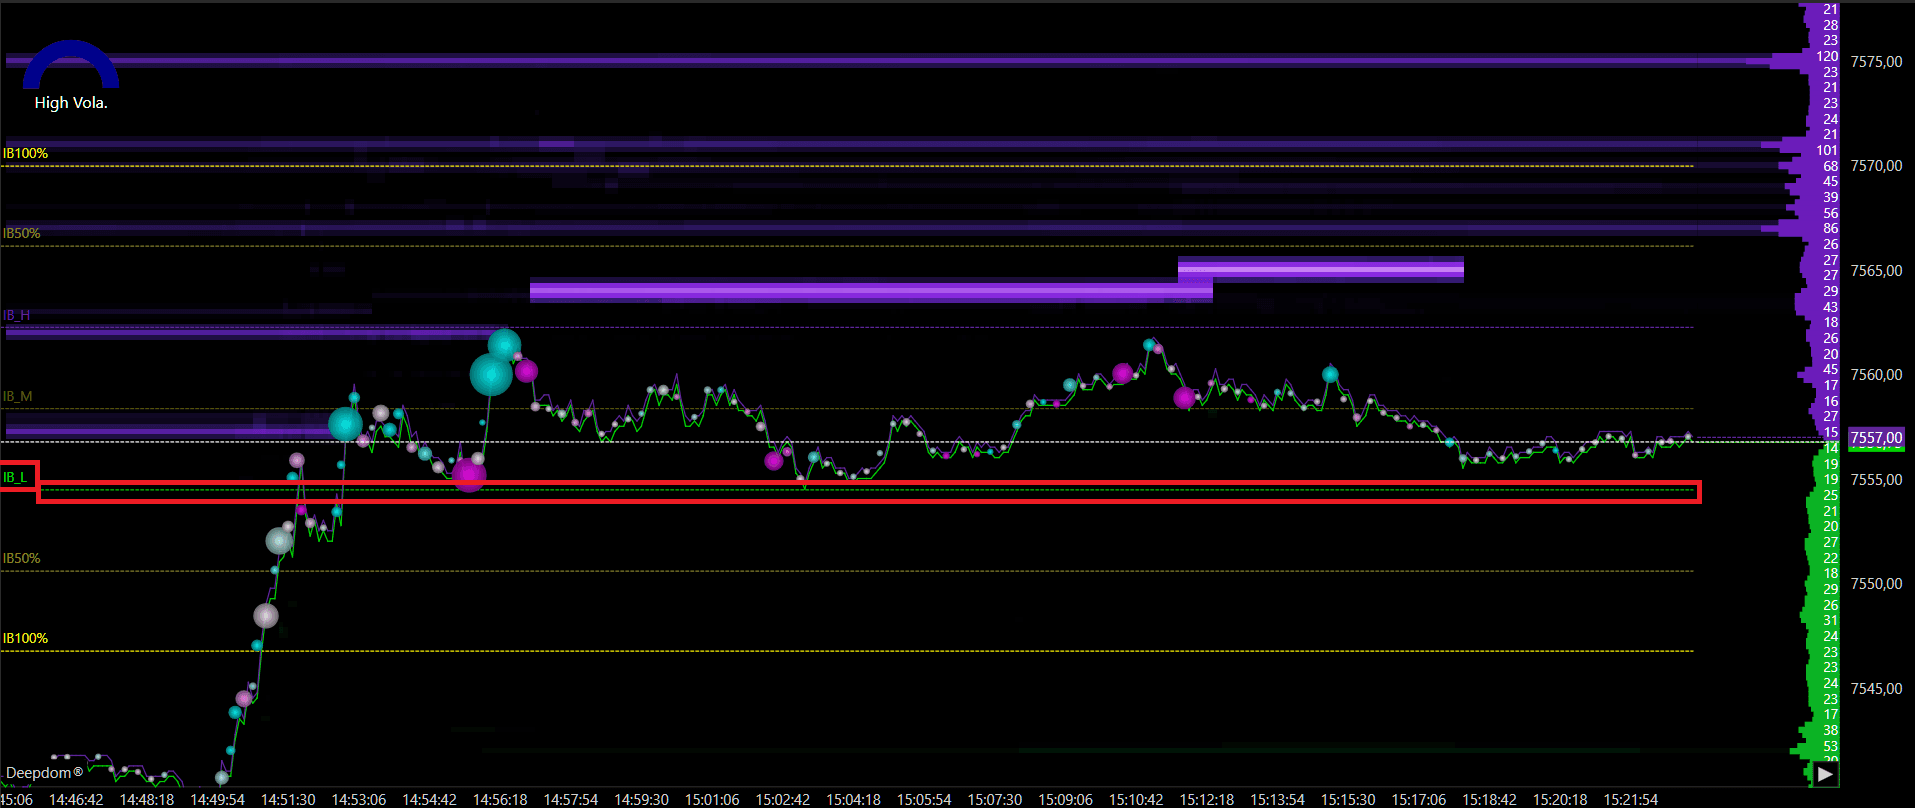
The indicator plots the following levels:
IBH (Imbalance High) — the high of the initial balance period
IBL (Imbalance Low) — the low of the initial balance period
IBM (Mid Point) — the midpoint between IBH and IBL
IB50% — 50% extensions above and below the initial balance
IB100% — 100% extensions above and below the initial balance
When to Use This Indicator
The Session Imbalance indicator is most useful during regular trading sessions where a defined opening period exists — particularly in futures markets like NQ, ES, CL, and similar instruments that have a clear session open with high participation.
Here are the most common situations where this indicator adds real value:
At the start of the trading day As soon as the session opens, the indicator begins building the Initial Balance range. Watching how price behaves within this range during the first hour gives you important context for the rest of the day. A narrow range suggests indecision. A wide range suggests strong directional conviction early in the session.
When price returns to the Initial Balance after breaking out One of the most reliable uses of this indicator is watching for price to break above IBH or below IBL and then return back to those levels. When this happens, the IBH and IBL often flip their role — a former resistance becomes support, and a former support becomes resistance. These re-tests can offer high quality entry opportunities.
Using the Midpoint as an intraday reference The IBM (midpoint) is one of the most watched levels by institutional traders throughout the session. Price gravitating toward the midpoint often signals a balancing or mean reversion move. A strong rejection of the midpoint, on the other hand, can signal continuation in the breakout direction.
Using the 50% and 100% extensions as targets Once price breaks out of the Initial Balance range, the 50% and 100% extension levels become natural targets for the move. If price breaks above IBH, the IB50% extension above becomes the first target, and the IB100% extension becomes the second. The same applies in reverse for a breakdown below IBL.
When combining with order flow and volume tools The Session Imbalance levels become significantly more powerful when combined with tools like the Heatmap or DOM. If a large cluster of limit orders is sitting right at the IBH or IBL level, that confluence makes the level much more likely to act as a strong reaction zone.
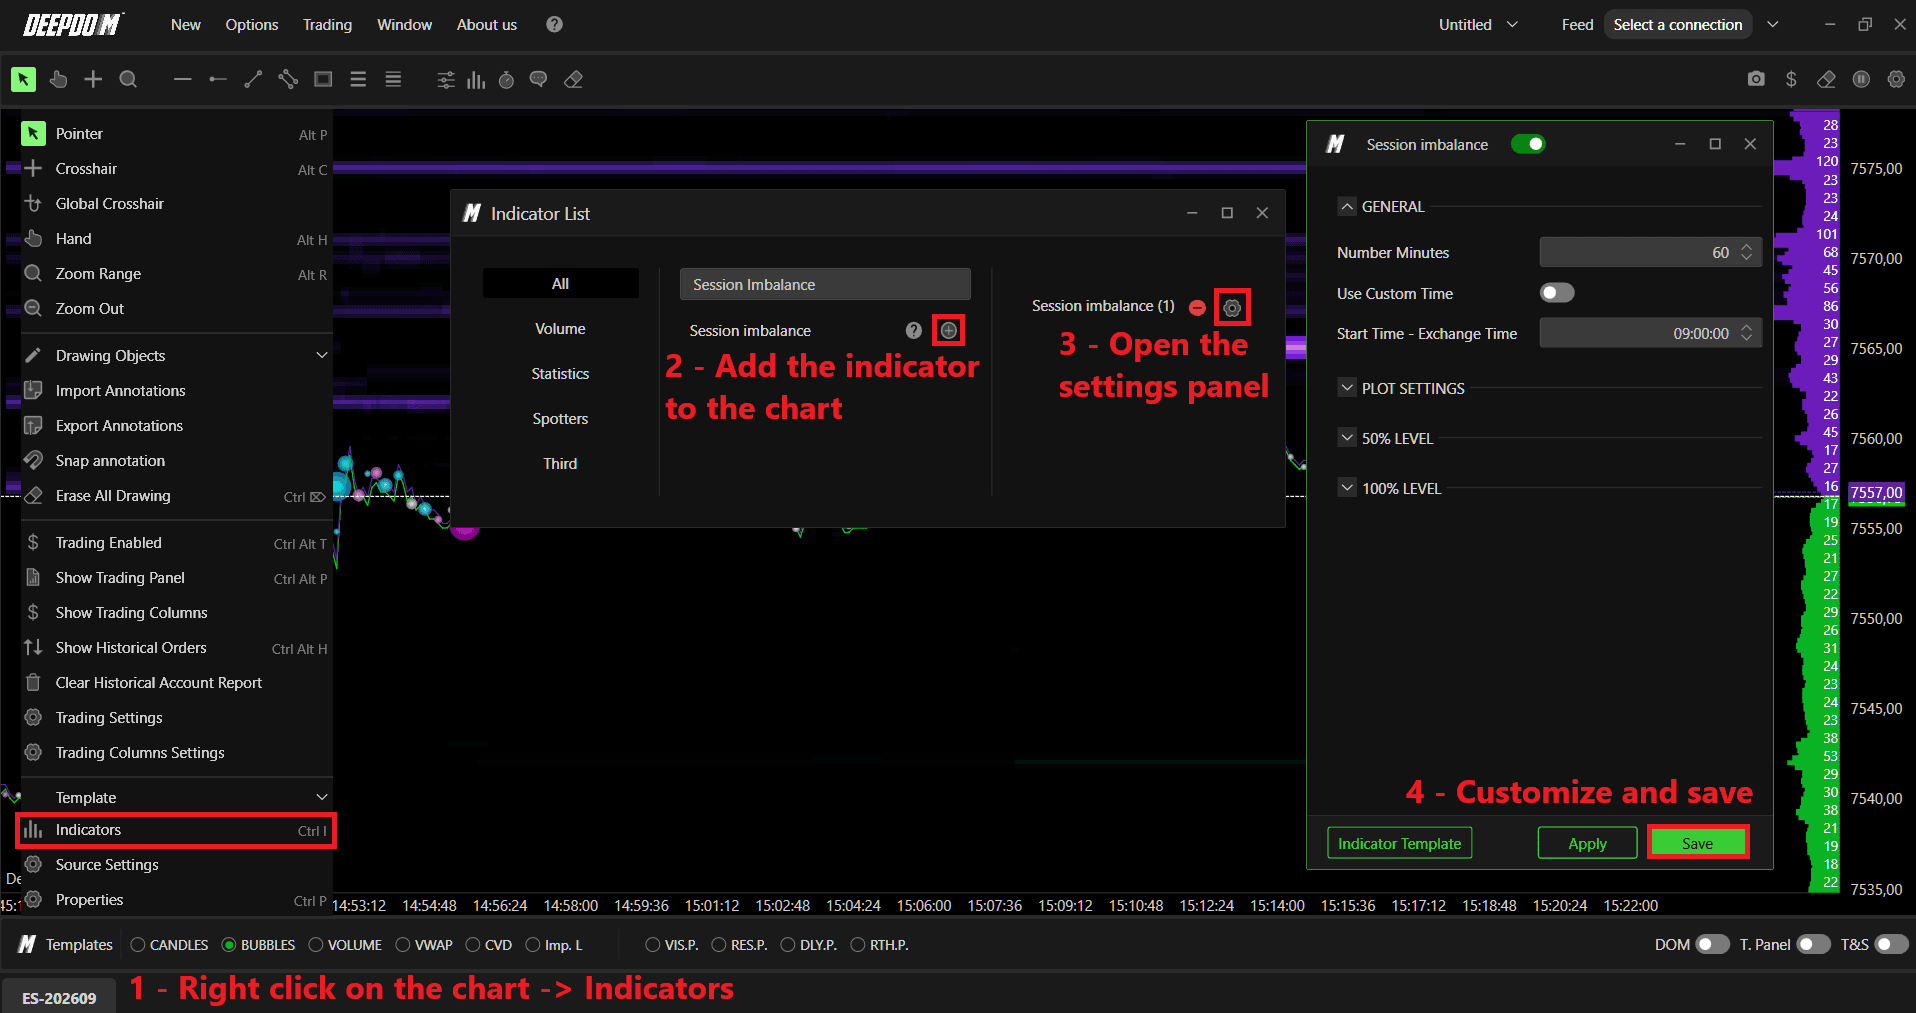
How to Add the Session Imbalance to Your Chart
Click the Indicators icon on the chart
Find Session Imbalance in the list and click + to add it
Click the settings icon on the indicator to open its configuration window
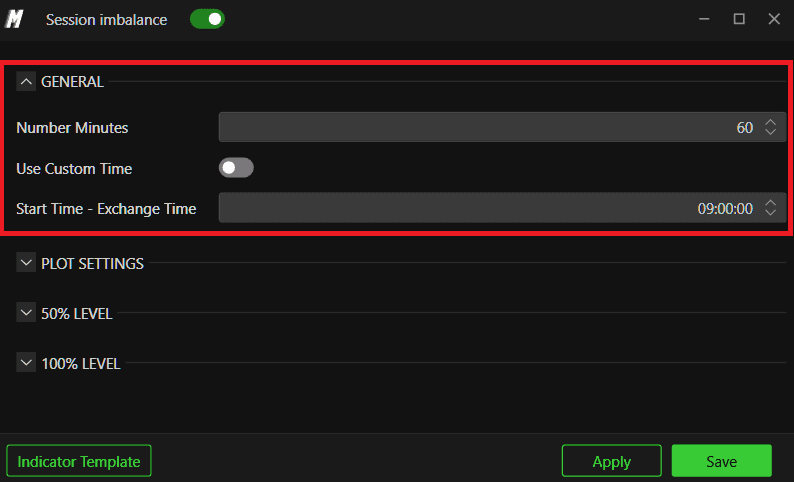
General Settings
Number of Minutes Defines how many minutes are used to calculate the Initial Balance. The default is 60 minutes to capture the first full hour of trading. However, you can adjust this — for example, set it to 15 to use only the first 15 minutes. You can also apply multiple Session Imbalance indicators with different time intervals on the same chart.
Custom Timeframe When enabled, this allows you to manually define a custom session start time instead of using the default.
Start Session – Market Time Defines the start time of the session. Important — always enter the time of the reference market, not your local time zone.
U.S. futures → 9:30 a.m.
European futures → 9:00 a.m.
Plot Settings
High Color Sets the color of the IBH (Imbalance High) line.

Mid Color Sets the color of the IBM (Mid Point) line.
Low Color Sets the color of the IBL (Imbalance Low) line.
Line Width Sets the thickness of all Session Imbalance lines.

Line Style Sets the style of the lines — for example solid, dashed, or dotted.

Text Size Sets the font size of the labels displayed next to each level.

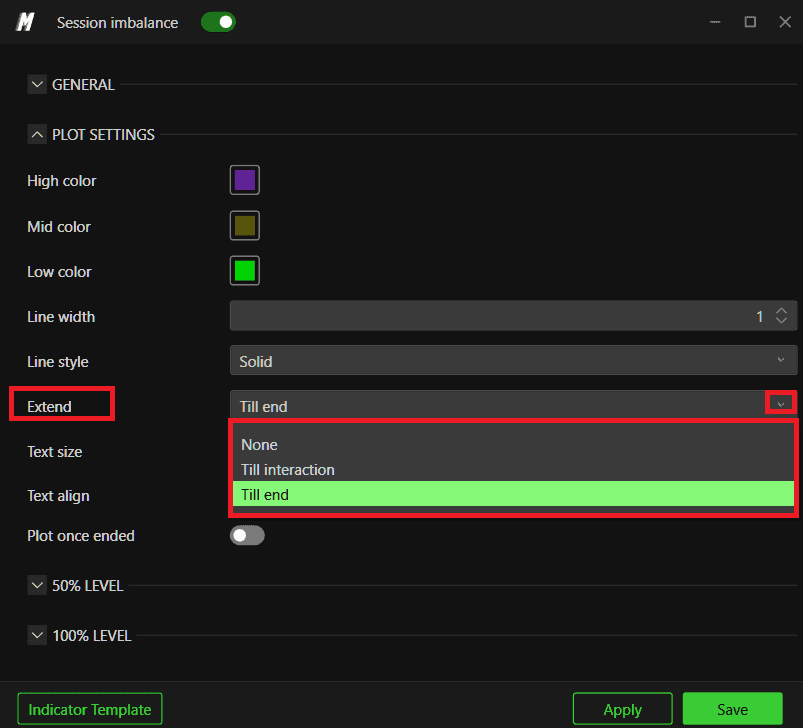
Extend Controls how far the Session Imbalance lines are drawn across the chart. There are three options:
None: The lines are drawn only within the initial balance period itself. Once the period ends, the lines stop and do not extend further to the right.
Till Interaction: The lines extend to the right until price interacts with them — meaning as soon as price touches or crosses a level, the line stops extending at that point. This is useful if you only want to see levels that have not yet been tested by price.
Till End: The lines extend all the way to the right edge of the chart, regardless of whether price has interacted with them or not. This is the default and gives you a full visual reference of all levels across the entire session.
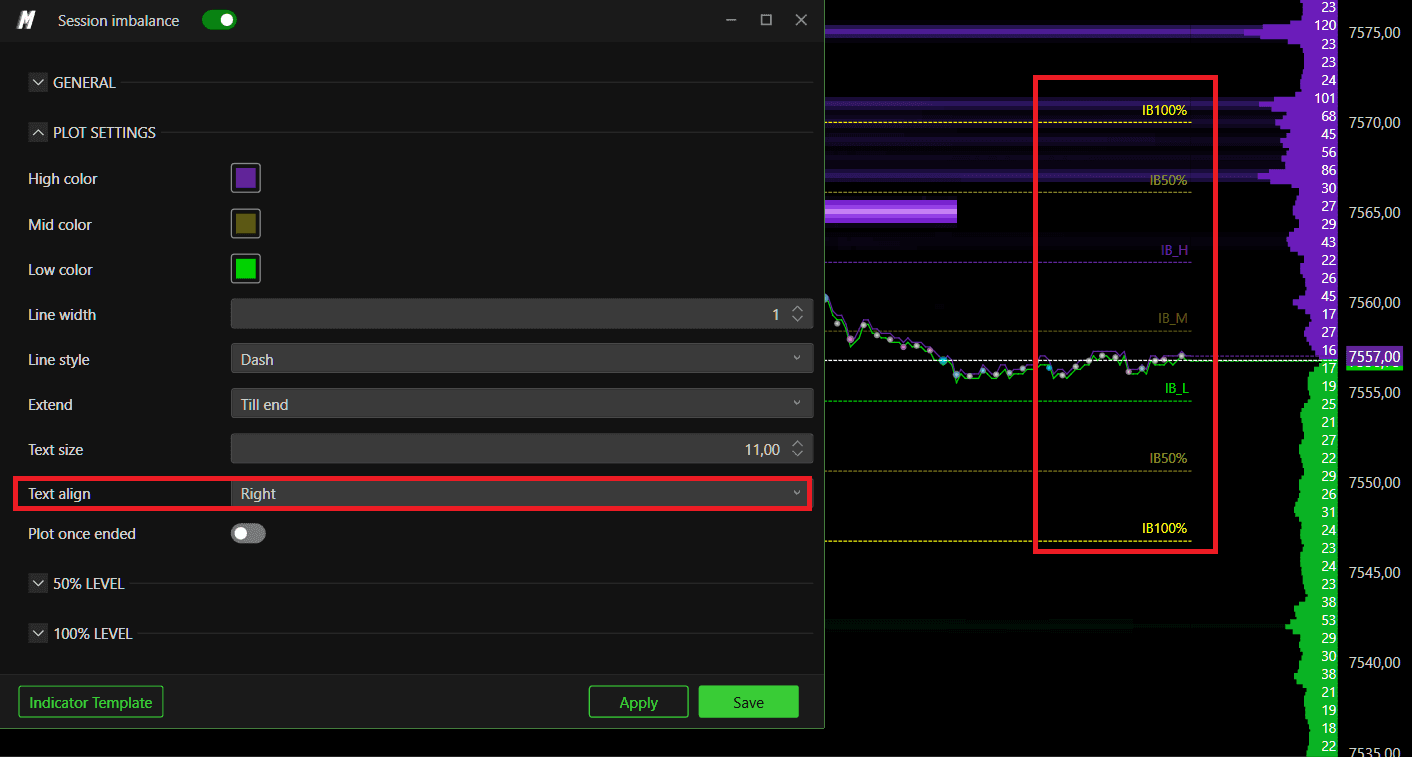
Text Align Sets where the labels appear relative to the lines. You can choose between:
Left
Center
Right

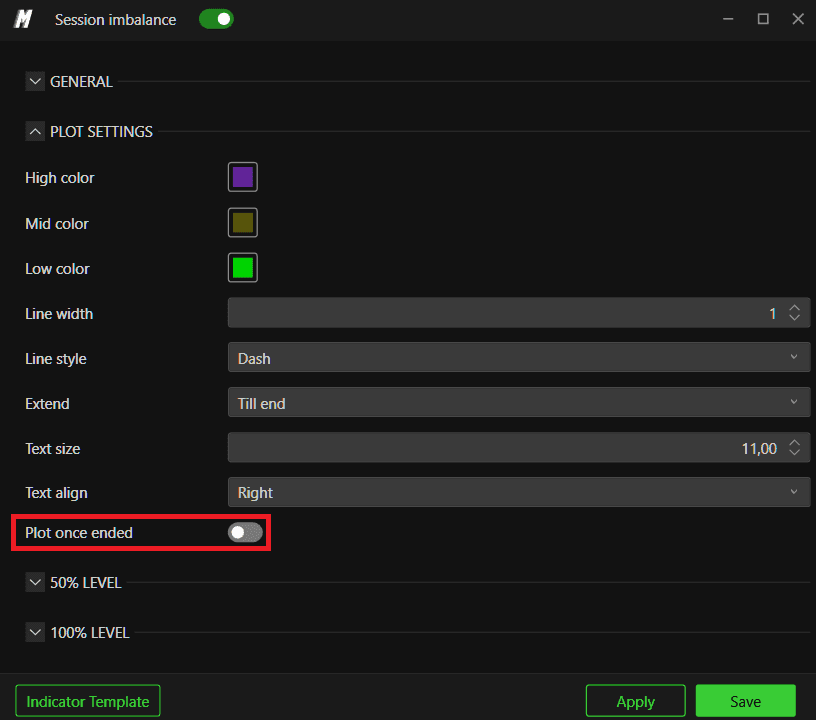
Plot Once Ended When this setting is enabled, the Session Imbalance levels are only drawn on the chart once the initial balance period has fully closed and completed. This means you will not see the lines forming or updating in real time while the opening period is still active — they will only appear after the period ends.
When this setting is disabled, the levels are drawn and updated live as the initial balance period is forming, so you can watch the IBH, IBL, and midpoint develop in real time from the very start of the session.
Use Plot Once Ended ON if you only want to trade the confirmed, finalized levels and prefer a clean chart during the opening period.
Use Plot Once Ended OFF if you want to monitor the levels as they develop and react to price action during the opening period itself.
50% / 100% Extension Levels
Enable the 50% and 100% extension lines to plot projected levels above and below the Initial Balance range. Once enabled, you can set a custom color for each extension.
These extensions are commonly used to identify potential targets or reaction zones if price breaks out beyond the initial balance high or low.


Conclusion
The Session Imbalance indicator gives you an instant visual reference for the most important price levels established in the opening hour of trading. Combined with volume and order flow analysis, these levels can significantly improve the precision of your entries and exits throughout the session.
Still Having Trouble?
Our support team is available 24/7 and ready to help you with any issue you encounter.
When reaching out, please include:
A screenshot of the issue
A brief description of what you were trying to do
Support Ticket (Fastest Response) Visit www.deepcharts.com and create a support ticket directly on our website.
Email Support Reach us at support@deepcharts.com — please note that email responses may take a little longer than a support ticket.