



There’s a player in this market that is forced to buy and sell S&P 500 futures every single day. It doesn’t trade because it has an opinion: it trades because it has to hedge. Understand how it hedges and you’ll have, before the session starts, an address for where that flow — if it shows up — should concentrate. The map gives you the address; the tape tells you whether anyone’s home.

Before the mechanics, the proportions
To see why the rest of this article matters, you need a sense of how big this industry is. Index options are not an exotic corner of finance: they’re the arena where the risk of the entire equity market gets managed. Inside you’ll find pension funds buying systematic protection, funds selling options to squeeze out extra yield, market makers quoting everything — and, more and more, retail firing 0DTEs.
Then there are the numbers. SPX options alone trade almost 4 million contracts a day (Cboe data, 2025), and roughly 60% of them expire the same day. In dollar terms: over $2 trillion of notional, every single day. The ES futures, by comparison, moves around $400–500 billion. Read that again: the “derivative” market trades more value every day than the instrument it hedges on. Notional is not the same thing as hedgeable exposure — but even delta-adjusted, the daily flow through index options is on the same scale as the entire ES tape.
Keep that picture in mind for the whole article: a mountain of policies to hedge, and a much smaller instrument where all the hedging lands. When a mass like that adjusts, what hits the ES isn’t a breeze — it’s the weather.
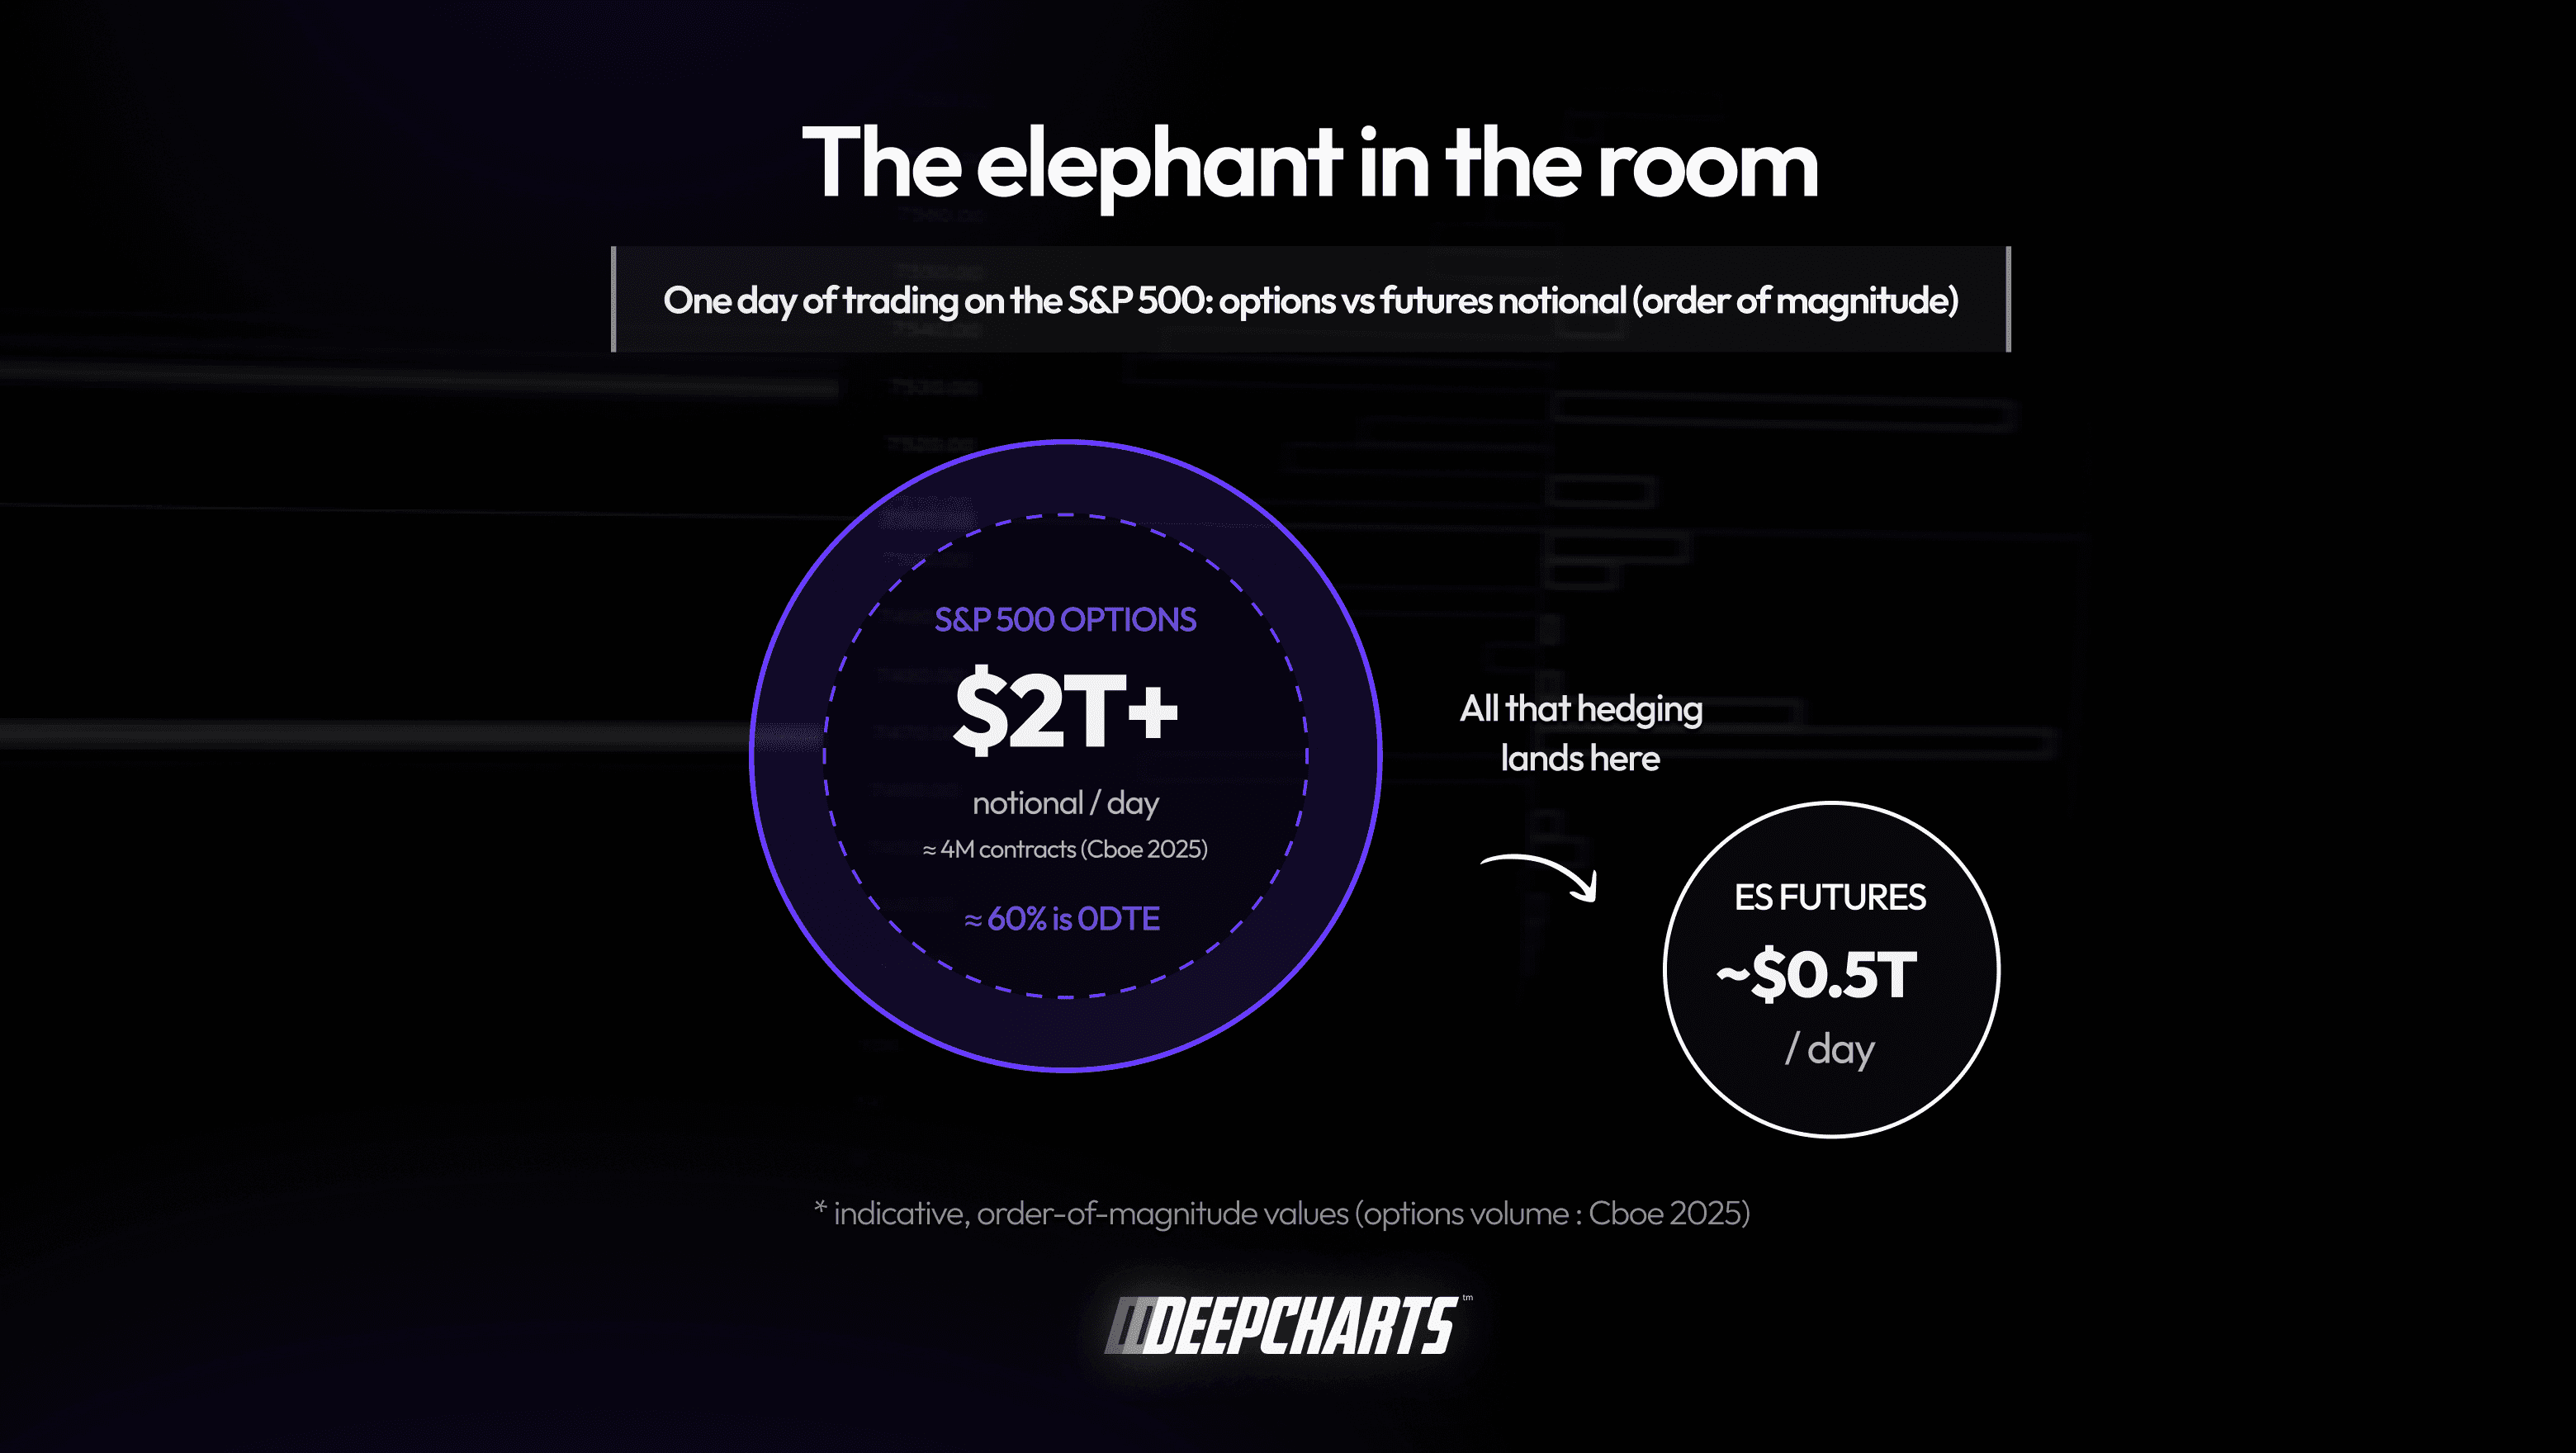
Figure 1 · The elephant in the room
Start with a boring business: insurance
An insurance company does something very simple: it sells protection and collects a premium. You pay $500 a year and, if your car gets stolen, the company pays you $20,000. Its goal is not to “bet” on whether your car will be stolen or not: it’s to collect lots of premiums and manage the risk so that, at the end of the year, the numbers work out.
How does it pull that off? Statistics. It insures a million drivers, knows that on average ten thousand of them will get robbed, and prices the premiums accordingly. Thefts are independent events: if your car gets stolen, the odds that mine will don’t change. The risk dilutes itself.
Markets have the exact same job: the dealer, the options market maker. When you buy a put on the S&P 500 to protect your portfolio, or a 0DTE call to ride the day’s rally, the other side of your trade is almost never another trader like you: it’s a dealer selling you that “policy” and pocketing the premium.
But the dealer has one problem the car insurer doesn’t have: its clients all “crash” at the same time. If the S&P 500 drops 3%, every put it has sold moves into the money for its clients simultaneously. No statistics, no diversification: the risk doesn’t dilute. If the dealer just sat there, it would be a giant directional gambler — exactly what it doesn’t want to be.
So it does the only thing it can do: it hedges in the market, continuously. And on index options, the instrument it uses to do it is the futures.
The hedge: delta hedging
Every option has a delta: how much the option’s price moves when the index moves one point. A call with a 0.50 delta gains about half a point for every point the index gains. You can also read it this way: holding that call is like holding “half a unit” of the index.
The dealer thinks in exactly these terms. Let’s make it concrete.
A fund buys 500 calls on the S&P 500, strike 6,000, delta 0.50. The dealer sells them. Being short those calls, the dealer is left with bearish exposure: if the index rises, it loses. With the 100 multiplier on index options, its exposure is:
500 contracts × 100 × 0.50 = 25,000 “index units” short.
The dealer doesn’t want this bet. So it neutralizes it by buying the equivalent — and it does it on the ES futures, the most liquid, most margin-efficient instrument, open almost 24 hours. One ES contract is worth about 50 index units, so:
25,000 ÷ 50 = 500 ES contracts bought.
Done. The dealer is now “flat”: if the index moves a little in either direction, what it loses on the options it makes back on the futures, and vice versa. It earns what it wanted to earn from the start: the premium, the spread. Just like the insurer.
This mechanism is called delta hedging, and it’s the reason the options market and the futures are two communicating vessels. What the dealer hedges is the net of its book: not every option becomes an order, but the net exposure does — and on index options, the instrument of choice is the futures.
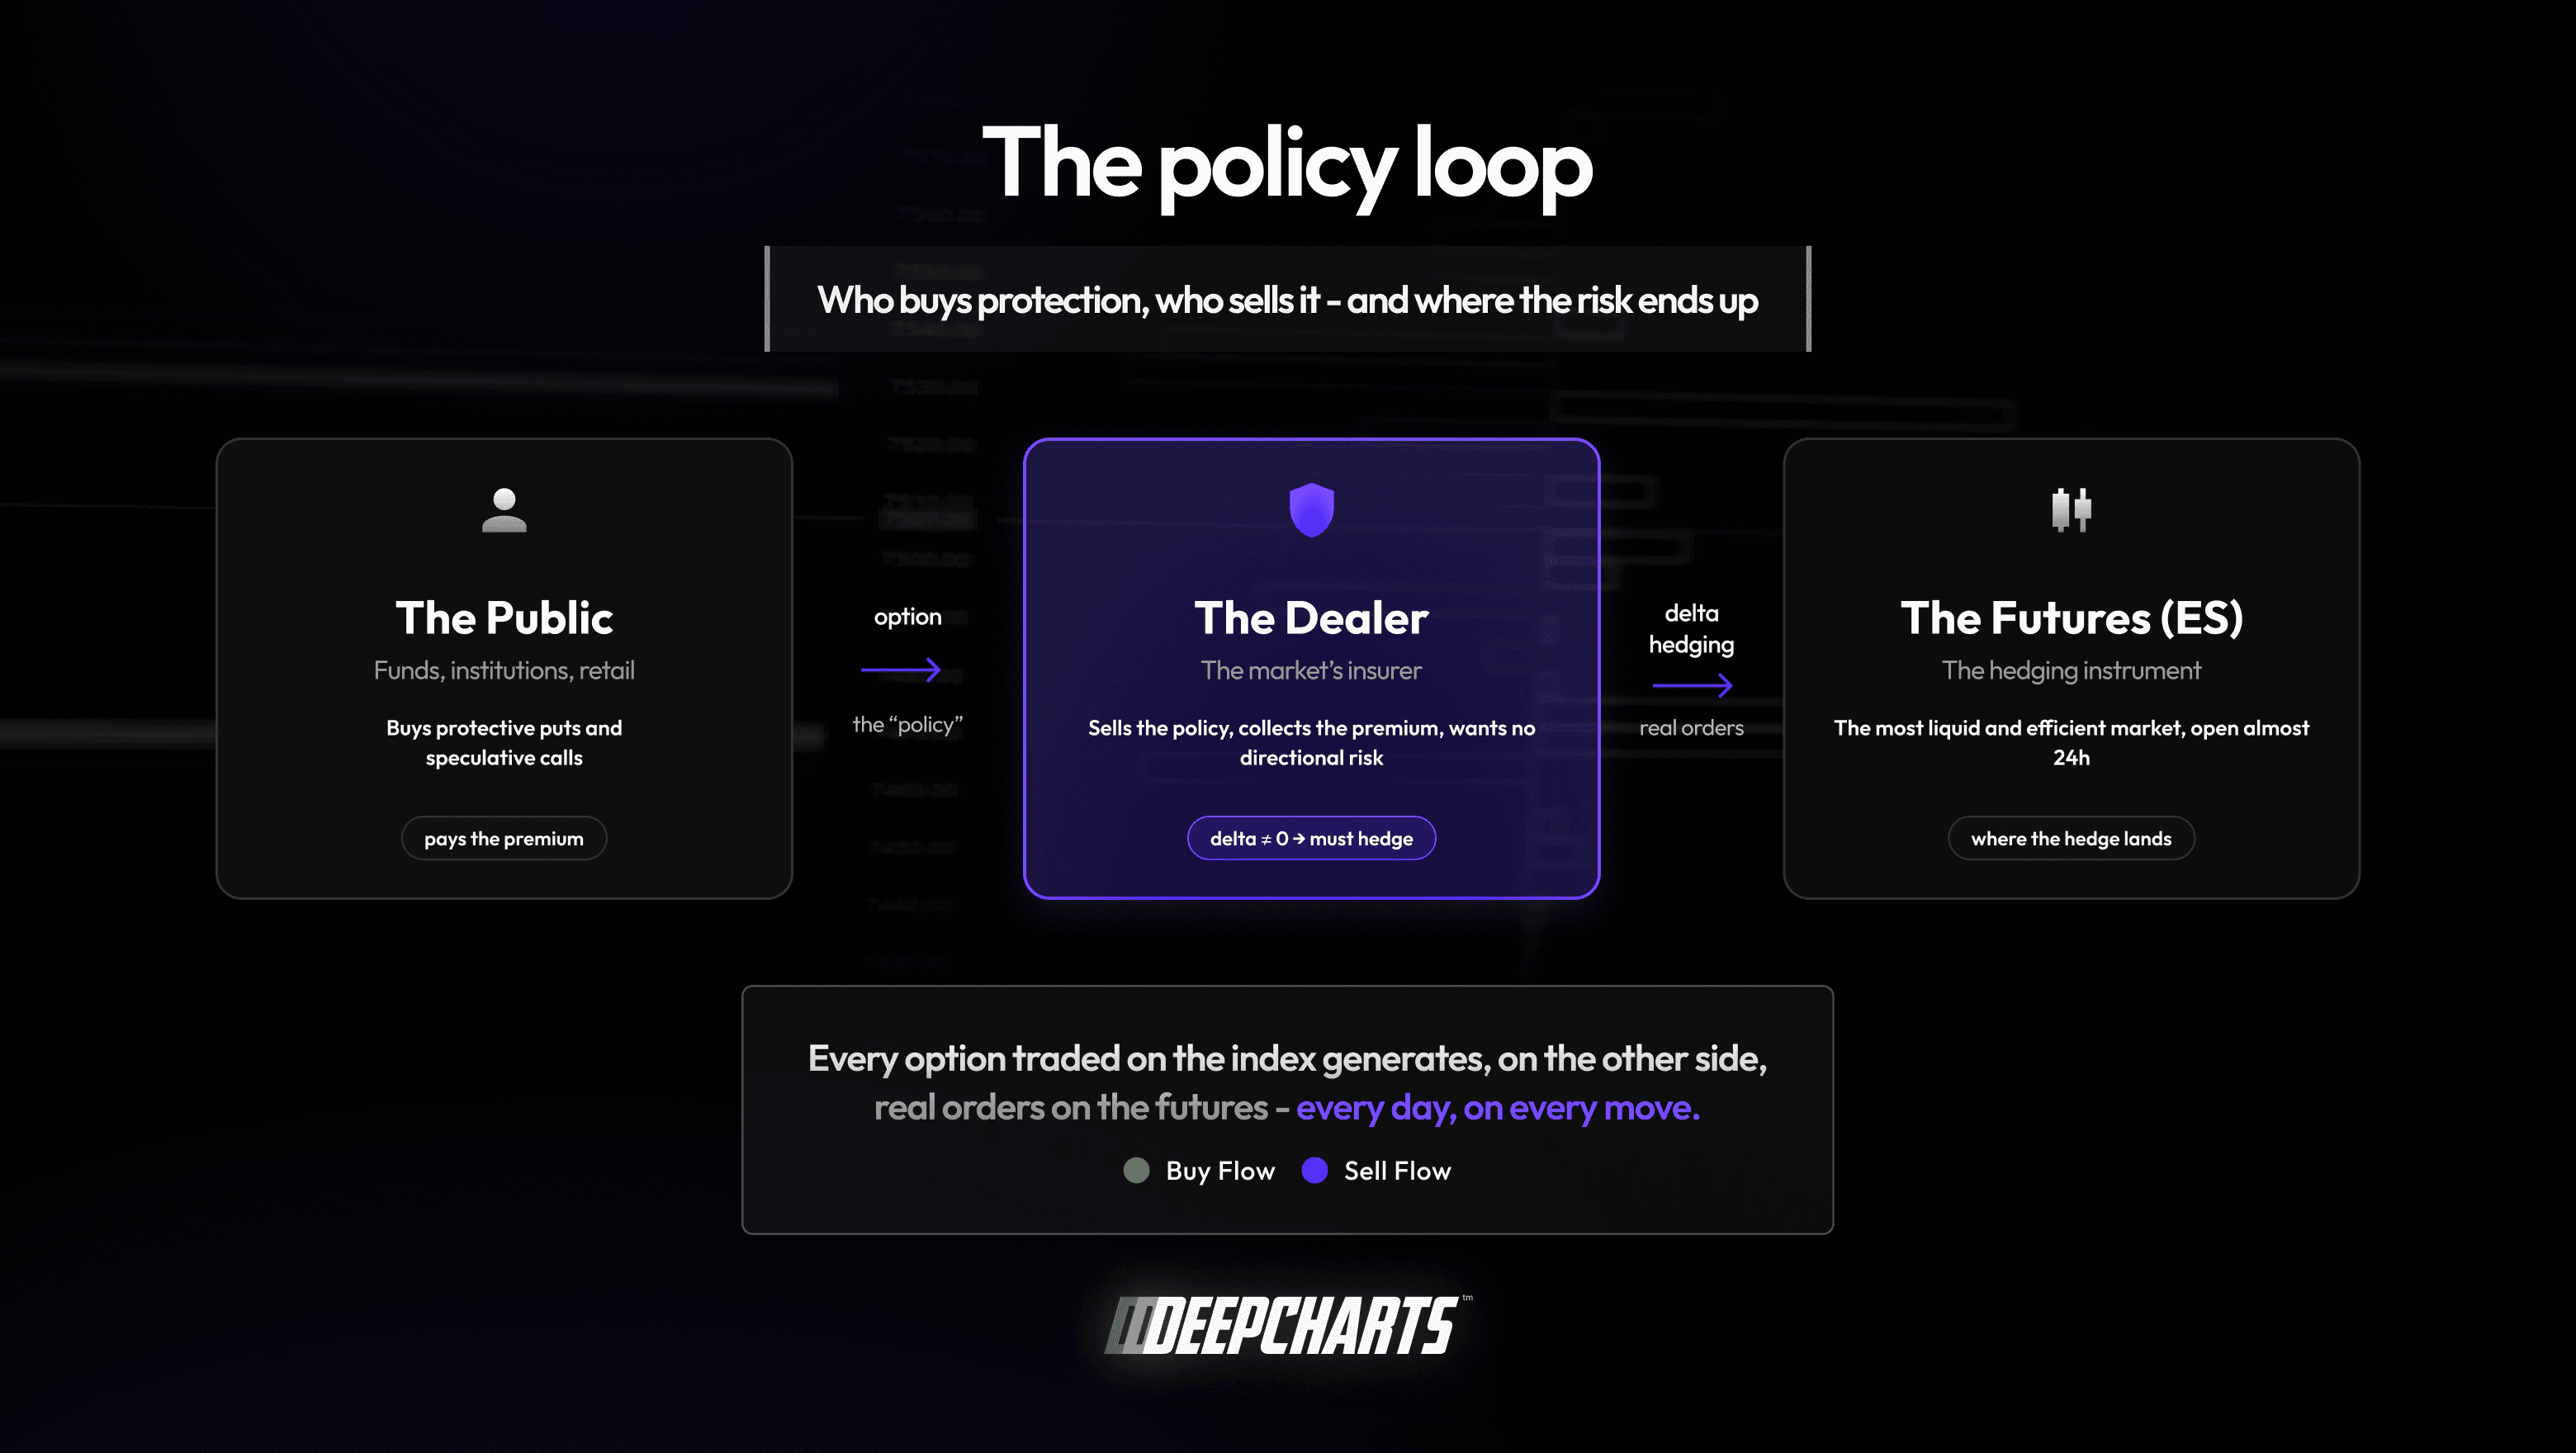
Figure 2 · The policy loop
The problem: delta doesn’t sit still
If delta were a fixed number, the story would end here: one hedge, one time, good night. But delta changes constantly, and this is where everything begins.
When the index rises, the 6,000-strike call becomes more and more “real”: its delta climbs from 0.50 toward 0.60, 0.70, all the way to 1 if it ends up deep in the money. When the index falls, delta slides toward zero.
The speed at which delta changes has a name: gamma. Gamma tells you how much delta moves for every point the index moves. And it’s at its maximum when price is close to the strike and expiration is close: a 0DTE sitting on the right strike is pure gamma.
Back to our dealer. The index rises 20 points and the calls’ delta goes from 0.50 to 0.58. Its short options position is now worth:
500 × 100 × 0.58 = 29,000 units short — but it has hedged only 25,000.
It’s missing 4,000 units: it must buy 80 more ES contracts (4,000 ÷ 50). If the index keeps climbing, it will have to buy more. If it drops back, it will find itself over-hedged and will have to sell.
Stop on this point for a second, because it’s the heart of the whole article: those 80 ES are not an opinion. They are an obligation. Desks don’t hedge every tick — they work within risk bands, netting what can be netted. But the direction of the adjustment is not a choice: sooner or later, the book forces it. And that was one position, of one dealer. The real market carries millions of open contracts across hundreds of strikes, and dealers re-hedge all of them, all day long.
In the day’s total ES volume this flow is a small, uneven slice: its weight varies by level and by hour. And no single print comes labeled “hedge”. What the map we’re about to build gives you is a hypothesis with an address — where this flow, if it shows up, should concentrate. That’s where you go watch the tape.

Figure 3 · Delta doesn’t sit still
The two regimes: long gamma and short gamma
The direction of this mechanical flow depends on one thing only: whether dealers, in aggregate, are long or short options.
Dealers long gamma (they’ve bought more options than they’ve sold, typically because the public sells covered calls and puts to collect premium). When the index rises, their delta grows too much and they must sell futures. When it falls, they must buy futures. Net result: they sell the rallies and buy the dips. A counter-current flow that works like a shock absorber: moves tend to get dampened, price gets pulled back toward the big strikes, candles get shorter. It’s the “sticky” market of range days, the one where every breakout dies after ten points.
Dealers short gamma (they’ve sold more options than they’ve bought, typically because the public buys protective puts and speculative calls). When the index rises they must buy futures, when it falls they must sell futures. They buy the rallies and sell the dips: a pro-cyclical flow that pours fuel on the fire. Moves tend to extend, sell-offs accelerate, bounces turn into squeezes. It’s the market of violent trend days and long tails.
Same exact hedging logic, two opposite effects on the market. No conspiracy, no manipulation: it’s arithmetic.
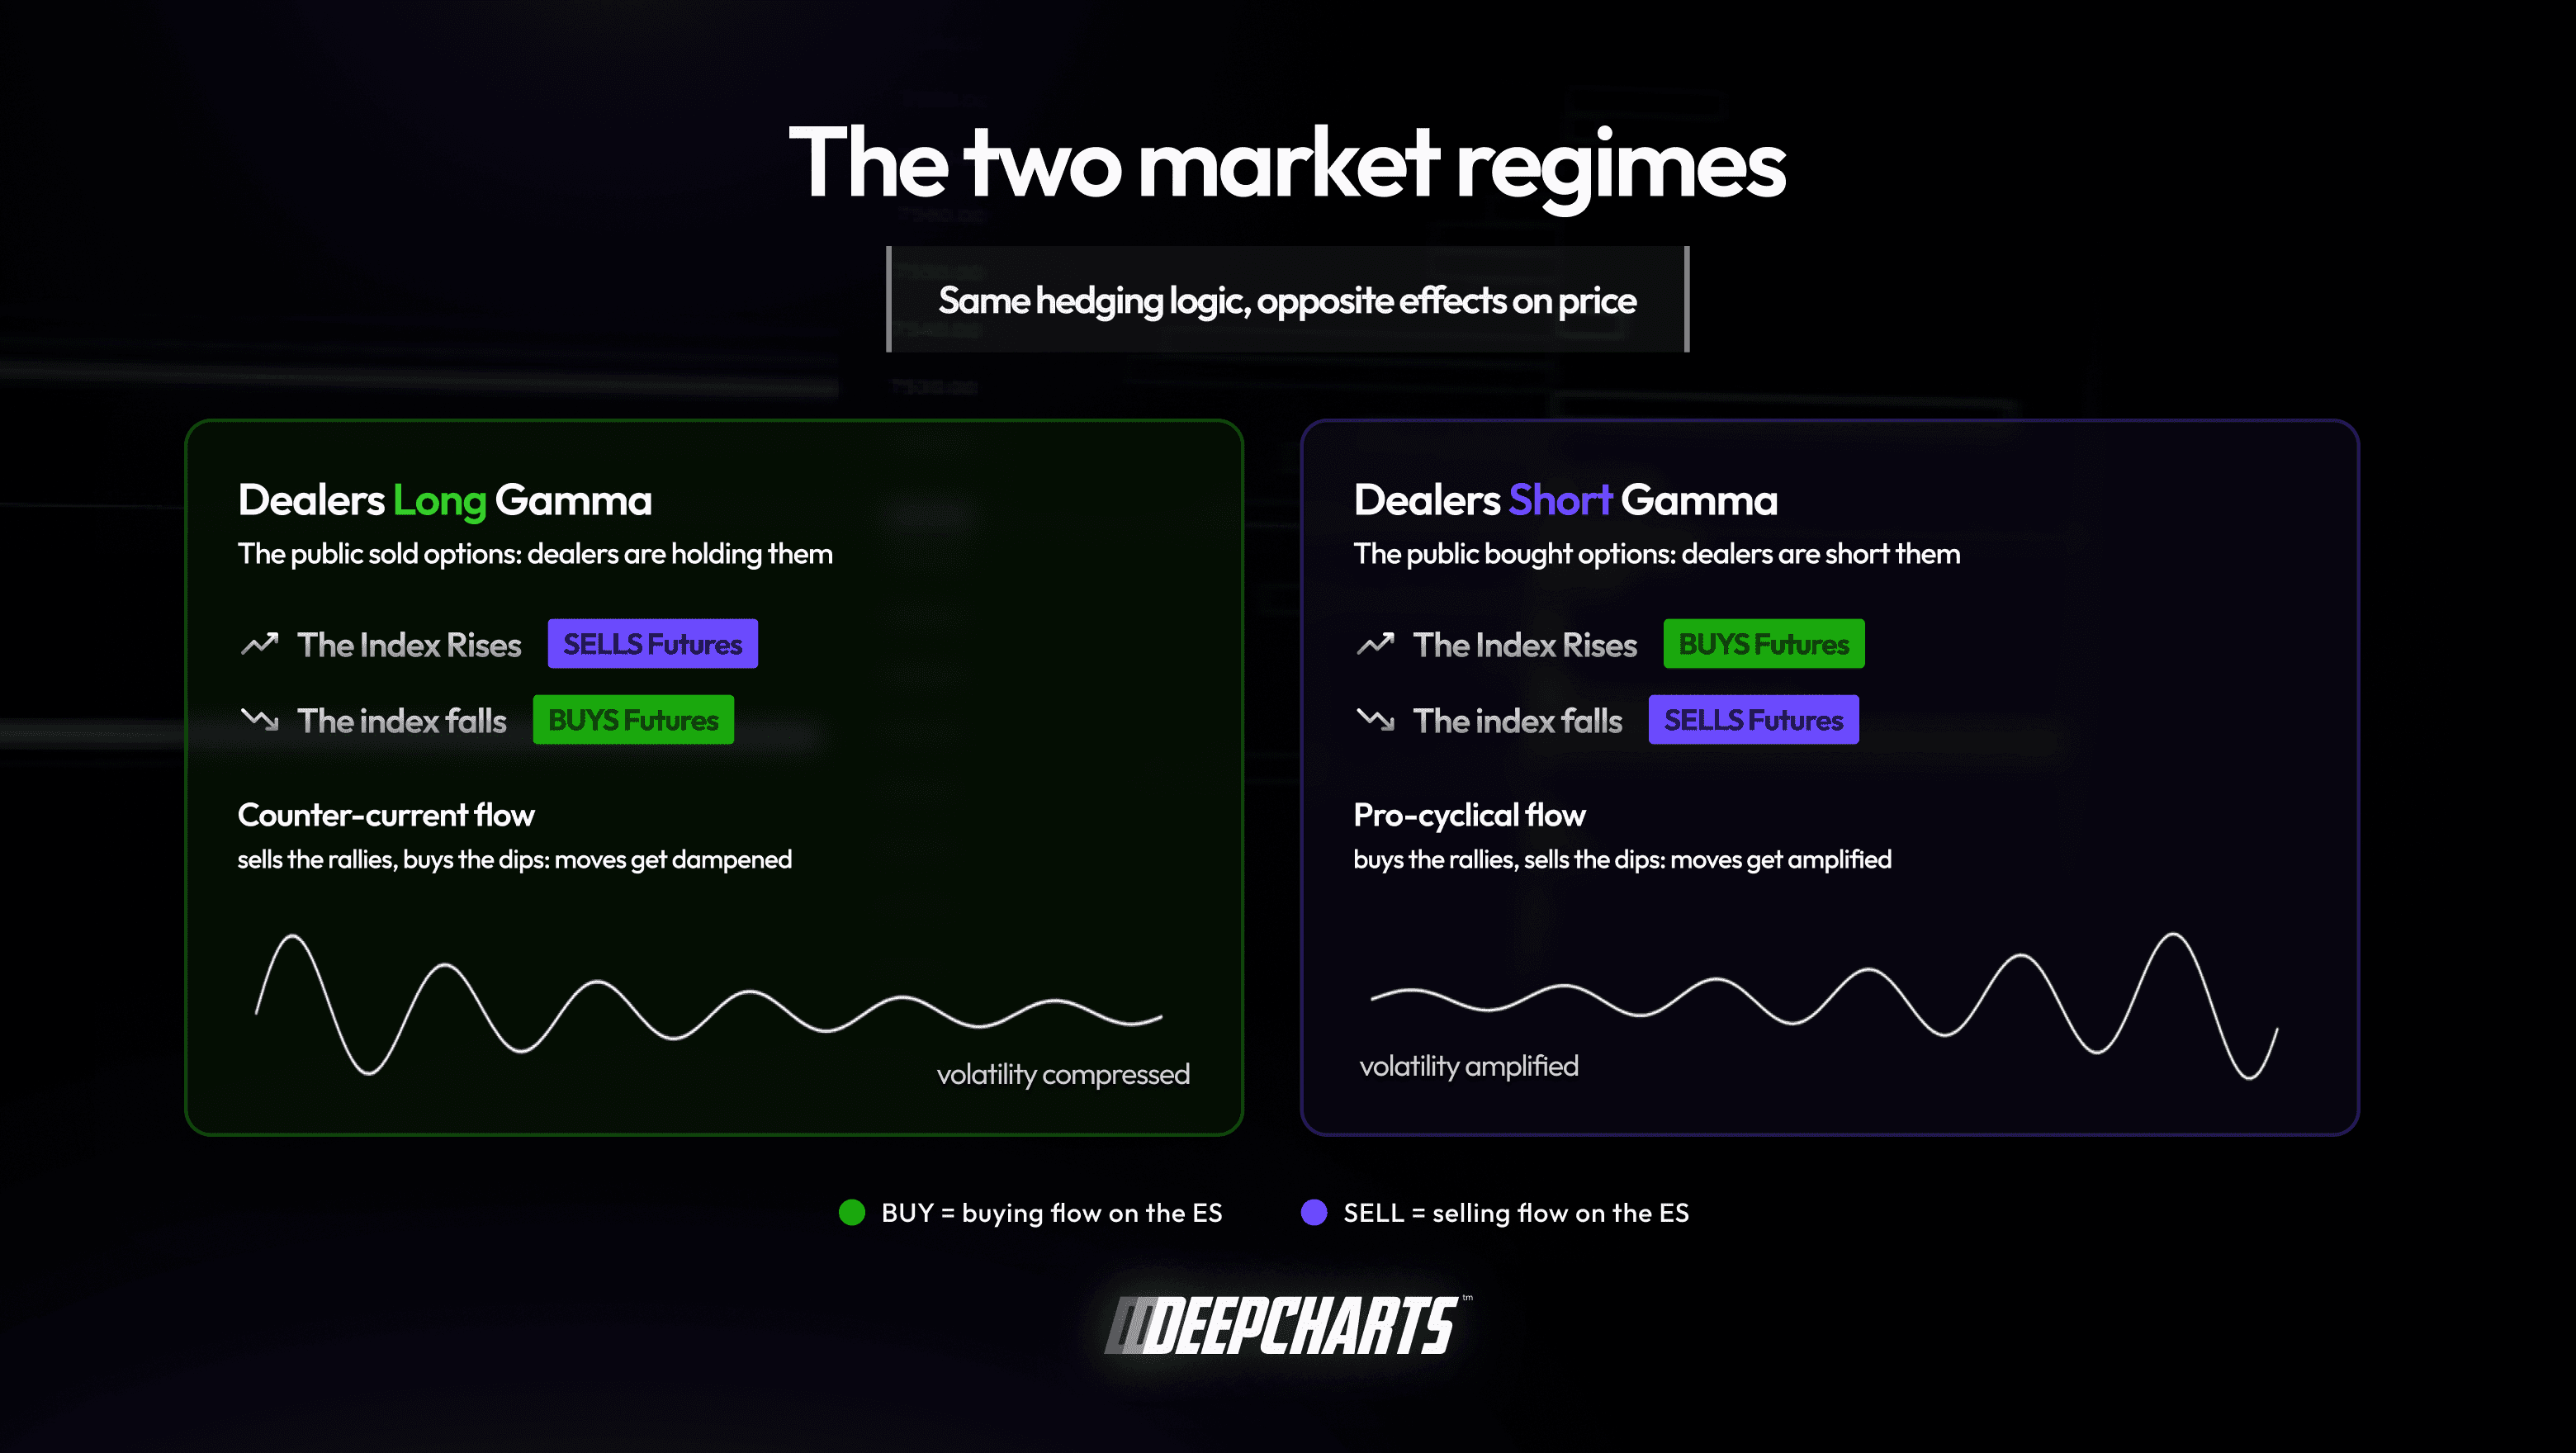
Figure 4 · The two regimes
From one dealer to the whole market: GEX
At this point the question is obvious: how do I know which mode we’re in today?
Enter Gamma Exposure, or GEX. The idea is simple. Open interest on index options is public, strike by strike. Multiply gamma by the open contracts at every strike, work out which side the dealers are on, and you get an estimate of how many futures dealers must buy or sell for every point the index moves.
Everything hangs on that middle step — which side the dealers are on. And that is exactly where almost every GEX number you have ever seen quietly gives up.
The naive shortcut. Public open interest tells you how many contracts are open at a strike. It does not tell you who is long and who is short. So the standard approach assumes it: dealers are long the calls (because the public sells covered calls for yield) and short the puts (because the public buys protection). It’s the industry standard, and it’s built on a stated assumption. We offer that map too — clearly labeled for what it is. But an assumption it remains.
And it’s most fragile exactly where today’s market lives: on 0DTE, positioning builds and unwinds within hours, and no static rule about who is holding what survives the session. It strains around OPEX, when positioning rotates in a matter of days. It strains whenever institutional flow does something the convention never anticipated. And it doesn’t fail loudly: a naive gamma map doesn’t throw an error, it just hands you a zero gamma level that sits in the wrong place — and you spend the session trading against a regime that isn’t there.
What we do instead. deepcharts is licensed by Cboe for its Open–Close data. That dataset reports, series by series, the volume executed on the exchange broken down by class of participant — market makers, firms, broker/dealers and customers, with customer flow split further by trade size and by whether each trade opened or closed a position.
Read that again, because it is the whole point of this section: the market maker’s side is a reported field, not an inference. We are not deciding who is long the calls. The exchange tells us who traded them, and in which direction.
And on the S&P 500 this matters more than anywhere else, because SPX options are listed exclusively on Cboe: no second venue to miss, no market share to extrapolate from. For SPX and SPXW, participant class and side for exchange executions are in the feed, series by series. Who traded, and which way, is observed. What they are still holding is reconstructed from those observations — a reconstruction from reported facts, not a photograph of positions.
So the dealer’s side stops being a convention and starts being an observation. Same mechanics as before — gamma × open contracts, strike by strike — but with the one input that decides the sign of the whole map taken from the exchange instead of from a rule of thumb.
You read GEX on two levels.
The aggregate number. High positive GEX reads as dealers long gamma: the working hypothesis is compression — moves that tend to fade, breakouts that tend to struggle. Negative GEX reads as dealers short gamma: the hypothesis becomes extension — moves that tend to run, volatility calling more volatility.
The per-strike profile. This is where it gets interesting for futures traders, because gamma is not spread evenly: it clusters on the big strikes. A call wall marks a strike where the map shows concentrated exposure, with the estimated hedging pressure leaning against the move. That makes it a zone worth watching — not a level expected to reject price. How the tape behaves on arrival tells you more than the label. The mirror image below the price is the put wall. And then there’s the most important level of all: zero gamma, the gamma flip — the level where the estimated aggregate exposure changes sign, the map’s border between the two regimes above. What price actually does around a crossing is a tape-reading job, not an assumption.
That level is also the one the naive approach gets wrong most often. Get the dealer’s side wrong and the flip doesn’t move a little: it moves to a different part of the chart.
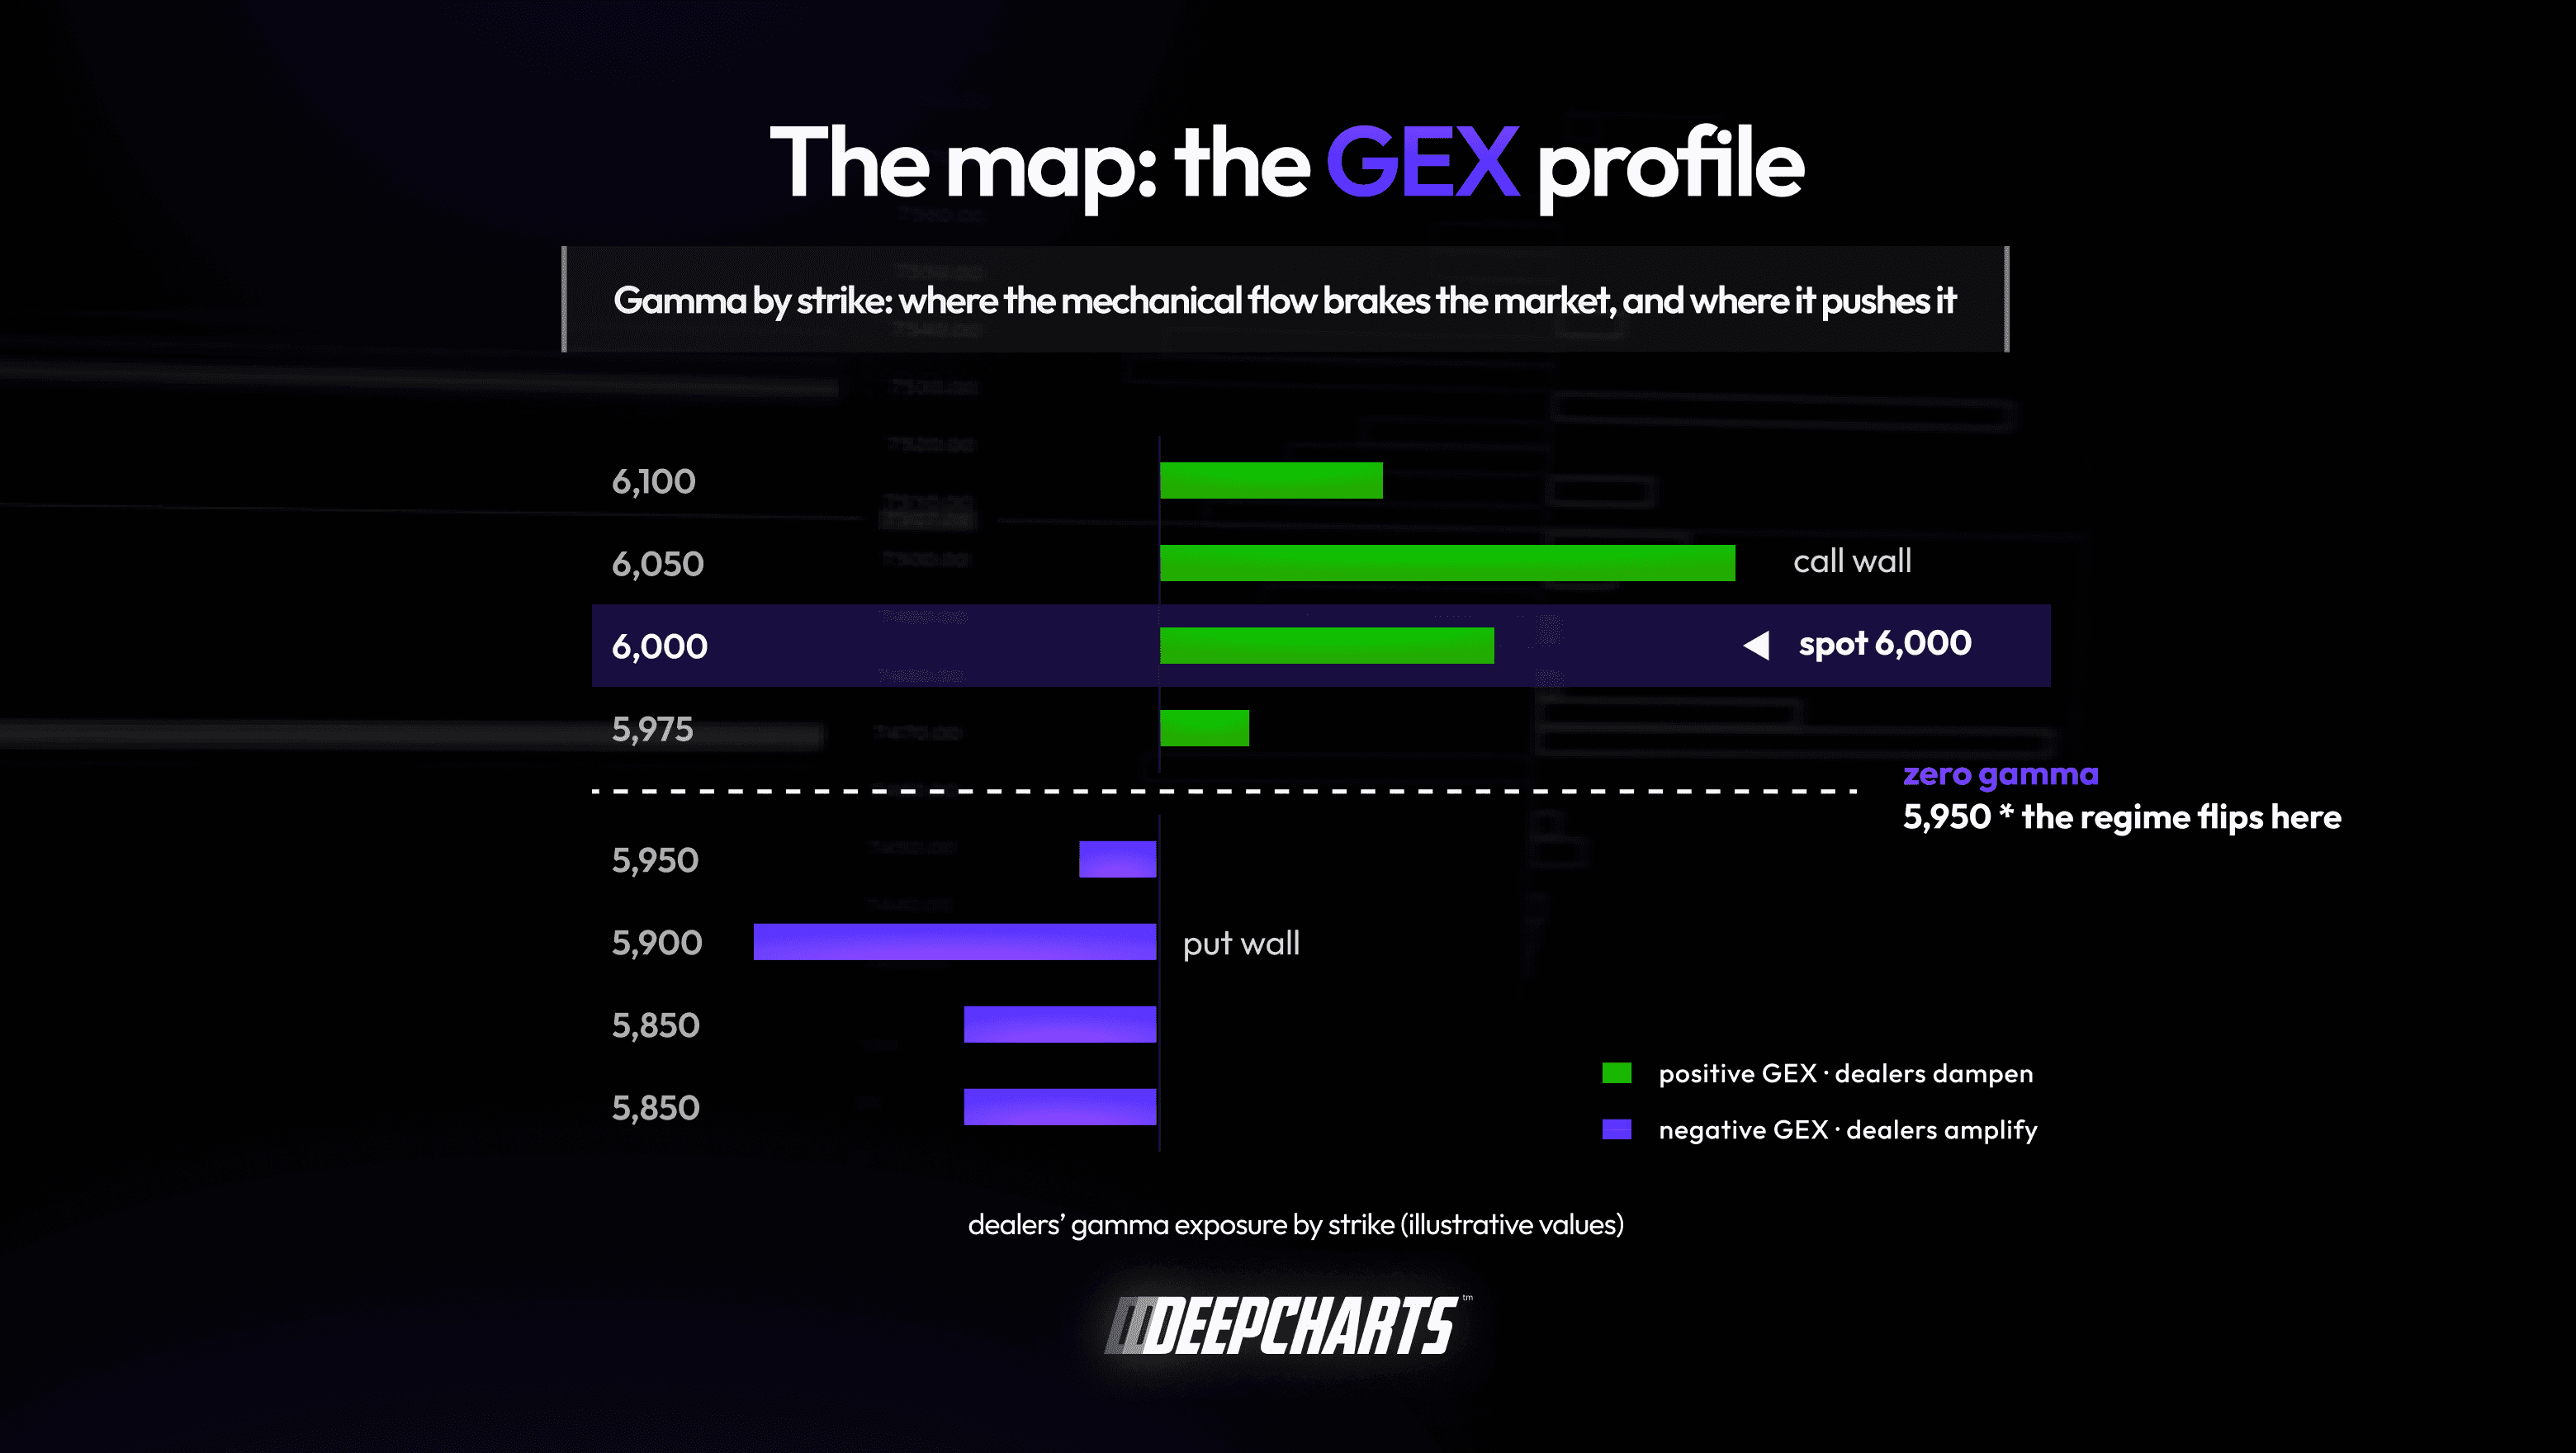
Figure 5 · The GEX profile
A typical session, read through GEX
Let’s put the pieces together with a realistic scenario.
Monday morning. ES is hovering around 6,000. The GEX profile says: call wall at 6,050, put wall at 5,900, zero gamma at 5,950. Aggregate GEX positive. What does the map lead you to expect, before even opening the footprint?
That between 5,950 and 6,050 the working hypothesis is dampened mode: pushes tend to get sold, dips tend to get bought, a lot of work for a few points. That a test of 6,050 should arrive tired, because the higher price climbs into the wall, the more estimated hedging supply it takes on: that’s the zone where you look for absorption, not where you chase the breakout. And that the real alarm bell isn’t 6,050 — it’s 5,950: as long as price holds above it, the map says every dip has a parachute; if it breaks, the same map says dealers collectively switch sides — from buyers of weakness to sellers of weakness — and the road to 5,900 can get much faster than the quiet morning chart suggested.
None of this is a certainty: these are structural tendencies, written from positioning. But notice one thing: you’ve just built a trading plan — where to expect reaction, where to expect acceleration, which level separates the two worlds — using nothing but options positioning. The rest of the session is checking on the tape, level by level, whether the script is being respected.
Why all this “predicts” order flow on the futures
Let’s use the right word. GEX does not predict the direction of the market. No tool does. GEX predicts something subtler and, in some ways, more useful: part of the future flow is already written, because it’s obligatory.
Think about it. Of all the participants trading the ES, almost everyone is free: they can buy, sell, or stay flat. Dealers can’t. If price goes to X, sooner or later they must execute a certain quantity, in a certain direction. They are the only actor in the market whose behavior you can estimate in advance, because it doesn’t depend on what they think — it depends on where price goes and on what they’re carrying. And what they’re carrying is precisely what the exchange’s participant data lets us reconstruct.
For anyone who reads order flow, this changes the questions you ask of the tape.
A wall of offers absorbing every buy right under a big strike, on a positive-gamma day: an institution selling because it knows something, or the book leaning exactly where the map said the pressure should lean? No single print comes labeled “hedge” — but when absorption shows up where the estimated exposure is concentrated, the map is what told you to be watching that level in the first place. A sudden acceleration below zero gamma, with the book emptying and selling calling more selling: the map’s hypothesis is that forced hedging is stacking on top of the panic. Whether it actually is — that session, that level — is what the tape is there to tell you.
In other words: footprint, volume profile and DOM show you the “what”; GEX proposes the “why” — and hands you the address of the next level worth watching. Two halves of the same information.
Three spots where you put the map to the test
Pinning in positive gamma. On quiet days, with high GEX and a big strike near price, the index can look tied to that strike with a rubber band: pushes get sold, dips get bought, and price can spend the whole afternoon grinding around that strike. It’s not magic — it’s consistent with the dealers’ shock absorber doing its job — and it’s one of the reasons some afternoons the market looks dead.
Expirations (OPEX). On the third Friday of the month a huge slice of open interest expires. When sizable positions expire, exposure is removed, rolled or replaced, and the map can change shape quickly. The post-expiration window is worth watching for that reason — as context, not as a directional signal.
0DTE. Today roughly 60% of S&P 500 options volume trades on zero-DTE expirations, and their gamma is enormous but extremely short-lived: it switches on and off within the same session. Positioning that builds and unwinds within hours means the map itself can change regime within the hour — one of the reasons certain US afternoons feel like a different market from the morning, and one more reason a snapshot taken at the open is not enough.
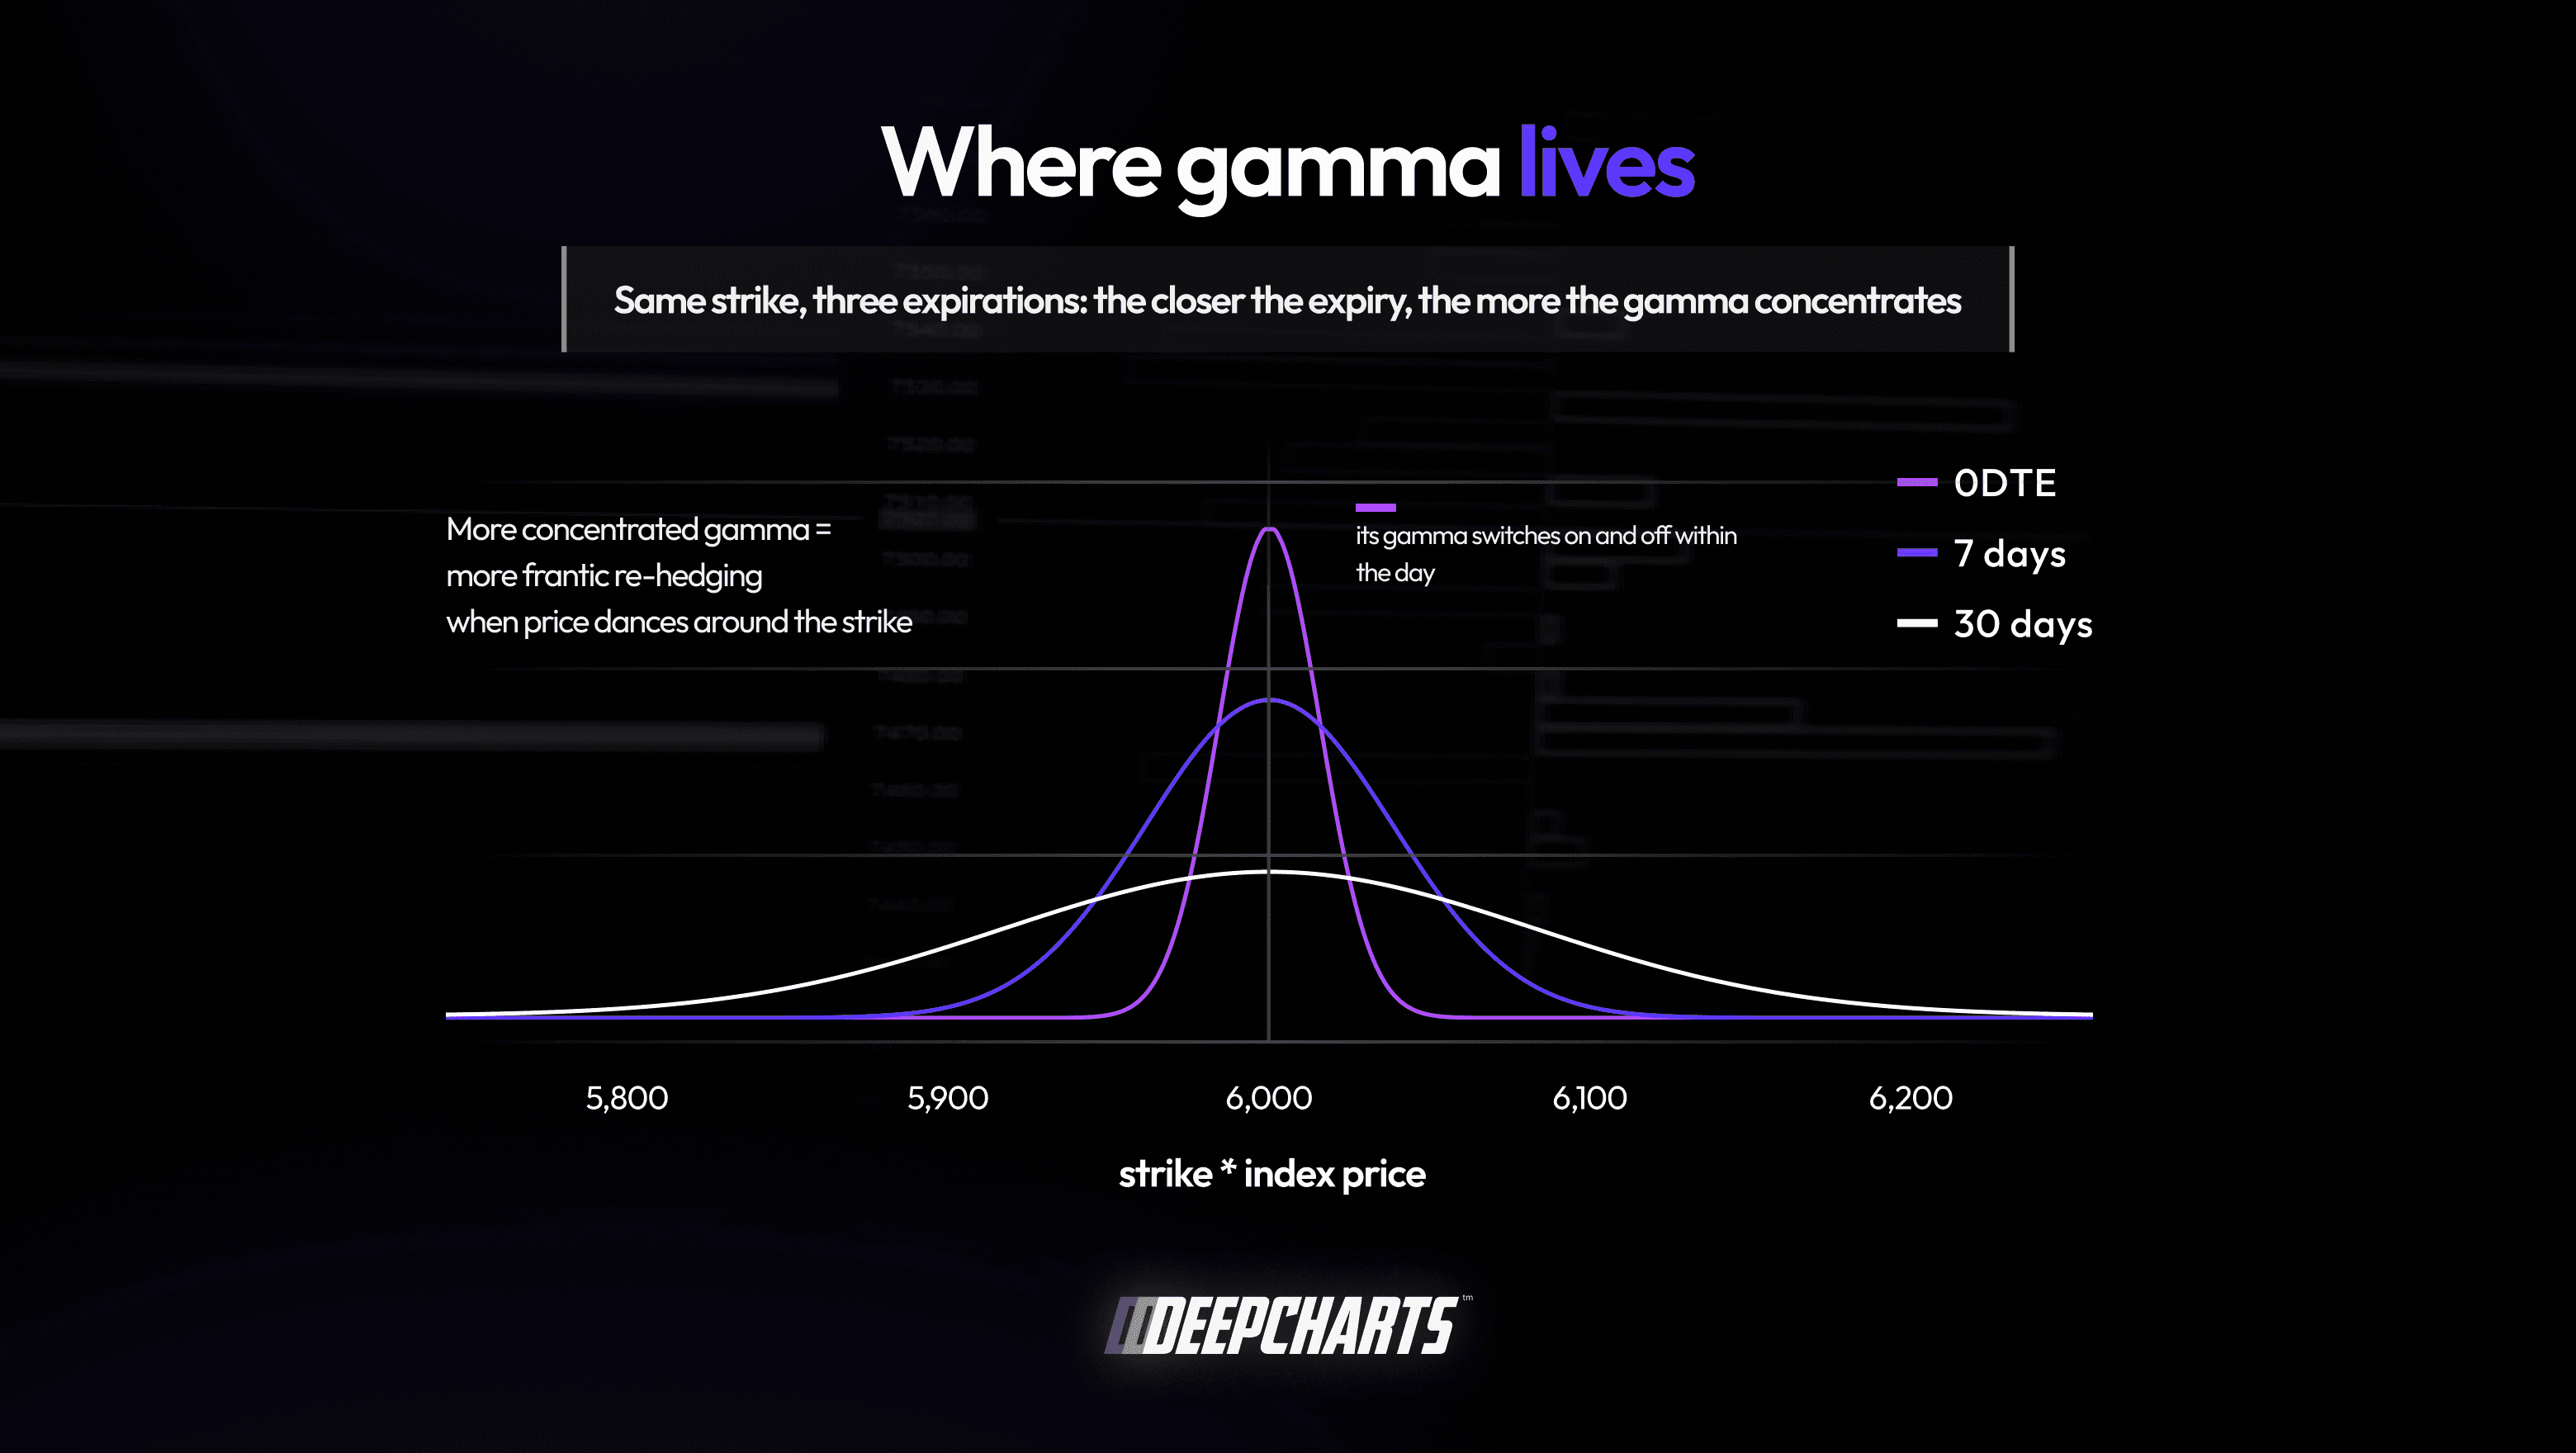
Figure 6 · Where gamma lives
The limits, stated honestly
Better data is not the same thing as certainty, and we’re not going to pretend otherwise.
What we no longer have to guess is who traded. That comes from the exchange. What still requires care is everything downstream of it.
Inventory is accumulated, not photographed. Cboe reports market maker buying and selling volume, but does not flag those trades as opening or closing. Net inventory has to be built by accumulating that flow over time and reading it against the customer open/close side. That’s a reconstruction from reported facts — a very different animal from a convention about who is probably holding what — but it is still a reconstruction.
Gamma comes from a model. Turning open contracts into gamma requires a pricing model and a volatility surface. Different assumptions there move the numbers, though rarely enough to move the levels that matter.
Indices, not single names. SPX is exclusively listed on Cboe, so coverage there is complete. On multi-listed single-stock options it isn’t, and any gamma map — ours included — deserves more caution.
We wrote the whole chain down. What is observed, what is reconstructed, what is modeled, and what remains a hypothesis to verify — it’s all in How we build it, our methodology page. We’d rather you read it than take the map on faith.
And it is still not an entry signal. It’s context. It tells you which regime you’re in, where a move will find fuel and where it will find sand. The trading decision remains an order flow job: you need to see how price arrives at a gamma level, who absorbs, who attacks.
And that’s exactly where the two kinds of analysis lock together.
If you only remember three things
One. Dealers are the market’s insurers: they sell policies (options) and want no directional risk. That’s why they hedge their delta with futures, continuously. Part of the volume on the ES is this, every single day — a small, uneven slice, but a forced one.
Two. The sign of gamma decides the direction of the hedging. Dealers long gamma: they sell strength and buy weakness — the market tends to compress. Dealers short gamma: they buy strength and sell weakness — the market tends to extend. Same mechanism, opposite regimes.
Three. GEX maps all of this in advance, strike by strike: where the walls are, where zero gamma sits, how much mechanical fuel there is on each side. It doesn’t tell you where price will go — it tells you where the forced flow, if it shows up, should concentrate. And the map is worth exactly as much as the positioning underneath it, which is why ours is built on Cboe’s reported market maker data instead of on a convention about who is holding what.
Where we’re going with this
If you’ve read this far, you’ve already written the conclusion yourself. On one side, a map of the levels where the dealers’ mechanical flow should switch on. On the other, the tools — footprint, DOM, volume profile — to see, in real time, whether it’s actually happening there.
Until today, putting the two together meant an order flow platform on one screen and, next to it, spreadsheets and third-party gamma services. The free ones guess the dealer’s side. Most of the expensive ones guess it too.
We never liked either half of that arrangement. So at deepcharts we did the slow, expensive thing and licensed the data at the source. GEX is coming to where it belongs — on the chart, next to the flow — and it will be built on Cboe’s reported market maker positioning, not on a convention.
In the meantime, the next time you watch the ES nail itself to a level “for no reason”, you’ll know where to look: somewhere out there, someone is just doing insurance. Soon you’ll also have our best reconstruction of how much of it they still have left to do.
Continue Learning: The Full DeepGamma Bootcamp
The playlist covers gamma exposure, key levels, dealer hedging flows, and how to read them alongside order flow.

Deepcharts Team
·
Share this on
