Indicatori
Updated:
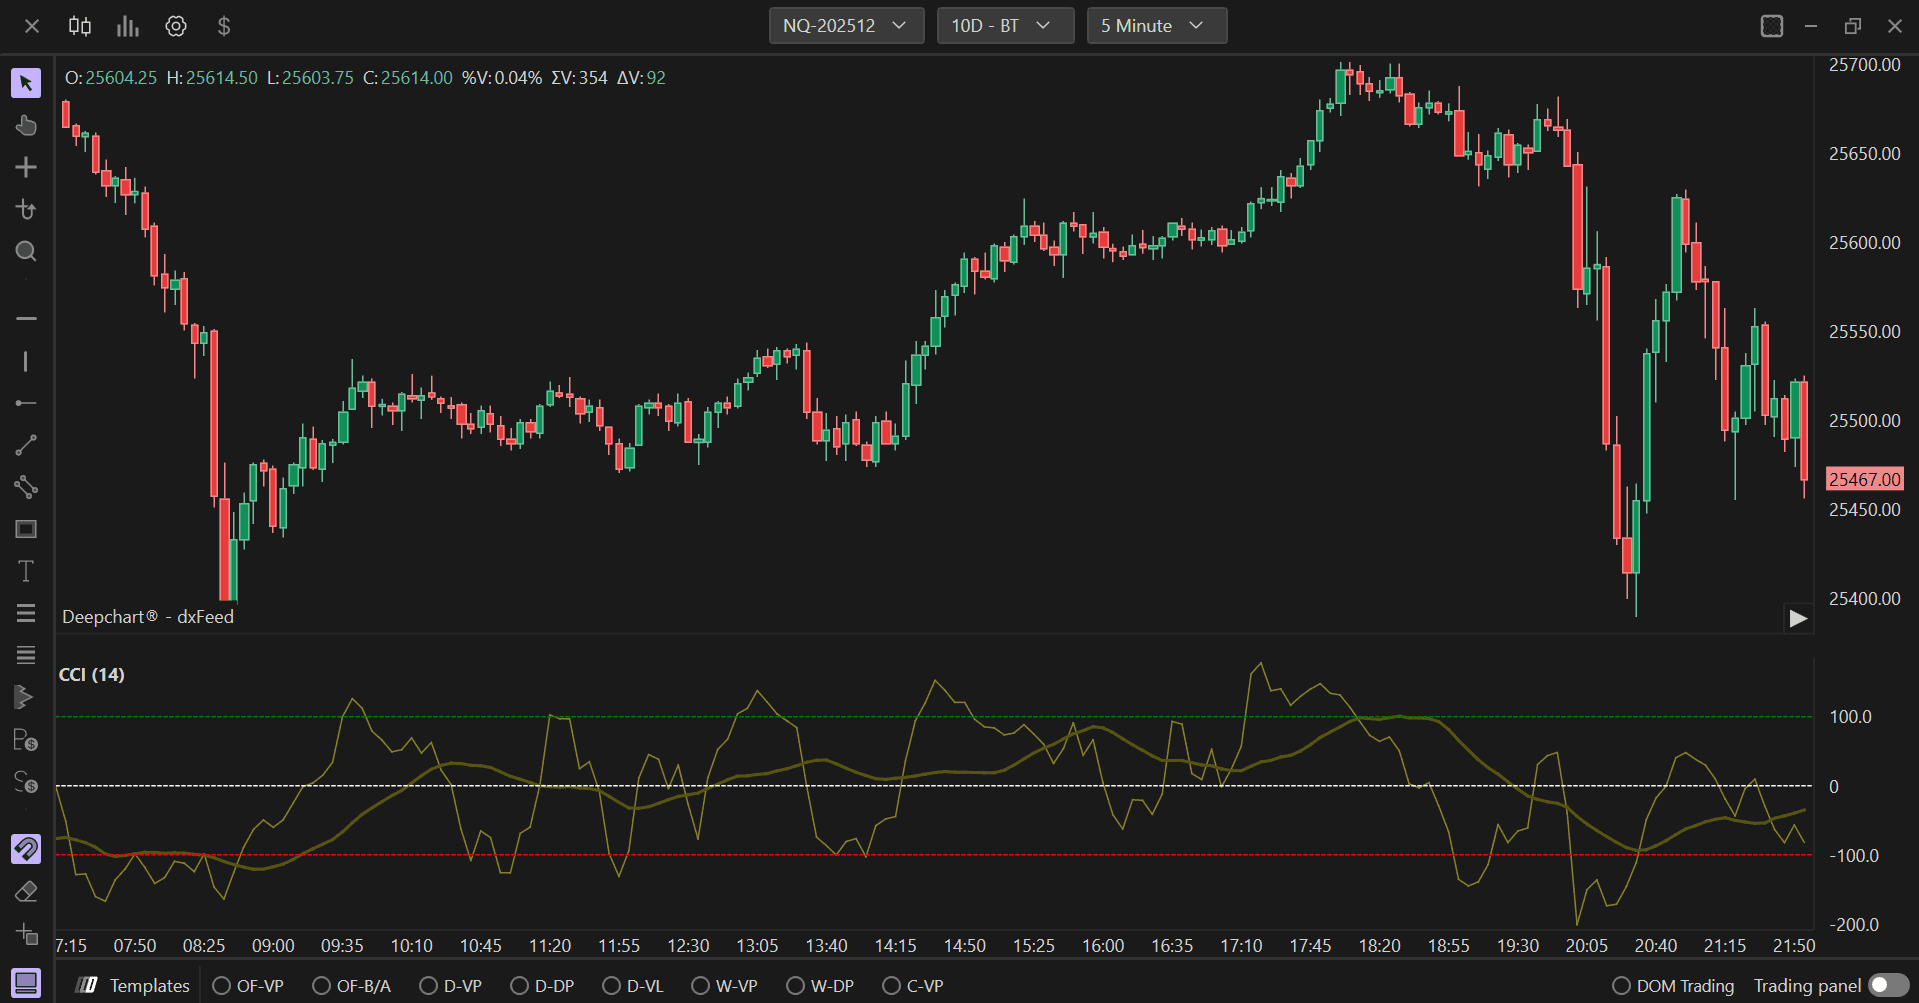
Il CCI (Commodity Channel Index) è un indicatore di analisi tecnica sviluppato da Donald Lambert negli anni '80. In origine progettato per identificare i cicli delle materie prime, oggi viene utilizzato anche per altri asset, come azioni, valute e indici.
Il CCI misura la deviazione del prezzo di un asset dal suo valore medio statistico, indicando quanto il prezzo si discosta dal suo livello medio in un dato periodo. Aiuta a determinare quando un asset è in ipercomprato o ipervenduto.
Utilizzo delle impostazioni
Facendo clic sull'icona delle impostazioni dell'indicatore si apre la finestra di configurazione, all'interno della quale è possibile effettuare diverse scelte relative alla funzionalità dell'indicatore.
Parametri
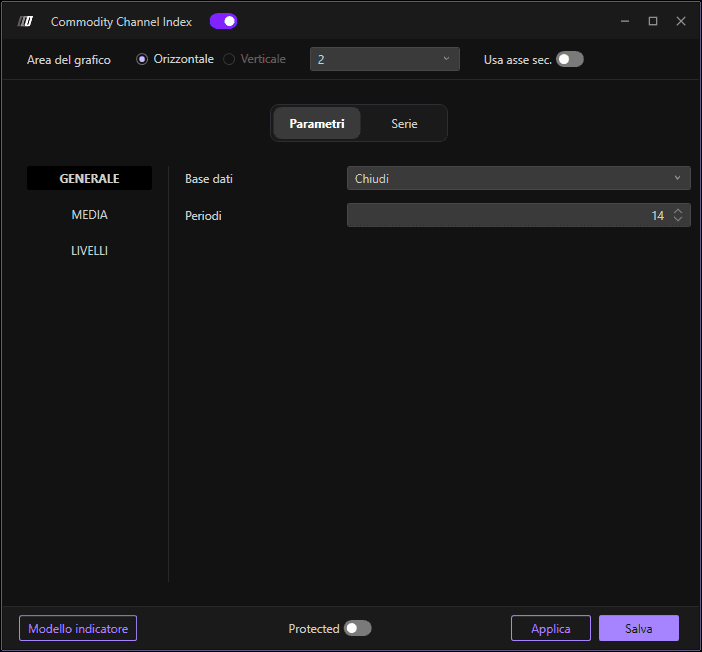
Nella sezione Parametri, troviamo diverse sotto-sezioni:
Generale
Dati di input: Imposta la fonte dei dati per il calcolo del CCI
Periodi: Definisci il numero di periodi da utilizzare nel calcolo del CCI
Media
Abilita: Attiva o disattiva la media
Tipo di media: Scegli il tipo di media (semplice, esponenziale, ecc.)
Periodi: Imposta il numero di periodi per il calcolo della media
Livelli
Valore del livello: Definisci il valore del livello di ipercomprato/ipervenduto
Colore dello zero: Imposta il colore della linea dello zero
Sottografici
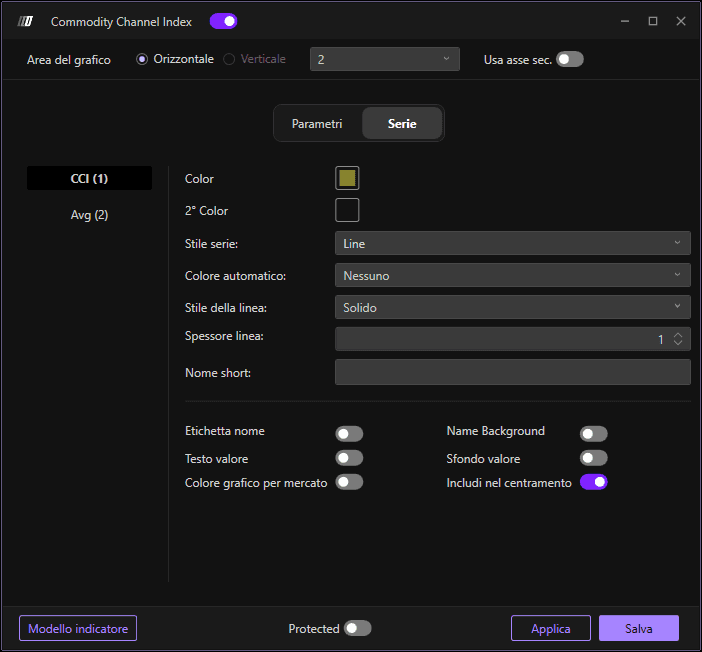
Nella sezione Serie, puoi impostare il colore e lo stile del CCI e della media:
Colore CCI: Imposta il colore principale della linea CCI
Colore secondario: Imposta un colore secondario opzionale
Colore automatico: Imposta il colore della linea della media
Stile del sottografico: Scegli lo stile di visualizzazione
Stile della linea: Definisci lo stile della linea
Larghezza della linea: Definisci lo spessore della linea
Usa asse secondario: Opzione per visualizzare su un asse secondario