Indicatori
Updated:
L’indicatore Ichimoku, noto anche come "Ichimoku Kinko Hyo," è uno strumento di analisi tecnica sviluppato dal giornalista giapponese Goichi Hosoda negli anni '30. È uno strumento di analisi tecnica completo che consente di identificare supporto e resistenza, determinare il trend e misurare il momentum.
L’indicatore è composto da 4 linee principali e da una nuvola chiamata "Kumo."
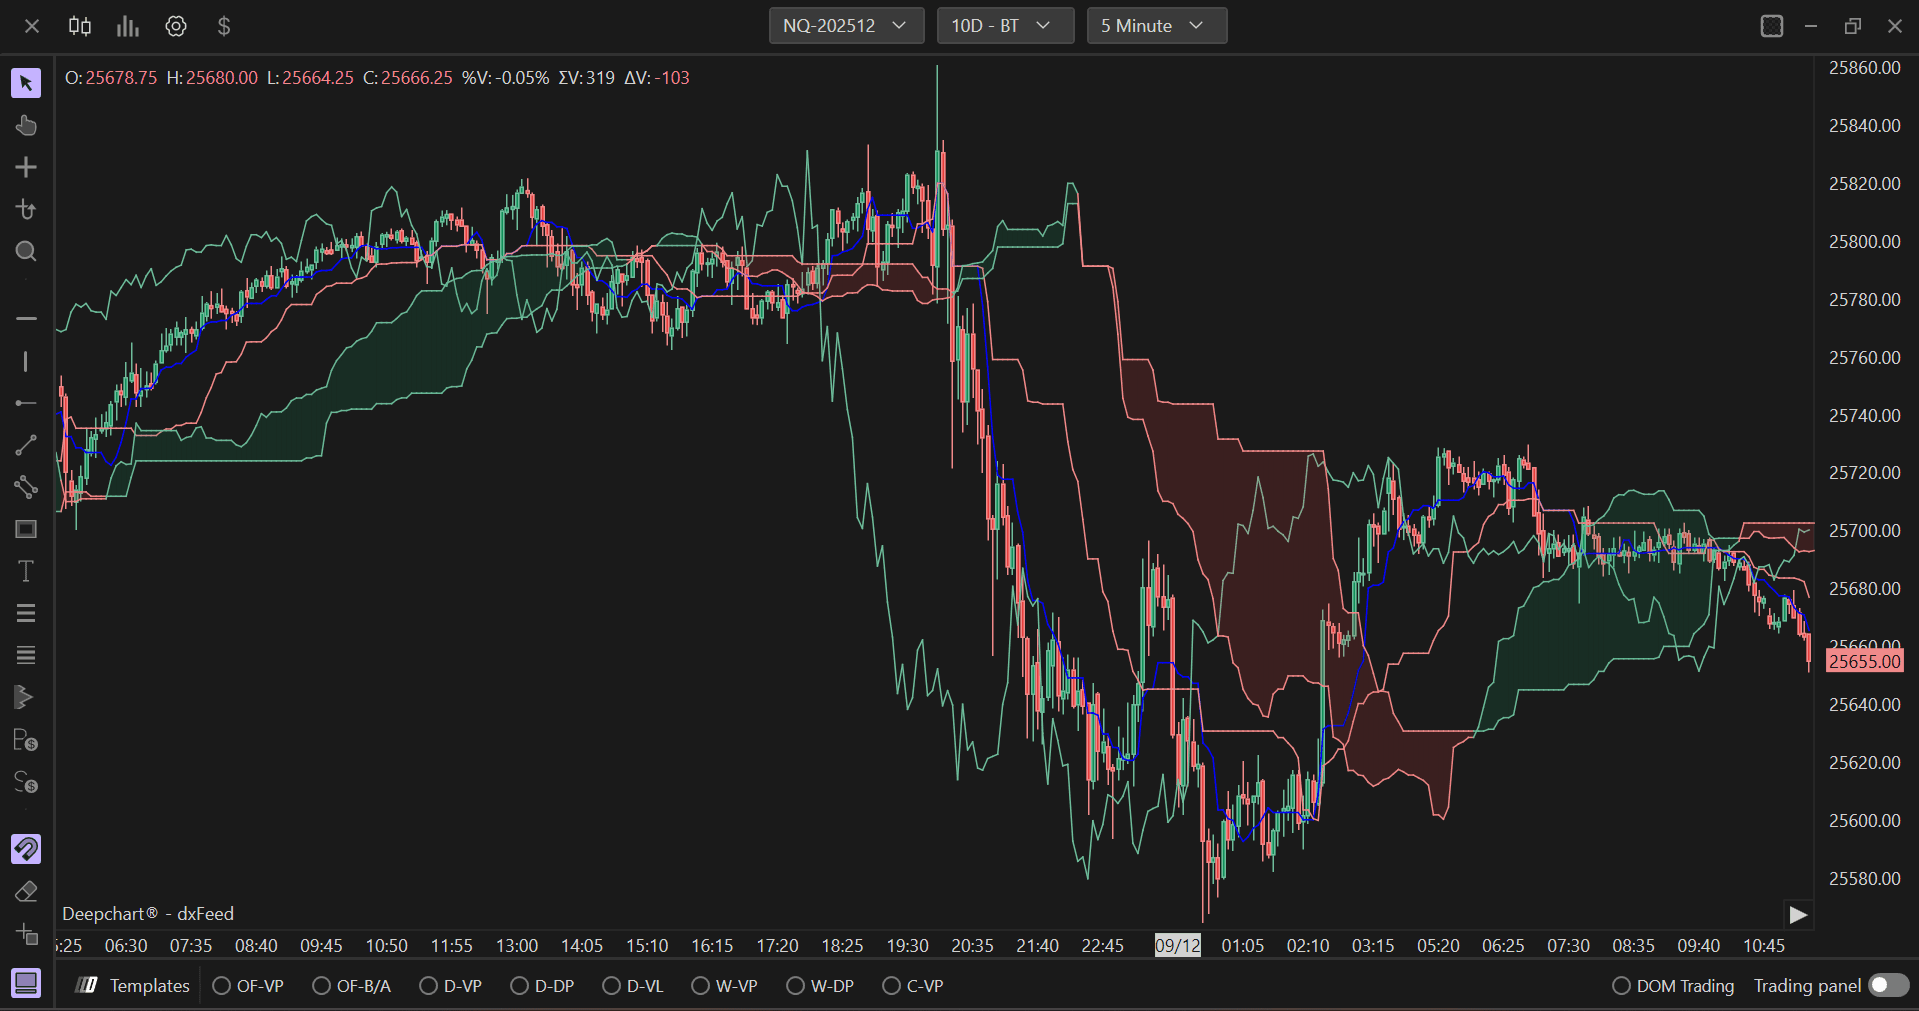
Componenti Ichimoku
Tenkan-sen (Linea di conversione): Calcolata come la media dei massimi e dei minimi degli ultimi 9 periodi. Serve come indicatore a breve termine per la direzione del trend.
Kijun-sen (Linea base): La media dei massimi e dei minimi degli ultimi 26 periodi. Agisce come supporto/resistenza e può essere utilizzata per identificare potenziali cambiamenti di trend.
Chikou Span (Linea di ritardo): Rappresenta il prezzo di chiusura spostato indietro di 26 periodi. Viene utilizzata per confrontare il prezzo attuale con il movimento dei prezzi passato.
Senkou Span: Calcolata come la media di Tenkan-sen e Kijun-sen, proiettata in avanti di 26 periodi. Forma una delle due linee che creano la "nuvola" (Kumo).
Utilizzo delle impostazioni
Facendo clic sull’icona delle impostazioni dell’indicatore si aprirà la sua finestra di configurazione, nella quale è possibile effettuare diverse scelte riguardo alla funzionalità dell’indicatore.
Parametri
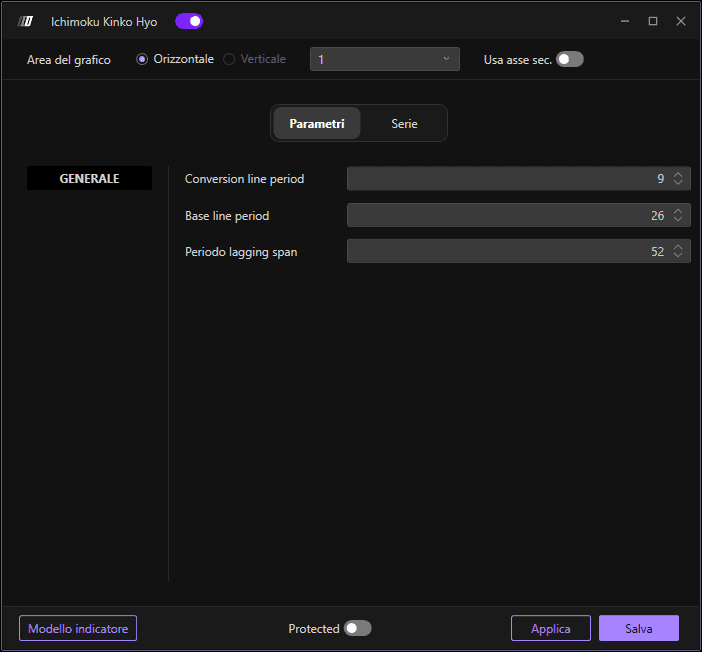
Nella sezione Parametri puoi impostare il periodo di:
Periodo della linea di conversione: Periodo per il calcolo della Tenkan-sen (predefinito: 9 periodi)
Periodo della linea base: Periodo per il calcolo della Kijun-sen (predefinito: 26 periodi)
Periodo della linea di ritardo: Periodo per il calcolo della Chikou Span (predefinito: 26 periodi)
Sottografici
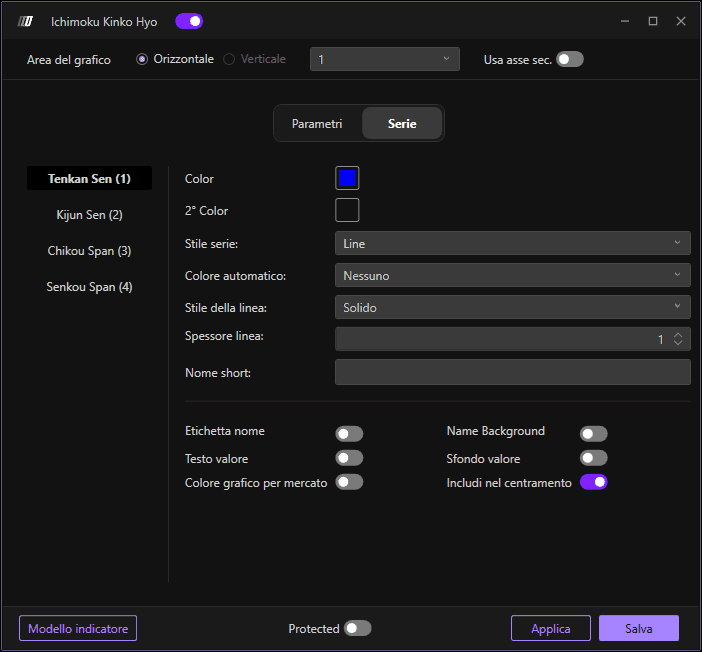
Nella sezione Sottografi puoi impostare i colori e lo stile di:
Colore Tenkan-sen: Imposta il colore della linea di conversione
Colore Kijun-sen: Imposta il colore della linea base
Colore Chikou Span: Imposta il colore della linea di ritardo
Colore Senkou Span: Imposta il colore delle linee della nuvola
Stile del sottografico: Scegli lo stile di visualizzazione
Stile linea: Definisci lo stile della linea
Spessore linea: Definisci lo spessore delle linee
Usa asse secondario: Opzione per visualizzare su un asse secondario