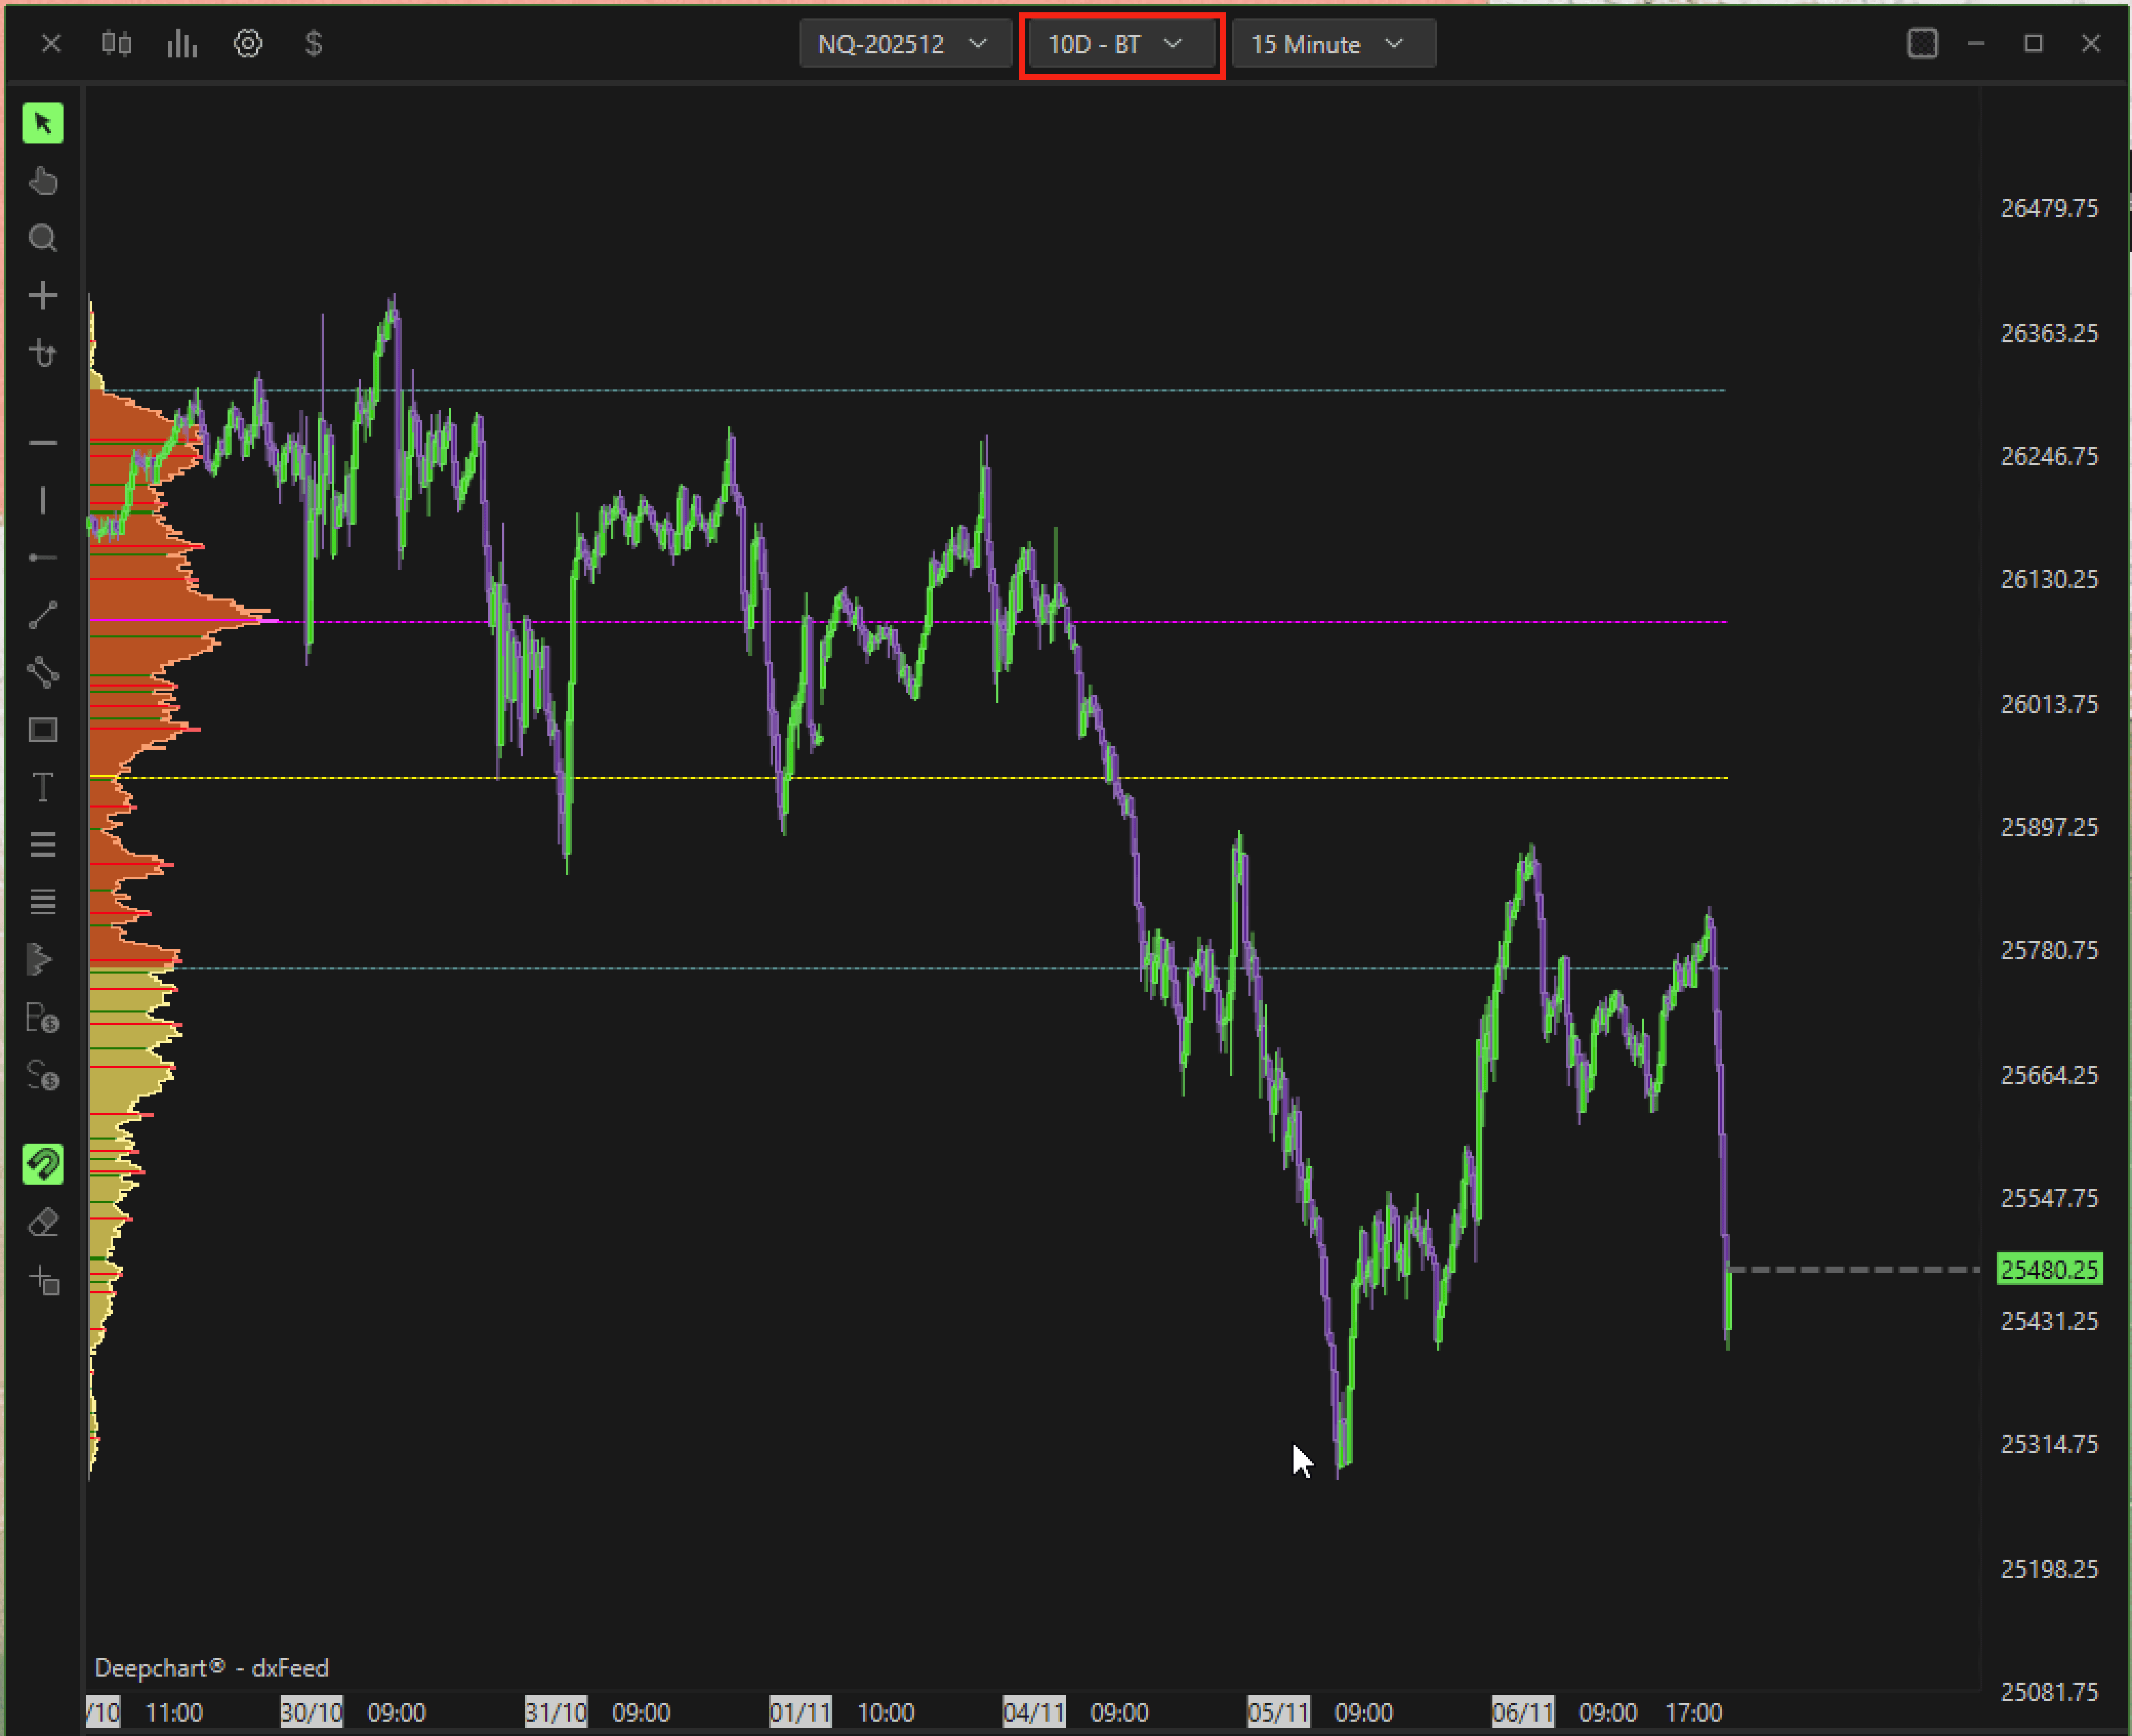
Indicatori avanzati
Updated:
L'indicatore Deep Profile viene usato per tracciare diversi tipi di profili di volume e delta.
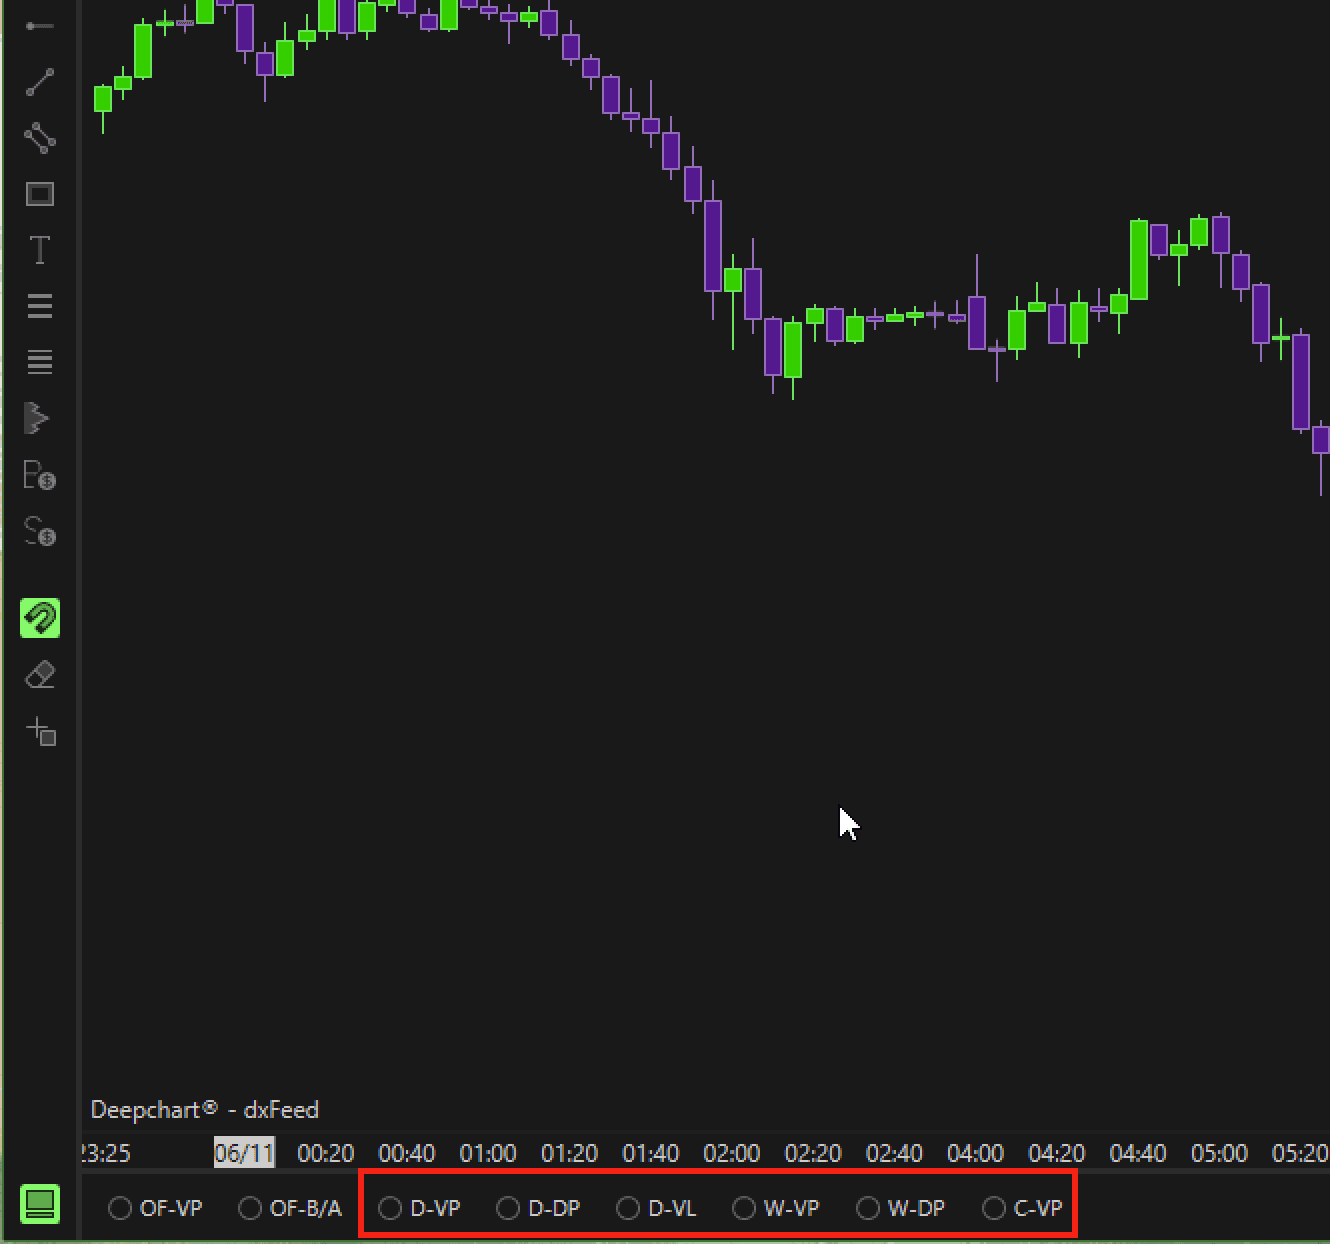
Puoi abilitarlo facendo clic su uno qualsiasi dei pulsanti del profilo mostrati qui sotto.
Tutti questi profili usano lo stesso indicatore (Deep Profile), ma con impostazioni diverse.
1.Impostazioni generali
Nelle Impostazioni generali dell'indicatore troverai diversi campi di configurazione.
1.1 Tipo VBP
Questa impostazione ti consente di scegliere quale tipo di profilo vuoi tracciare.
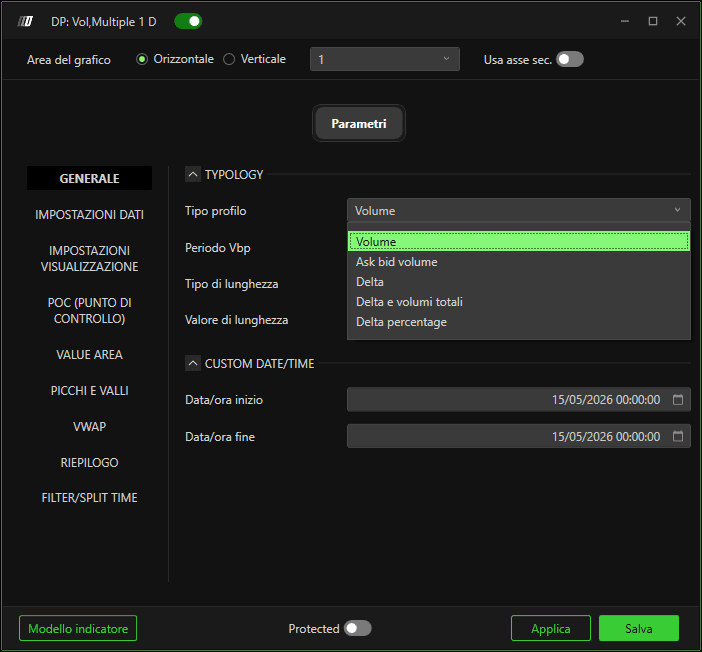
I tipi di profilo disponibili sono:
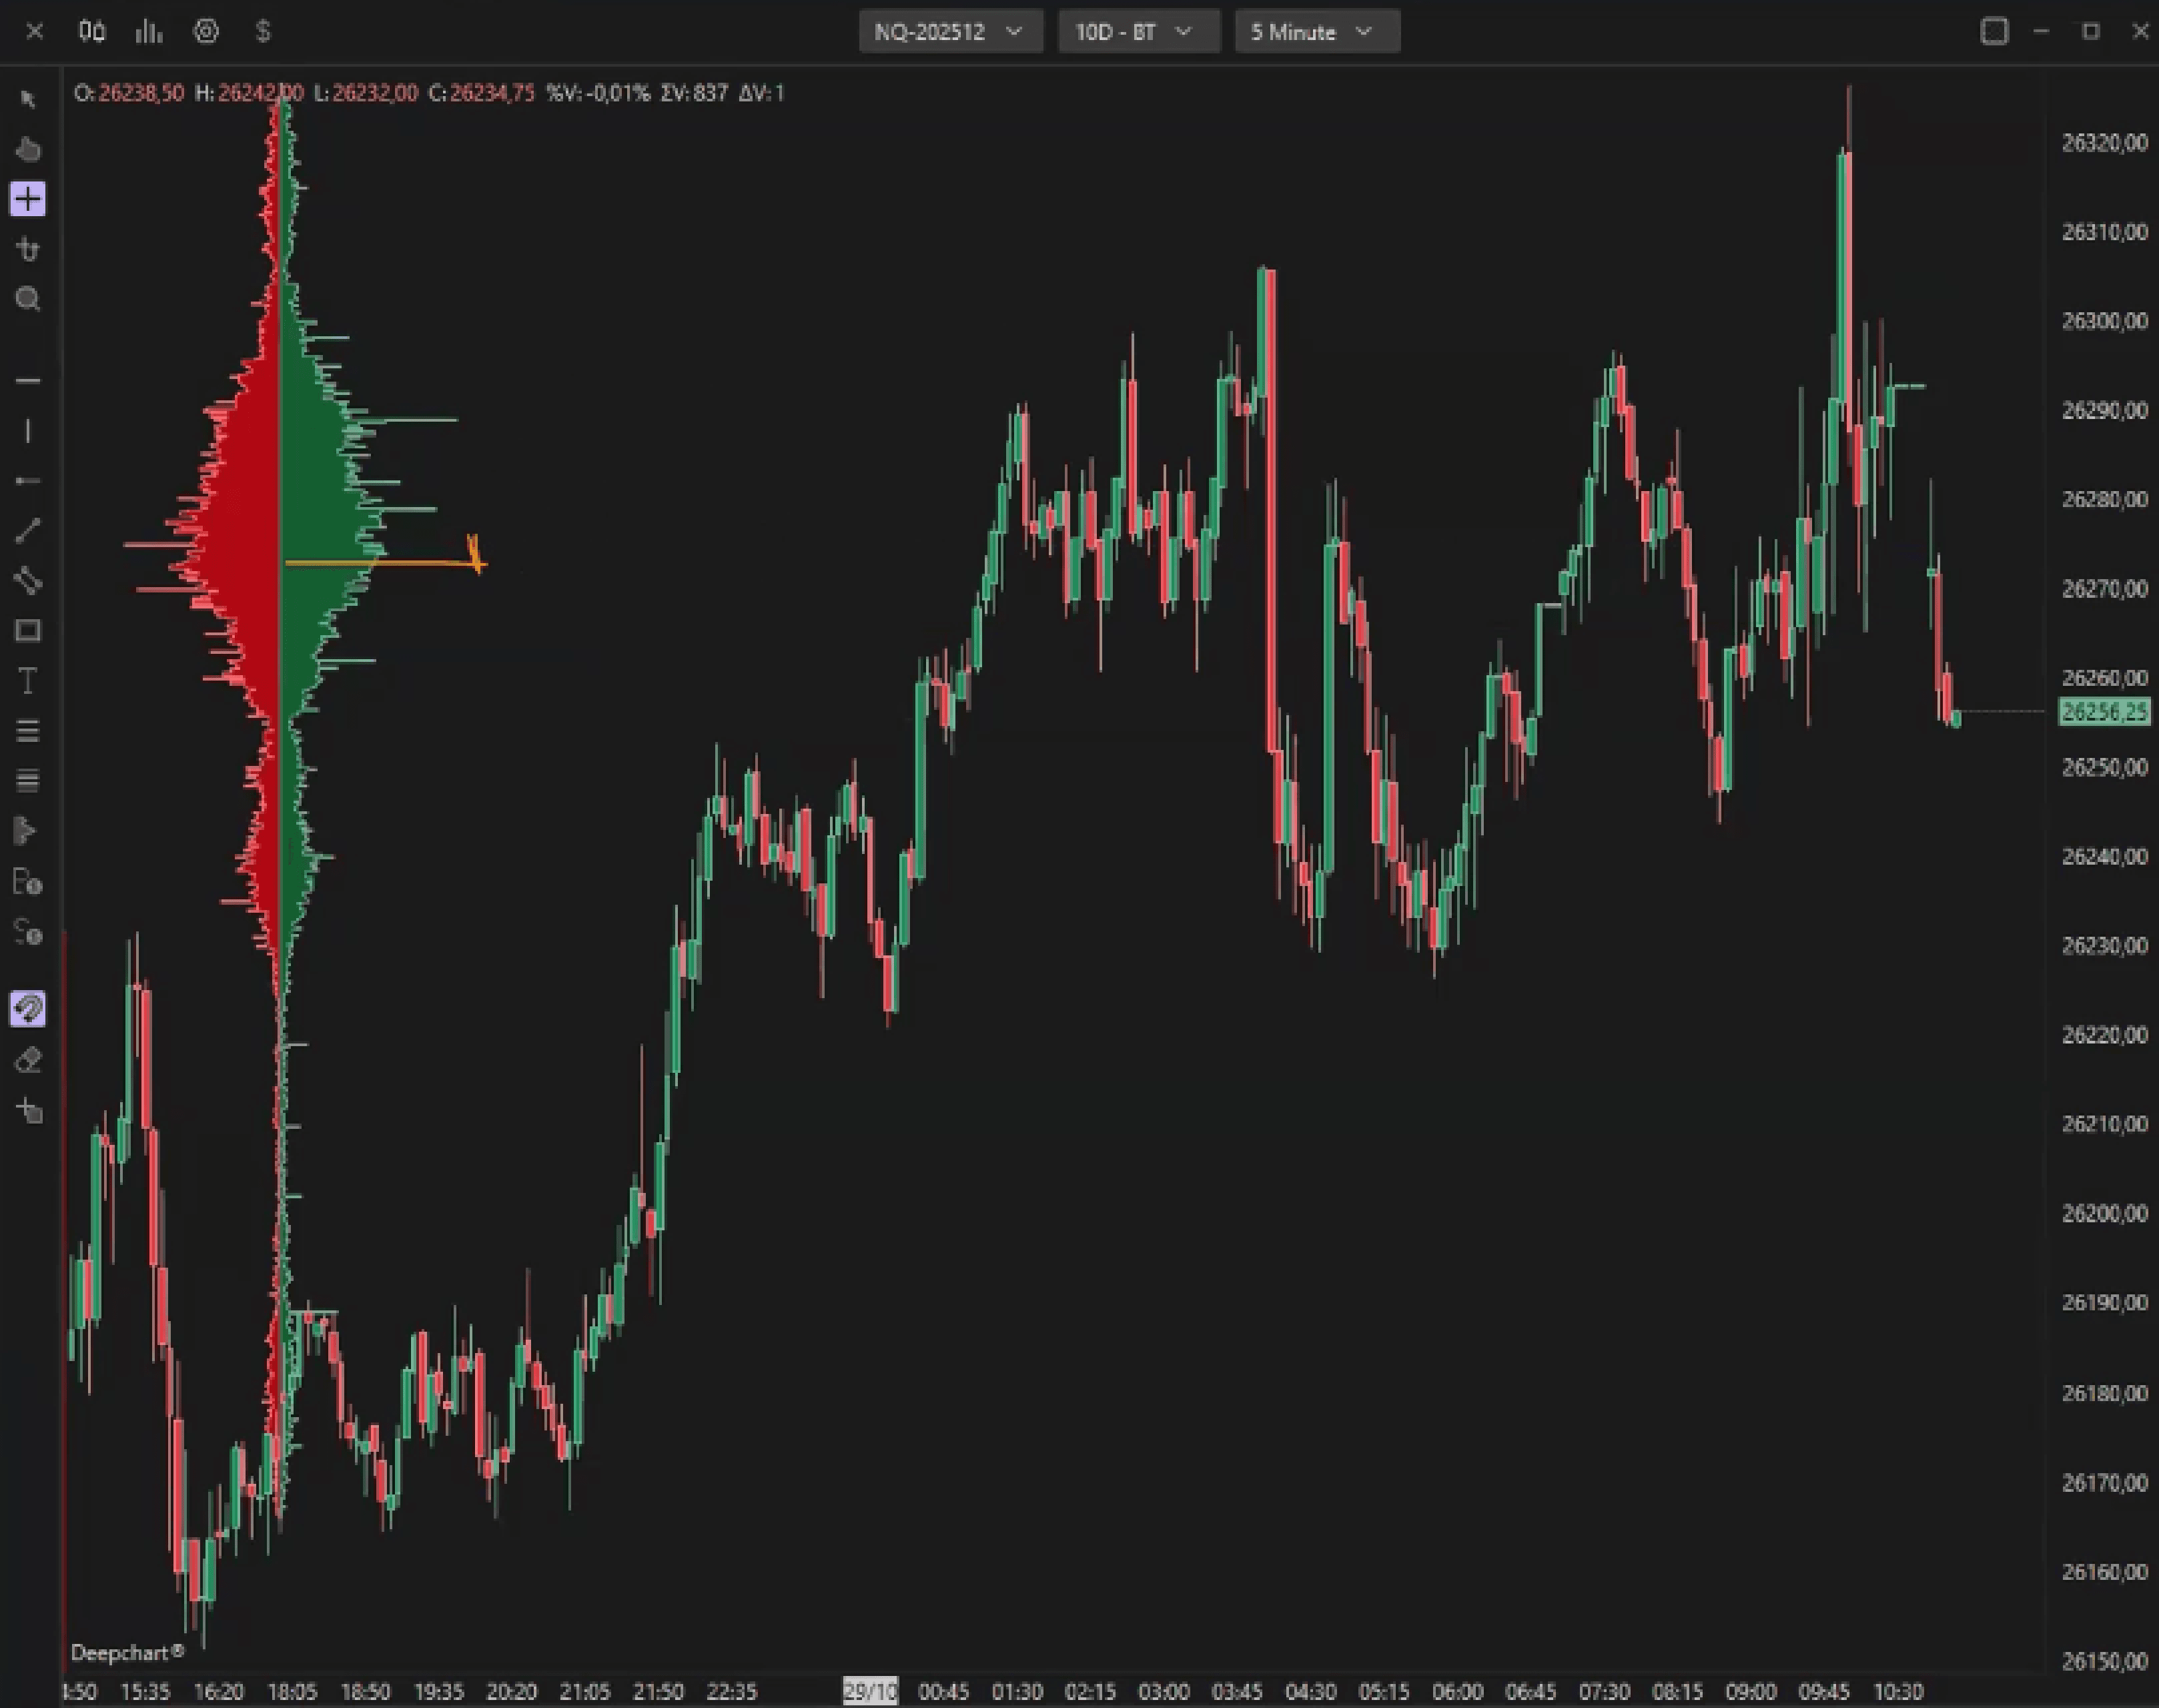
1.1.1 Profilo Volume
Questo profilo si basa esclusivamente sul volume totale scambiato a ciascun livello di prezzo.
Aiuta a individuare i livelli di prezzo in cui si è concentrata la maggiore attività.
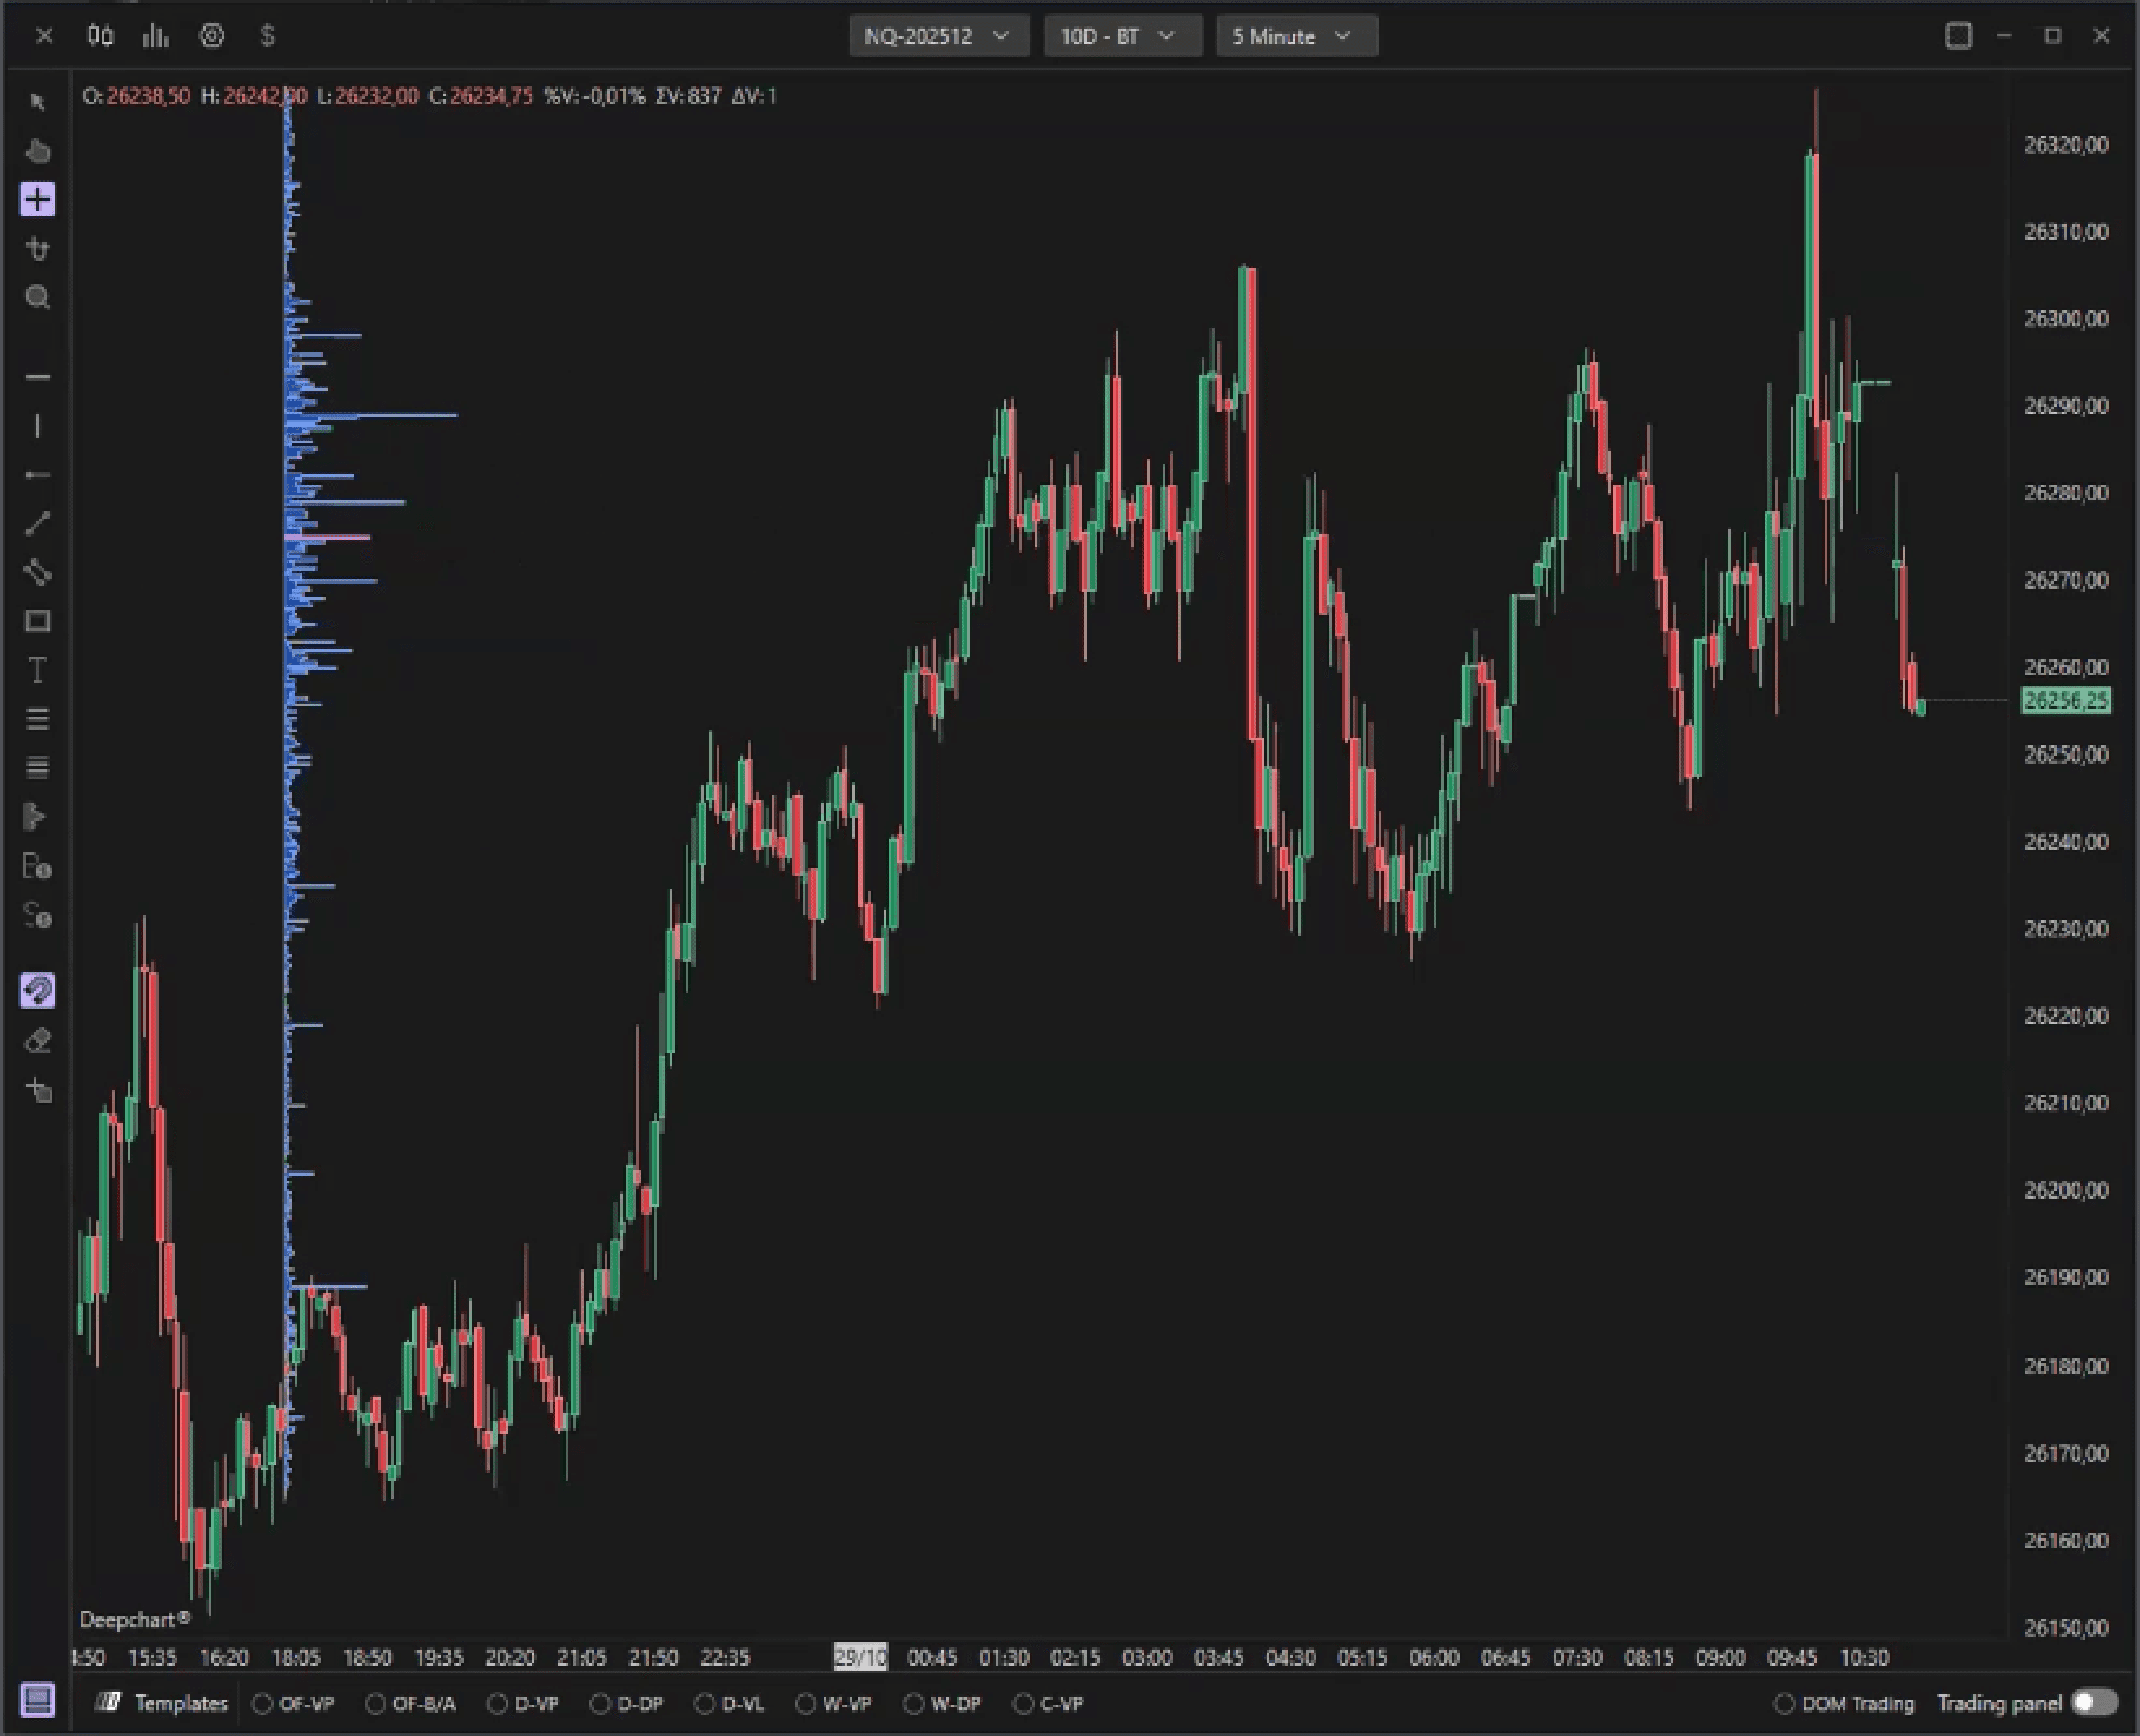
1.1.2 Profilo volume Ask/Bid
Questa versione separa il Volume Ask (pressione d'acquisto) e il Volume Bid (pressione di vendita), consentendoti di confrontare l'aggressività su entrambi i lati del mercato.
1.1.3 Profilo Delta
Questo profilo si basa sul delta — la differenza tra acquirenti e venditori aggressivi a ciascun livello di prezzo.
1.1.4 Delta e volume totale
Questa modalità combina entrambi — mostrando il delta sul lato sinistro e il volume totale sul lato destro del profilo.
1.2 Periodo VBP
Il Periodo VBP definisce l'intervallo di tempo o l'ambito dei dati per cui viene tracciato il profilo.
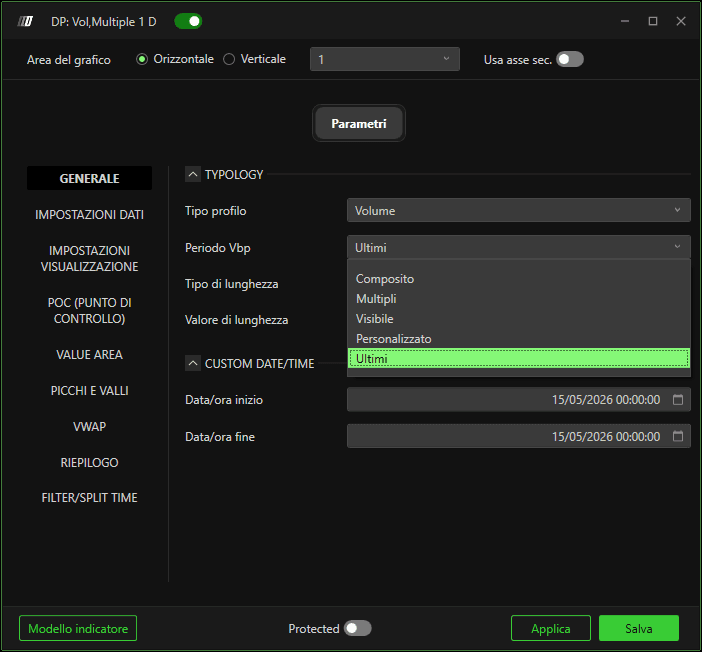
Abbiamo i seguenti valori per questo campo
1.2.1 Profilo in tempo reale
Traccia solo il profilo più recente.
Ad esempio, se selezioni un profilo giornaliero e imposti il Periodo VBP su Più recente, verrà visualizzato solo il profilo del giorno corrente.
1.2.2 Multipli
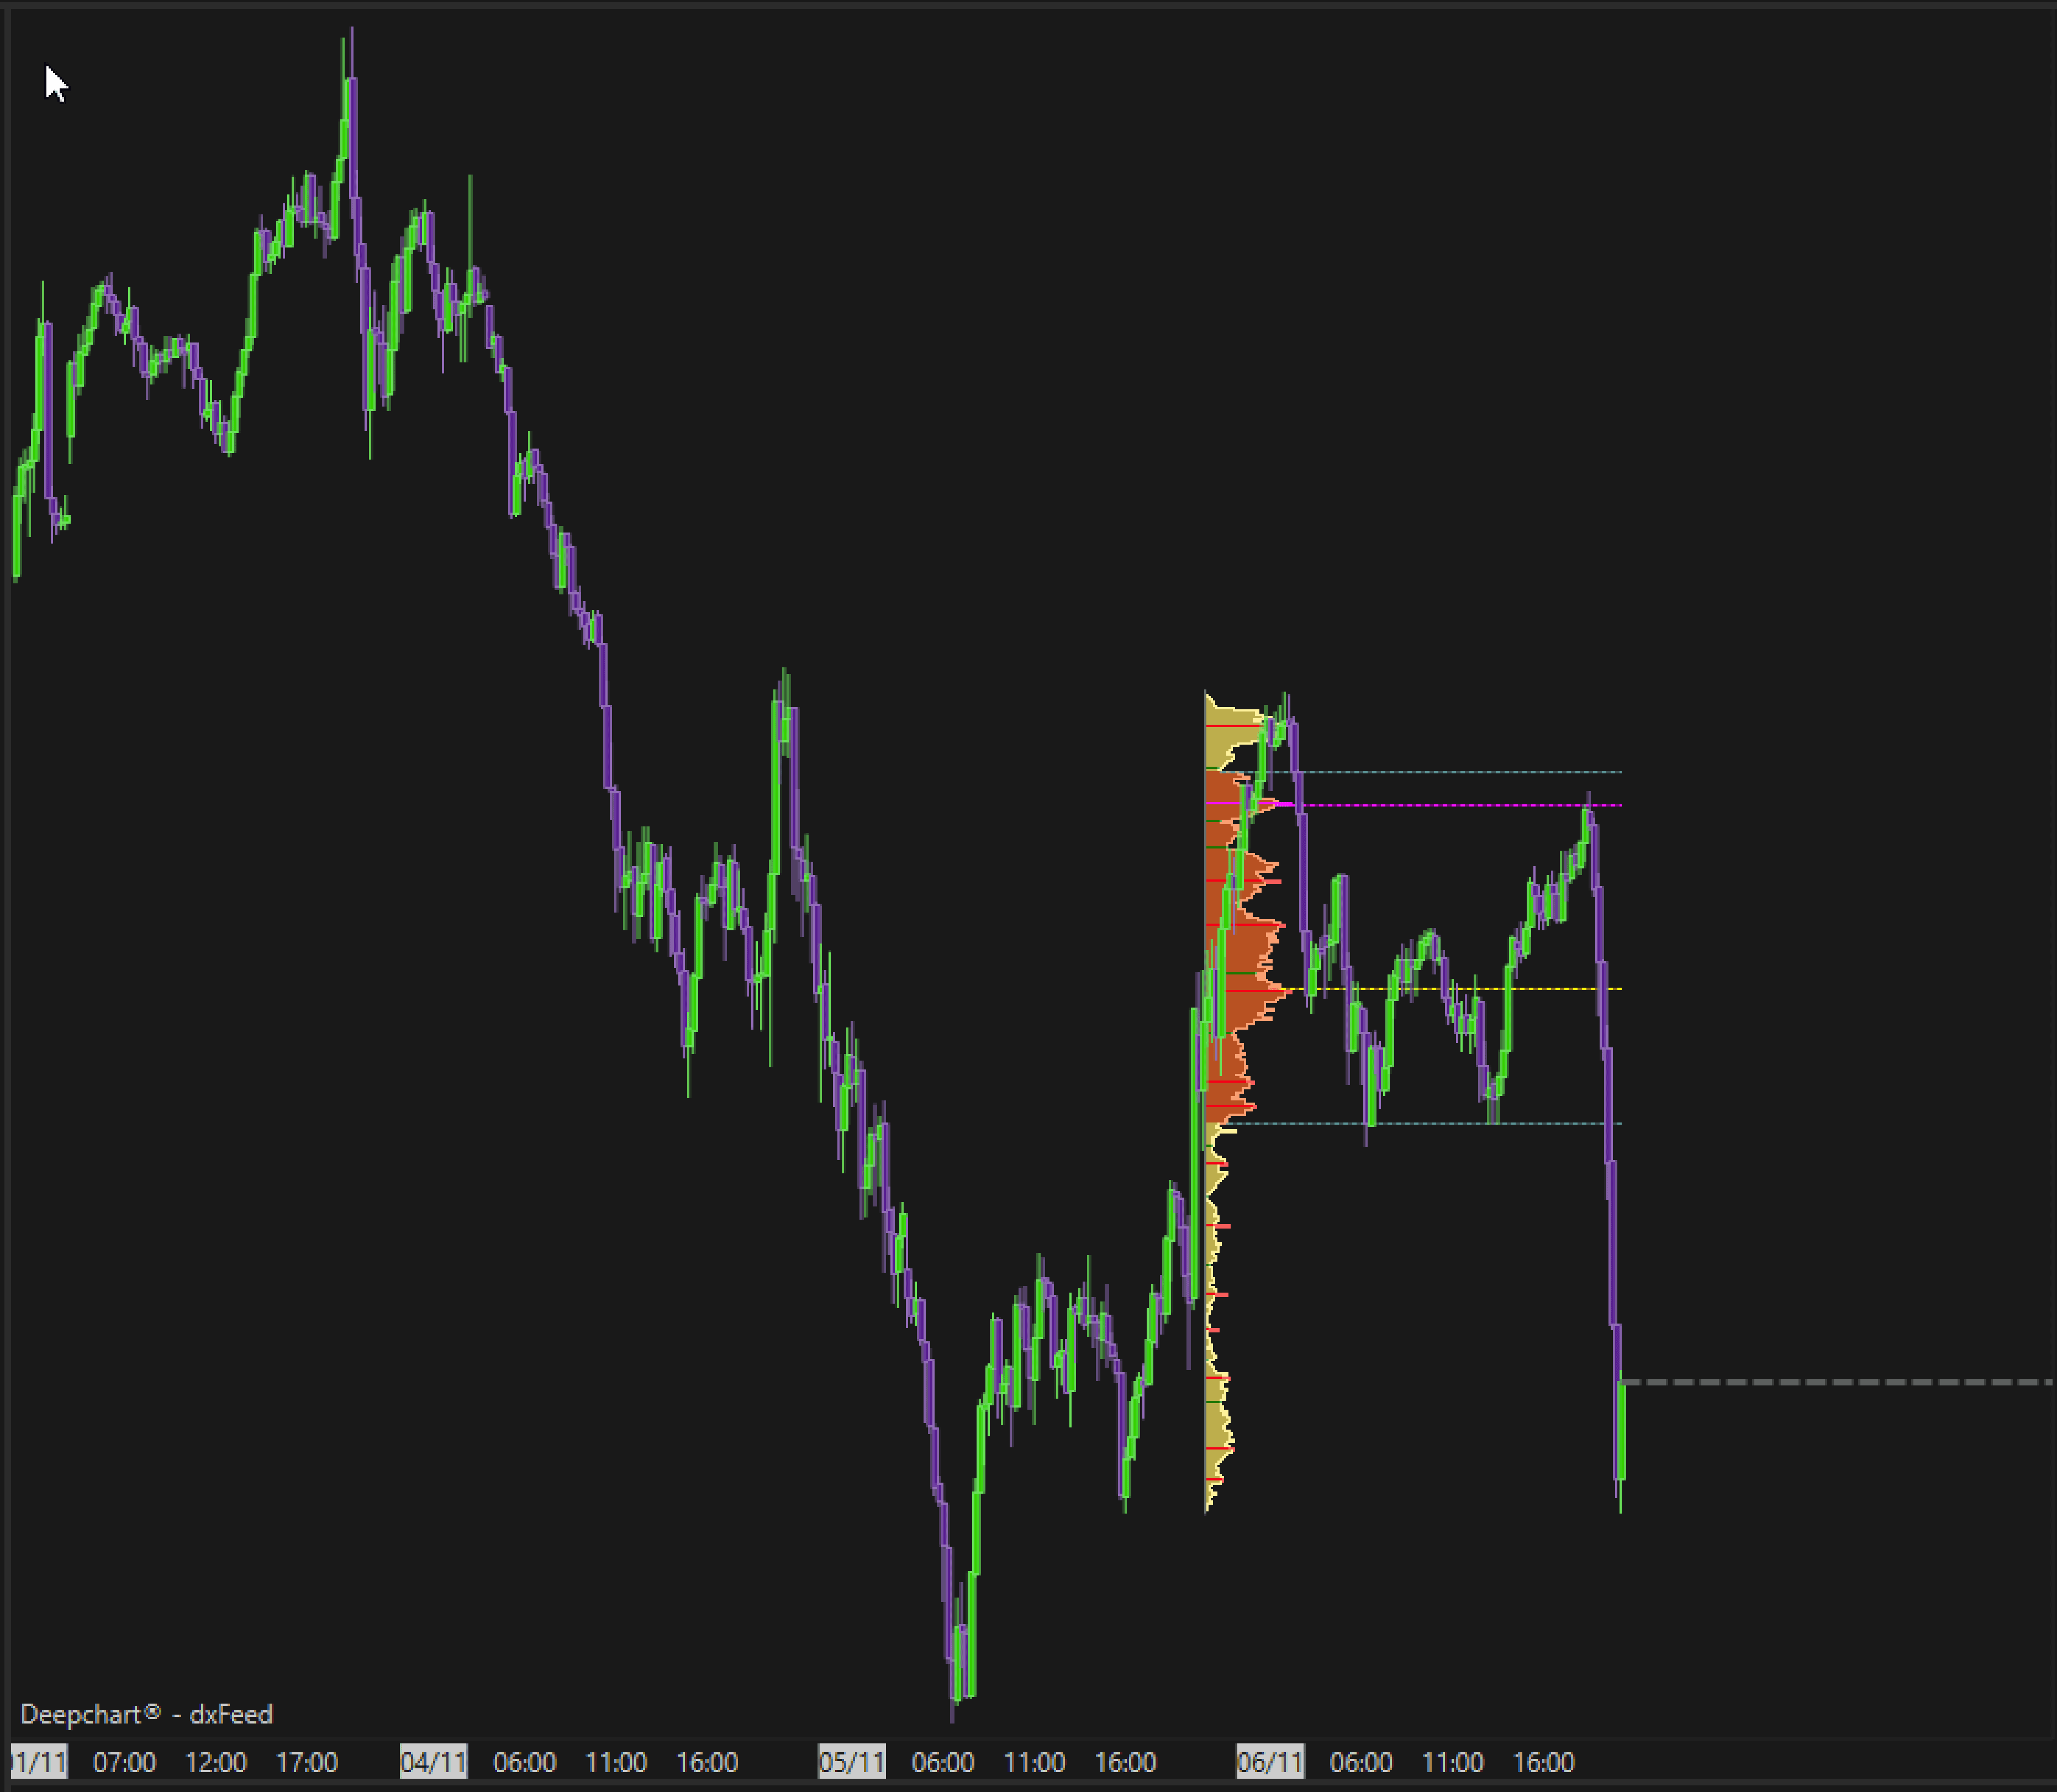
Traccia più profili in base al periodo di tempo selezionato.
Ad esempio, puoi vedere profili separati per ogni giorno, sessione o ora.
1.2.3 Composito
Traccia un singolo profilo per tutti i dati caricati.
Ad esempio, se il tuo grafico ha 10 giorni di dati caricati e selezioni Composito, verrà creato un unico profilo combinato per l'intero periodo di 10 giorni.
1.2.3 Visibile
Crea un profilo solo per i dati attualmente visibili sul tuo grafico.
Quando scorri o fai zoom, il profilo si aggiorna automaticamente per riflettere l'intervallo visibile.
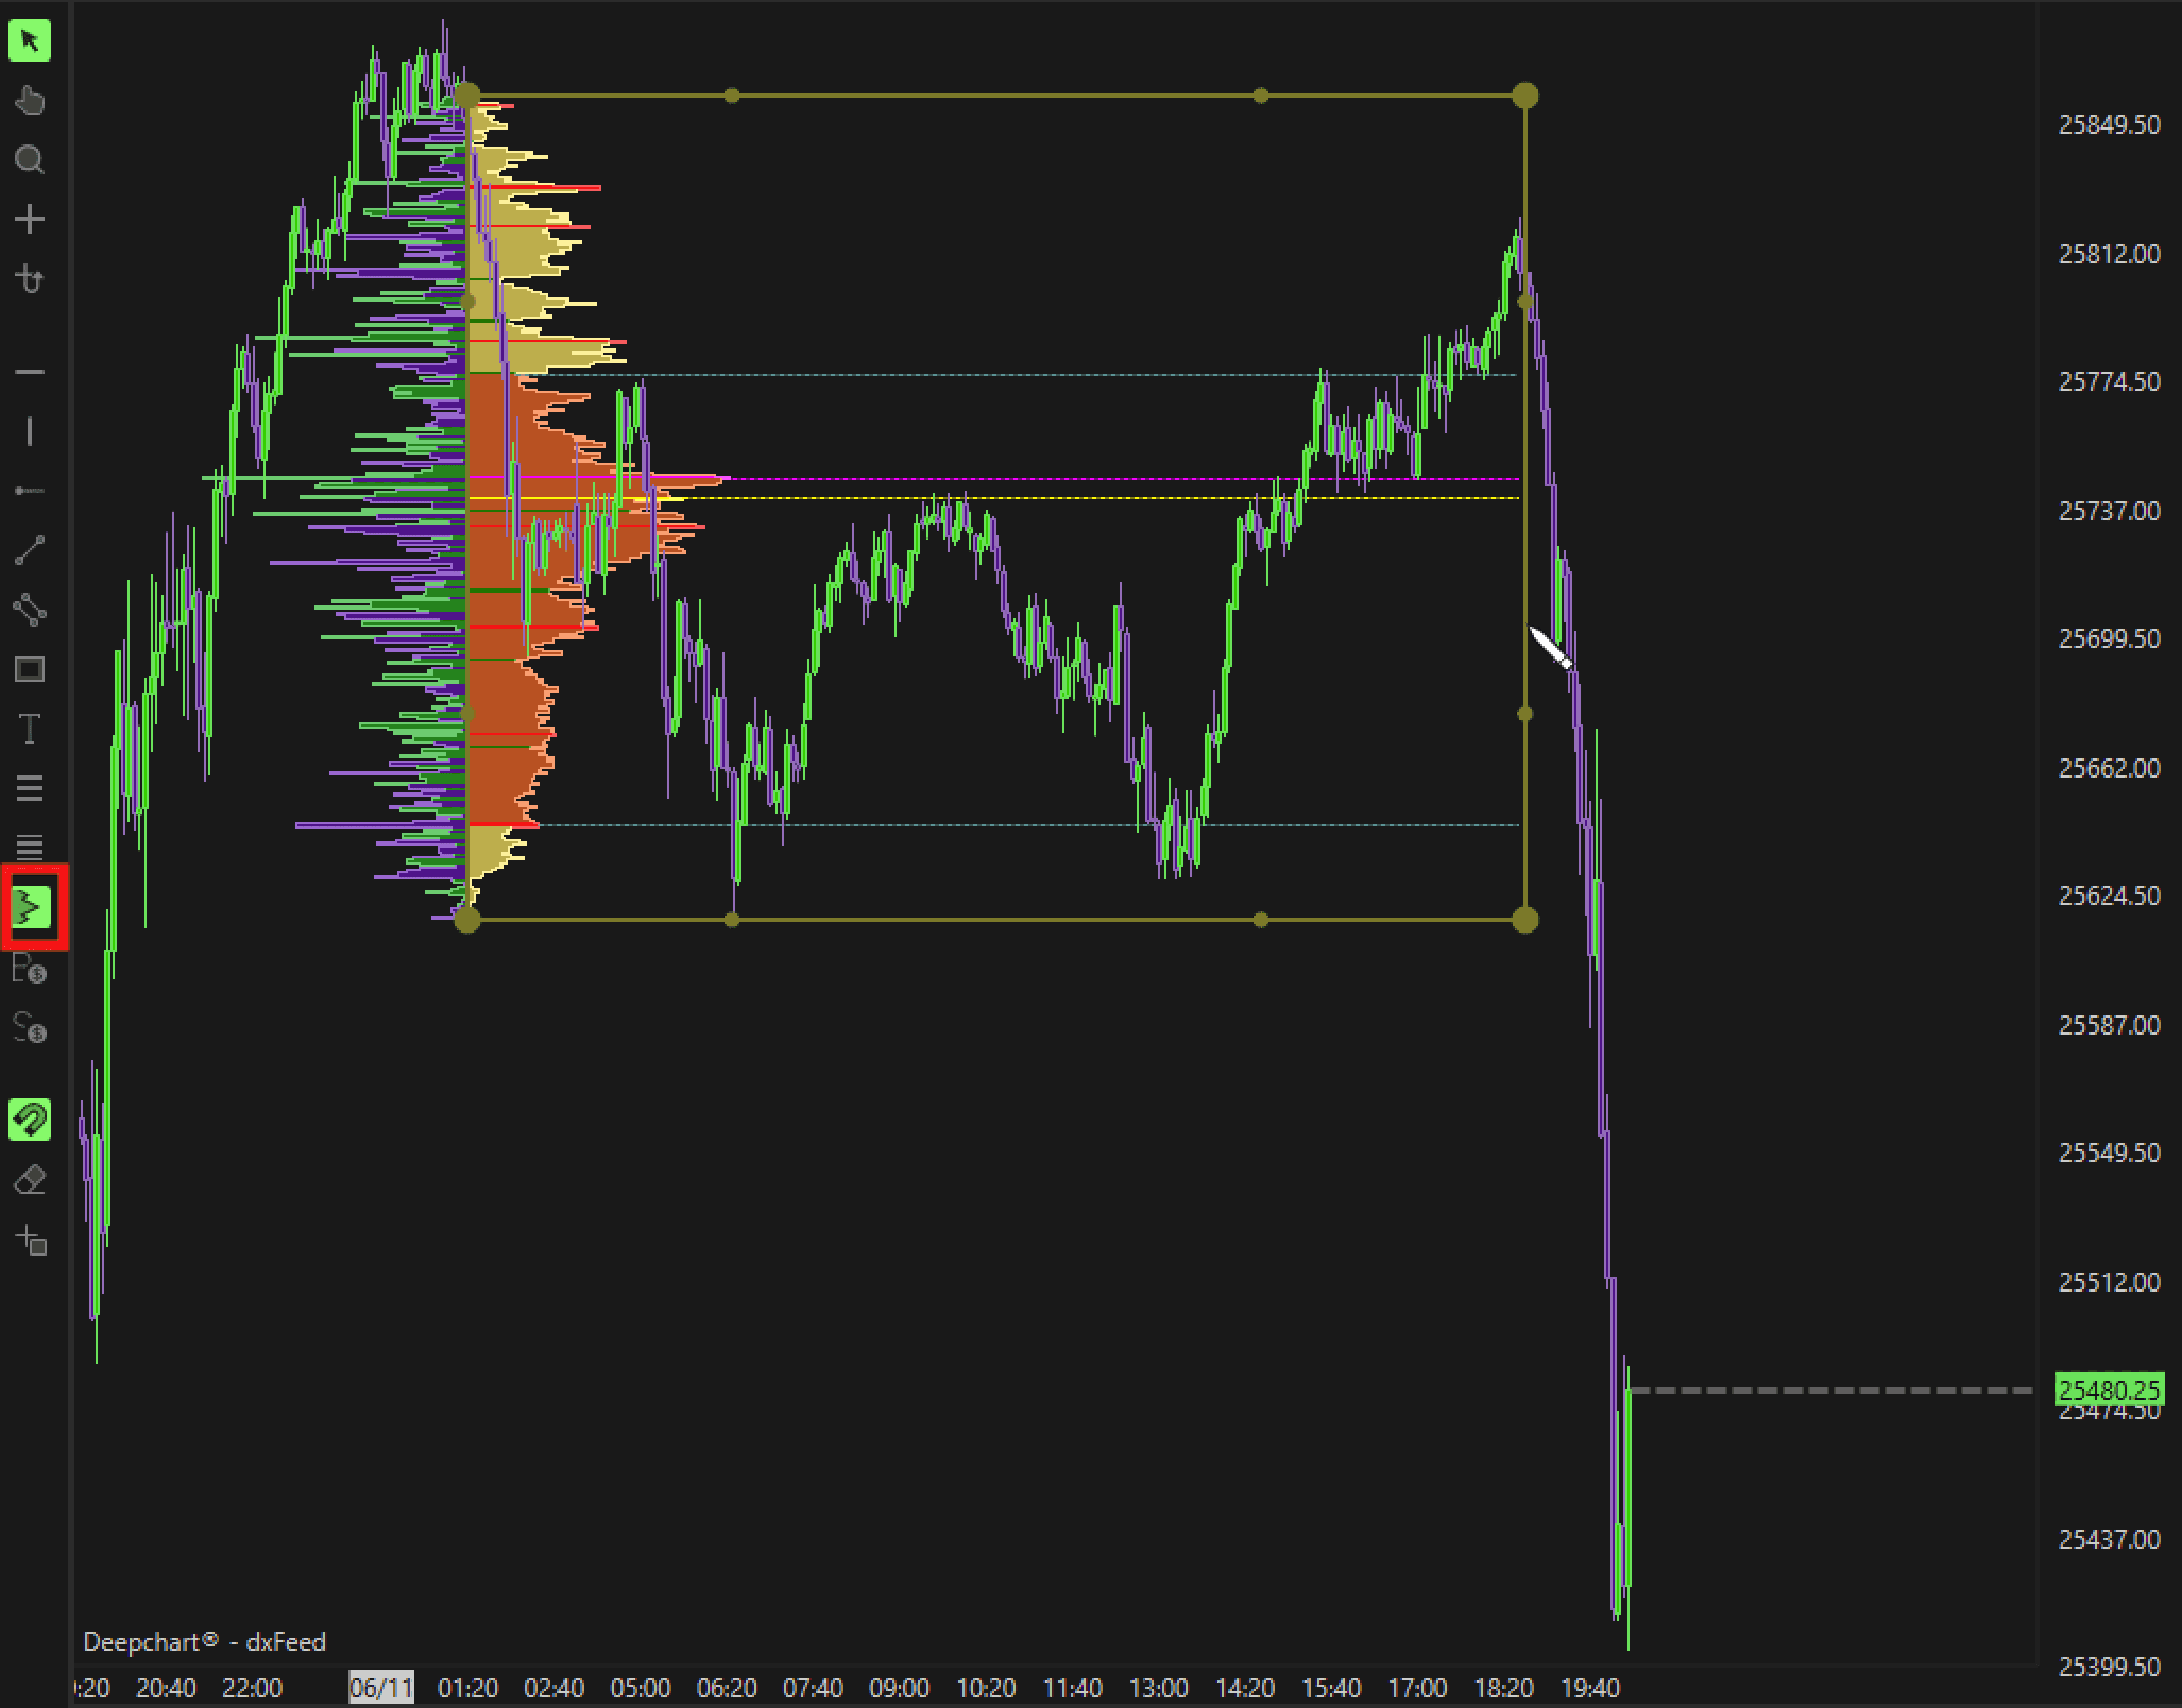
1.2.4 Personalizzato
Ti consente di creare profili personalizzati per qualsiasi area selezionata del tuo grafico.
Usa il pulsante di scelta rapida sulla barra degli strumenti a sinistra per disegnare e generare un profilo per uno specifico intervallo di prezzo o di tempo.
1.3 Tipo lunghezza e Valore lunghezza
Questi due campi ti consentono di personalizzare il periodo di tempo e la frequenza dei profili.

Ad esempio:
Imposta Periodo VBP su Multipli
Imposta Tipo lunghezza su Giorni
Imposta Valore lunghezza su 2
Questo traccerà un nuovo profilo ogni due giorni sul tuo grafico.
Puoi anche creare profili personalizzati minutari, giornalieri, settimanali o mensili usando queste opzioni.
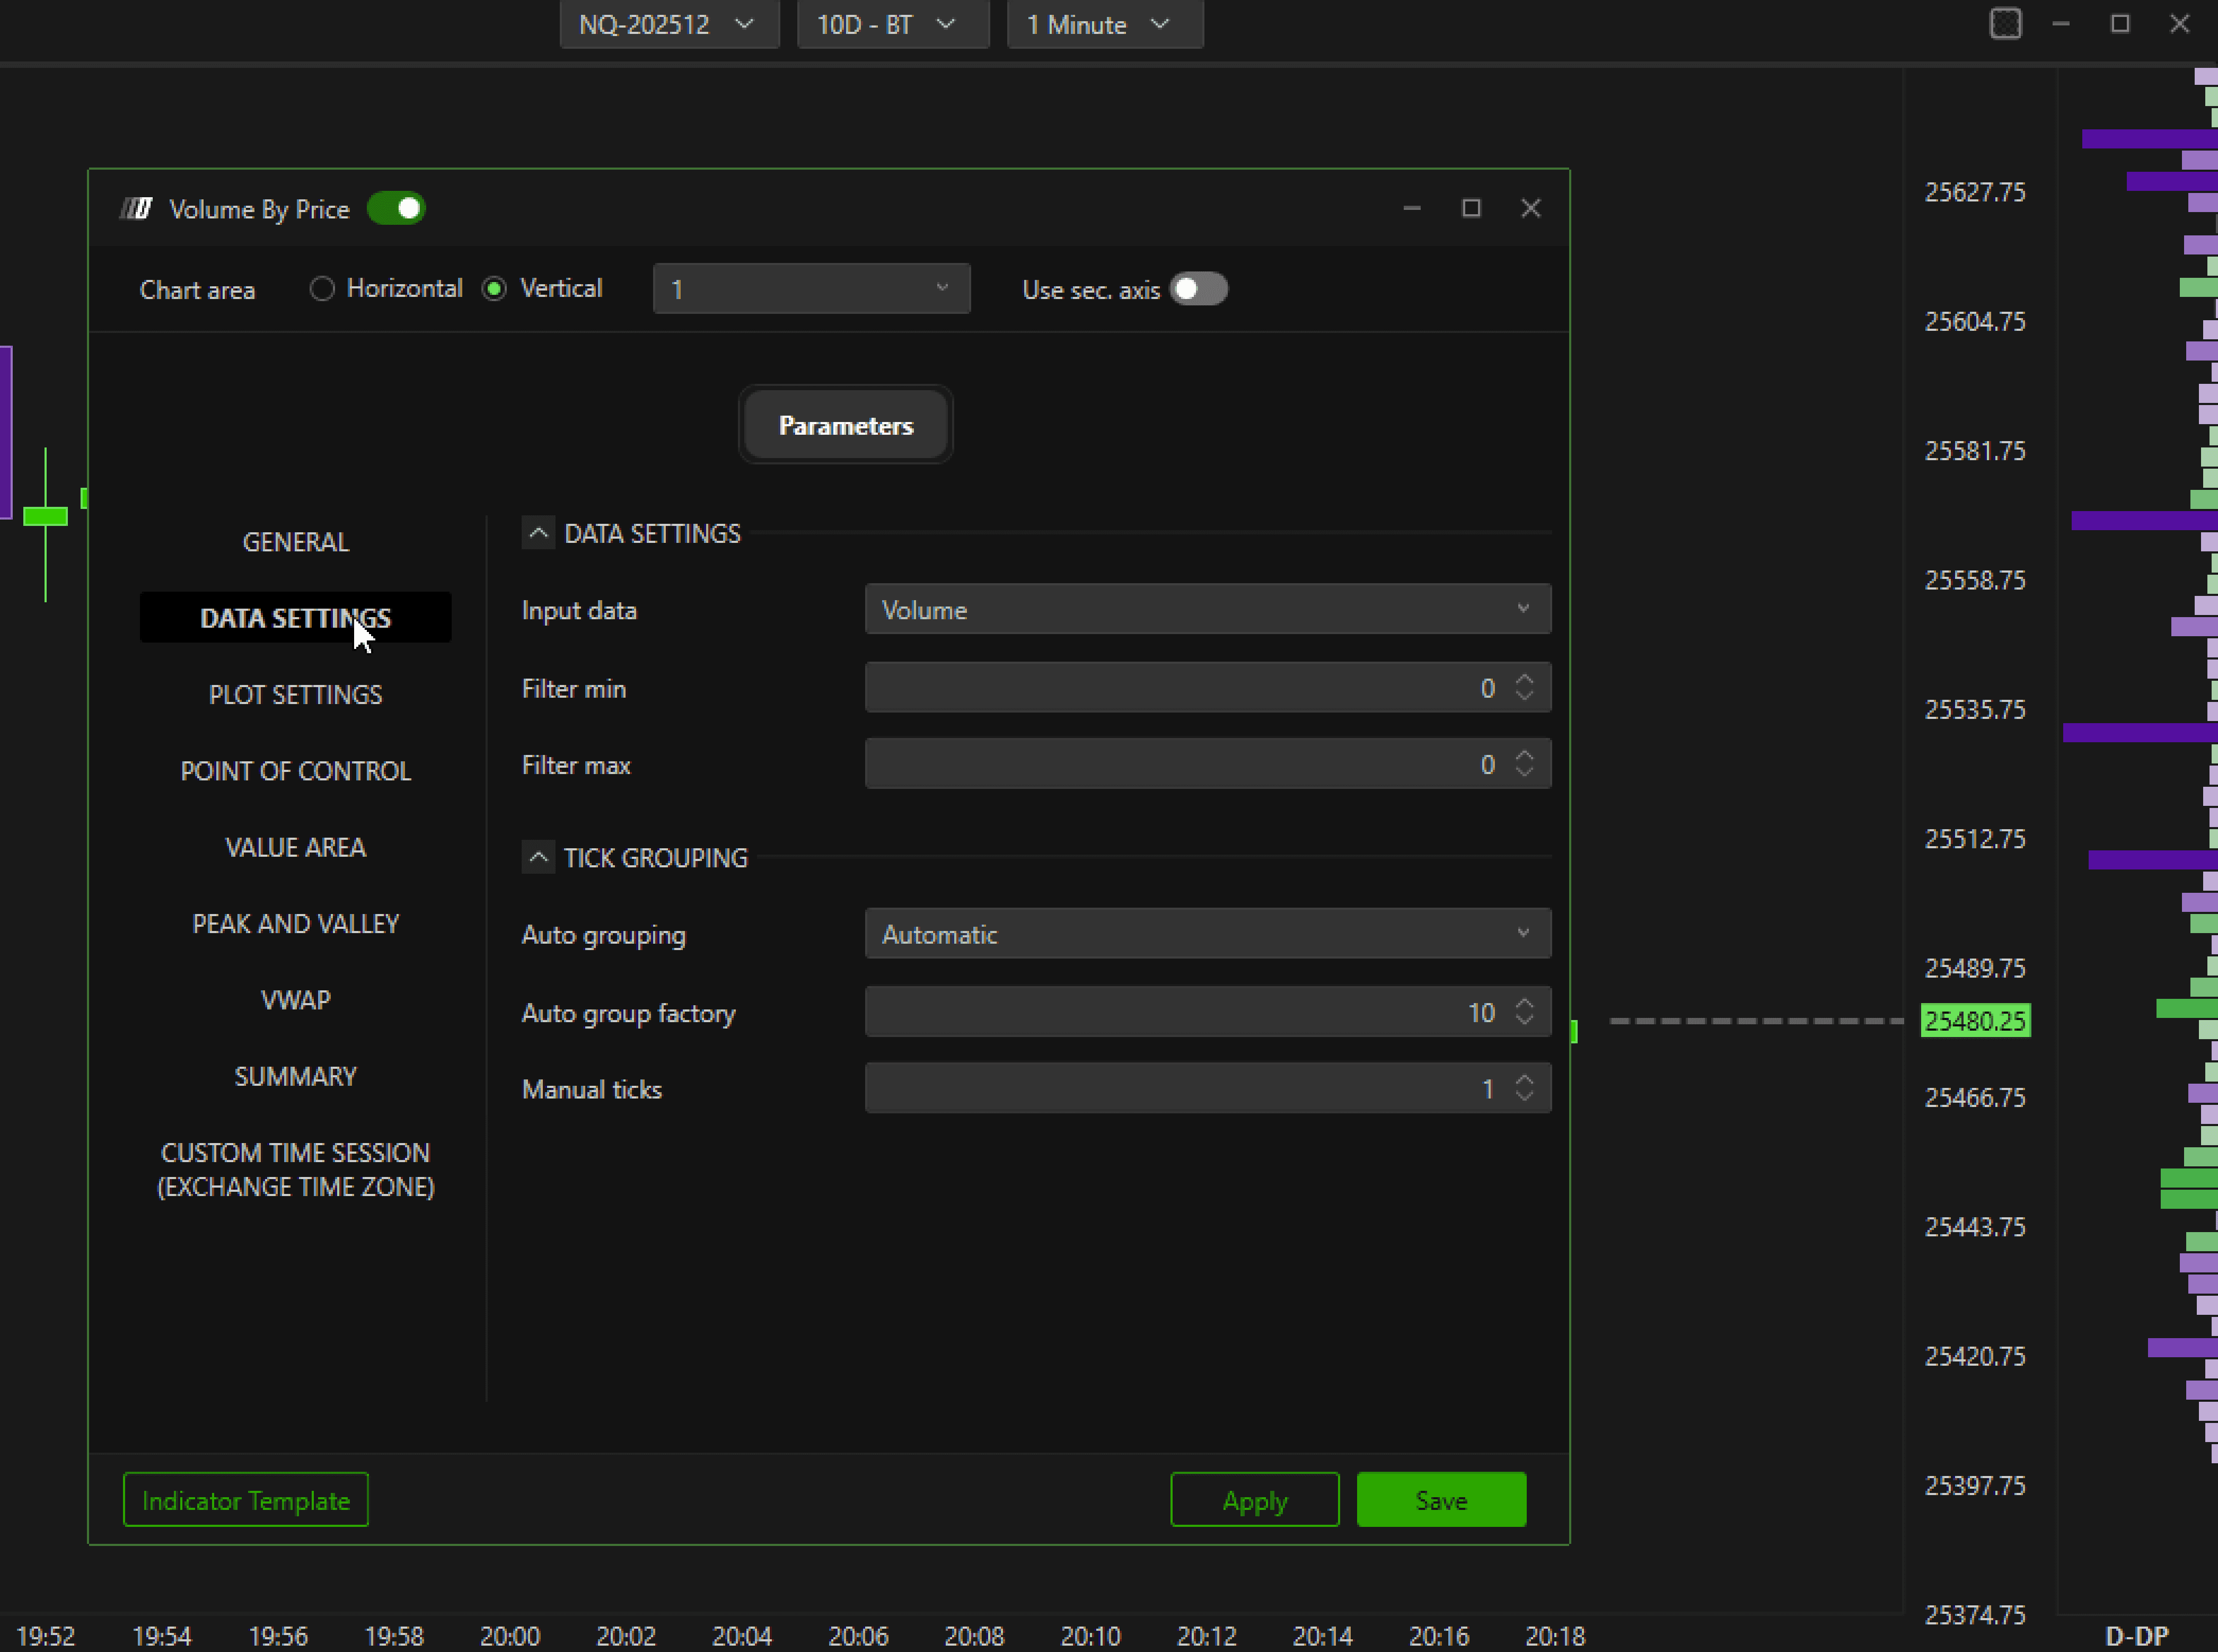
2.Impostazioni dati
La sezione Impostazioni dati contiene tre campi principali:
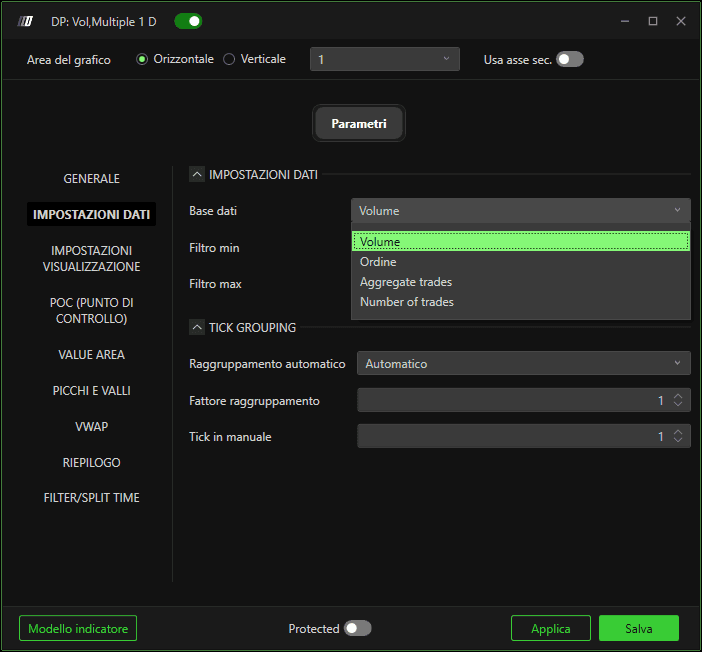
2.1 Dati di input
Questo campo ti consente di selezionare il tipo di dati di input su cui verrà costruito il profilo.
Puoi scegliere tra i tipi di dati Volume, Ordine e Aggregato.
Questi tipi sono spiegati nel dettaglio nell'articolo — “Tipi di dati di input per gli indicatori” nella Knowledge Base.
C'è anche un'opzione per i dati Numero di trade.
In questa modalità, invece di usare il volume totale delle transazioni, il profilo viene costruito usando il numero di singoli trade del book degli ordini.
2.2 Filtro min e max
Questi campi ti consentono di impostare le soglie minime e massime per i dati usati nella costruzione del profilo.
Ad esempio, se selezioni Trade aggregati come dati di input e imposti il Filtro minimo su 20,
il profilo verrà costruito solo dagli ordini che hanno una dimensione minima di 20 contratti o più.
Tutti gli ordini inferiori a 20 saranno esclusi dal calcolo del profilo.
2.3 Raggruppamento tick
Questa impostazione ti consente di personalizzare quanti tick vengono raggruppati insieme in una singola barra del profilo.
Se imposti Raggruppamento automatico su Automatico, l'altezza della barra verrà calcolata automaticamente da DeepCharts,
in base all'altezza della scala dei prezzi sul tuo grafico. Se ingrandisci o riduci la scala dei prezzi con il raggruppamento automatico, i livelli del profilo potrebbero cambiare,
se non vuoi questo, imposta il raggruppamento automatico su manuale e il tick manuale su 1
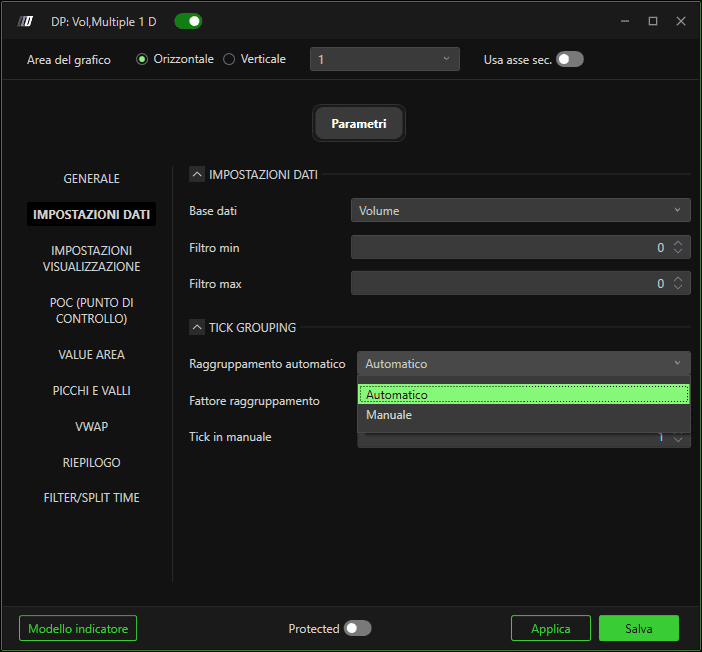
Se passi a Manuale, puoi definire il raggruppamento manualmente.
Ad esempio:
Se imposti il Fattore di raggruppamento automatico su
1, vedrai una barra per tick.Puoi anche regolare il valore Tick manuale — questo definisce quanti tick vengono raggruppati come uno solo.
Per esempio, se imposti Tick manuale = 5 e Fattore di raggruppamento automatico = 2,
vedrai una barra ogni 10 tick.
3.Filtro / Suddivisione oraria
3.1 Modalità filtro: Suddiviso
Questa impostazione ti consente di tracciare più profili di volume all'interno della stessa giornata di trading.
Ad esempio, puoi visualizzare due profili — uno per la sessione ETH (Electronic Trading Hours) e un altro per la sessione RTH (Regular Trading Hours).
Quando imposti la Modalità filtro su Splitted e l'Orario filtro su RTH, vedrai due profili al giorno:
Uno inizia dall'apertura ETH
L'altro inizia dall'apertura RTH
Questo rende più facile analizzare separatamente l'attività delle sessioni intraday.
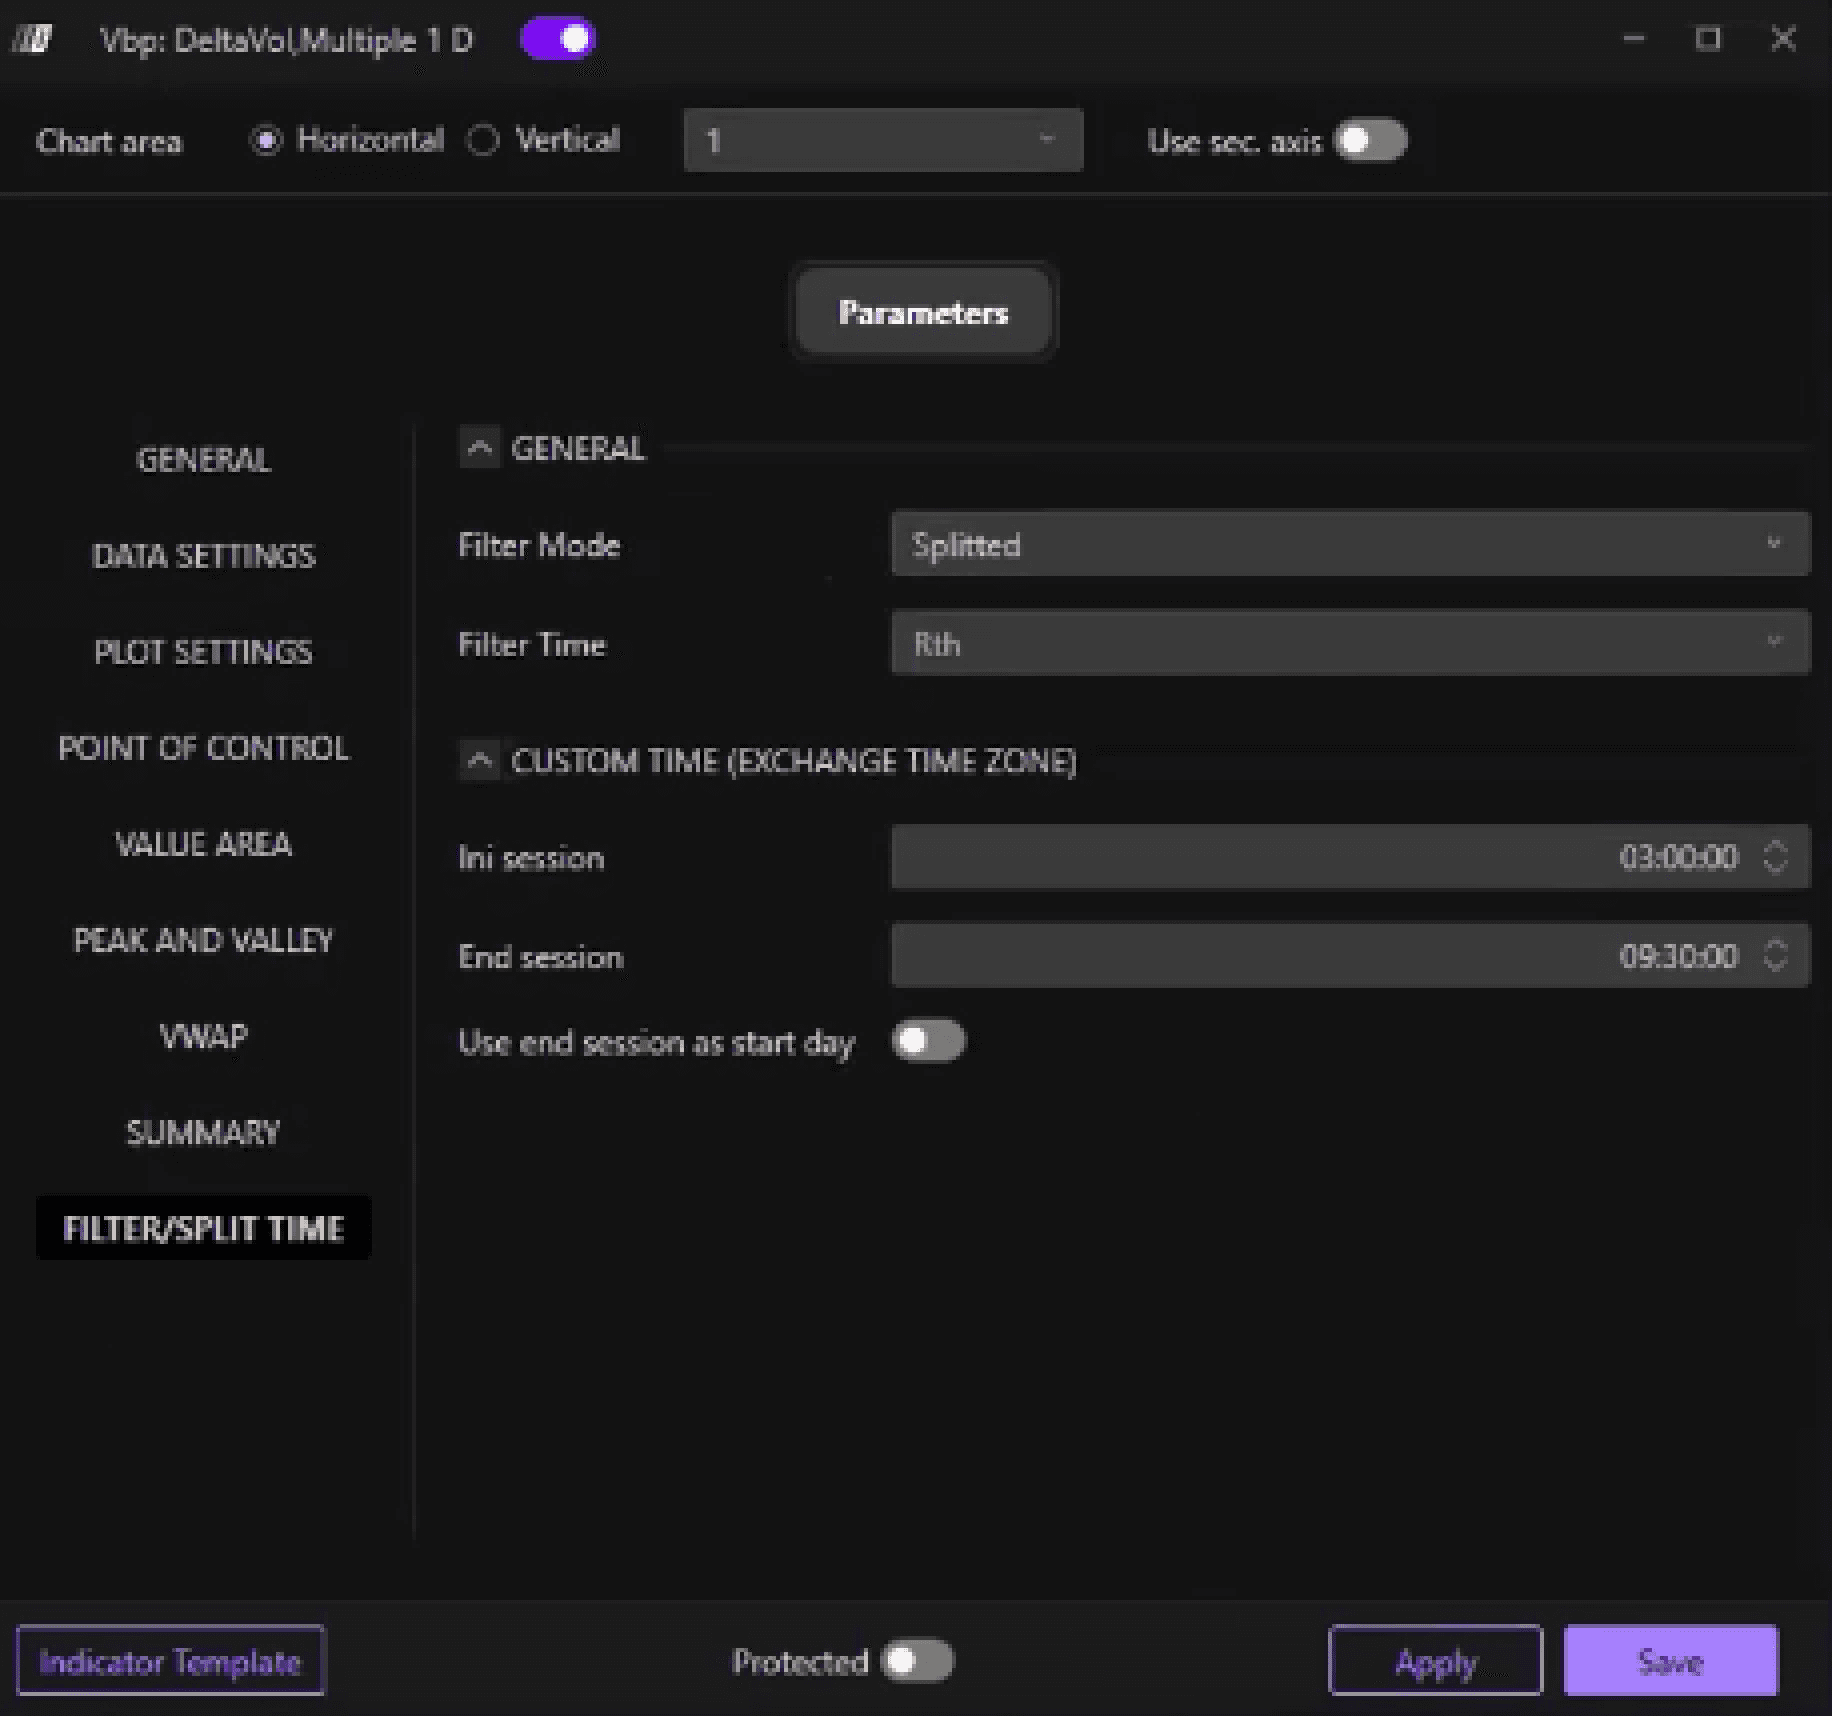
3.2 Orario personalizzato
Puoi anche impostare la Modalità filtro su Triple e l'Orario filtro su Personalizzato, consentendoti di visualizzare tre profili separati al giorno in base ai tuoi intervalli di tempo personalizzati.
Nota: Quando configuri gli orari di inizio e fine sessione, usa sempre il fuso orario della borsa dello strumento che stai negoziando.
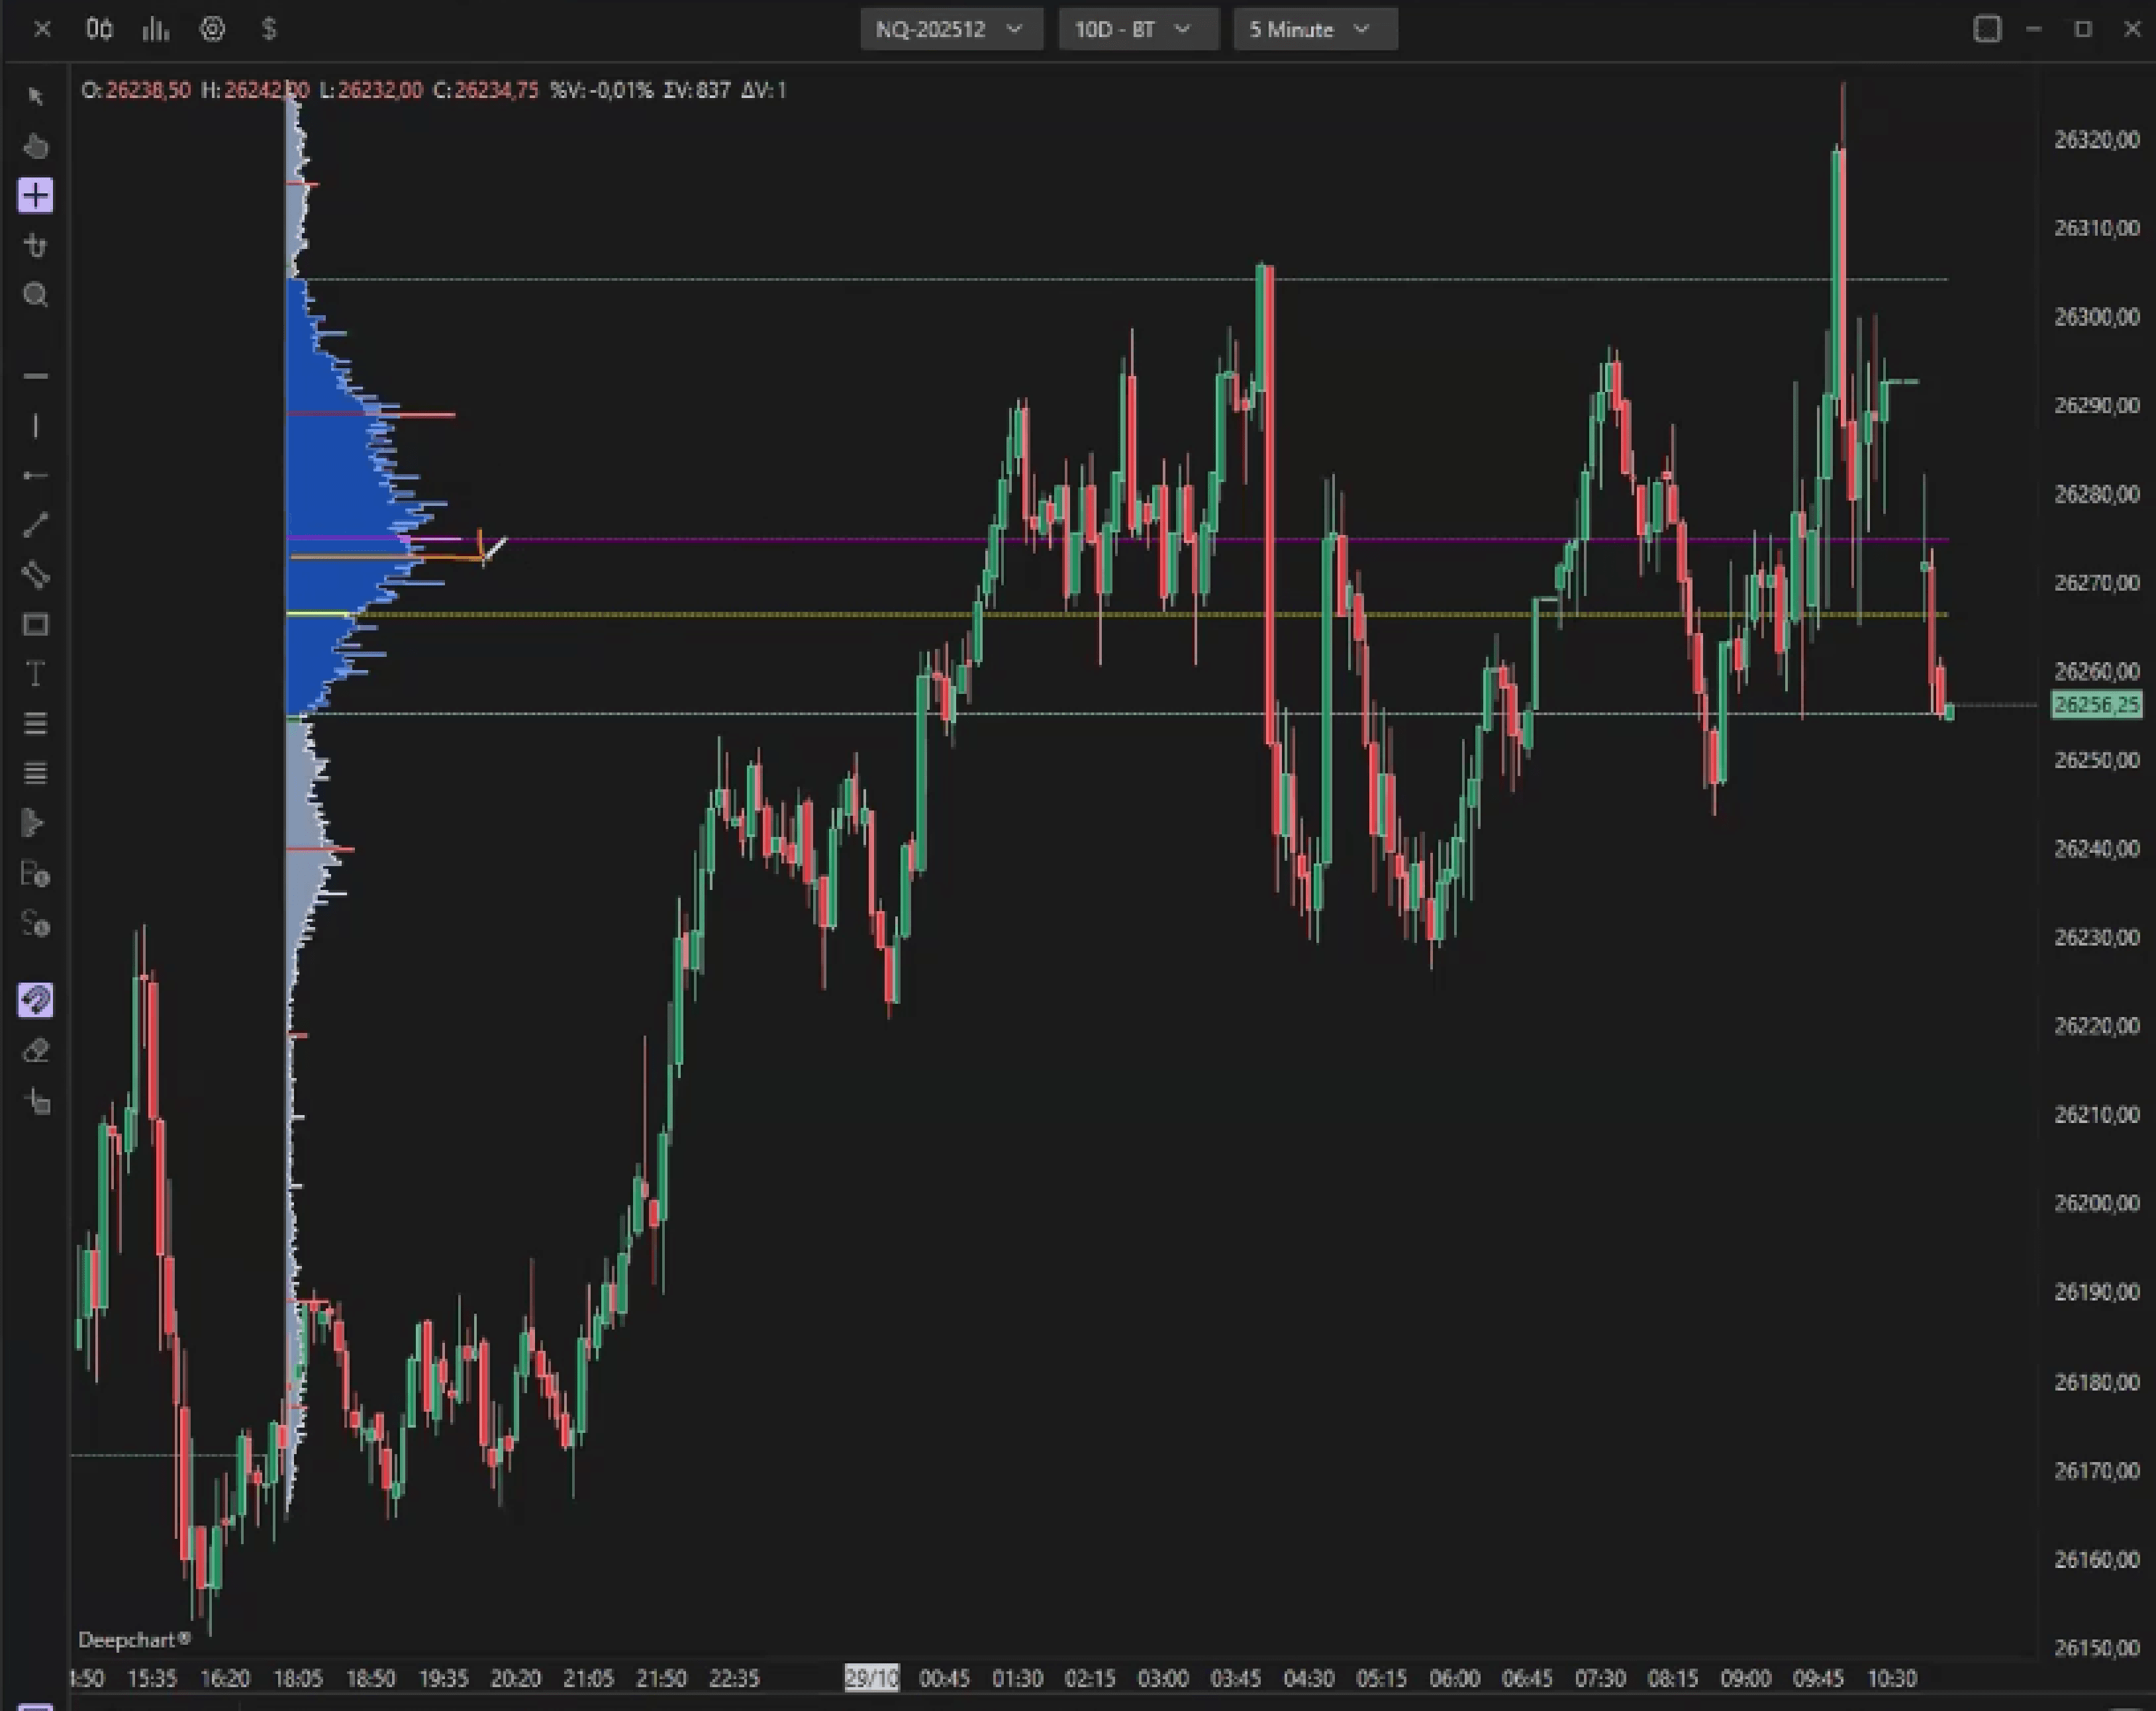
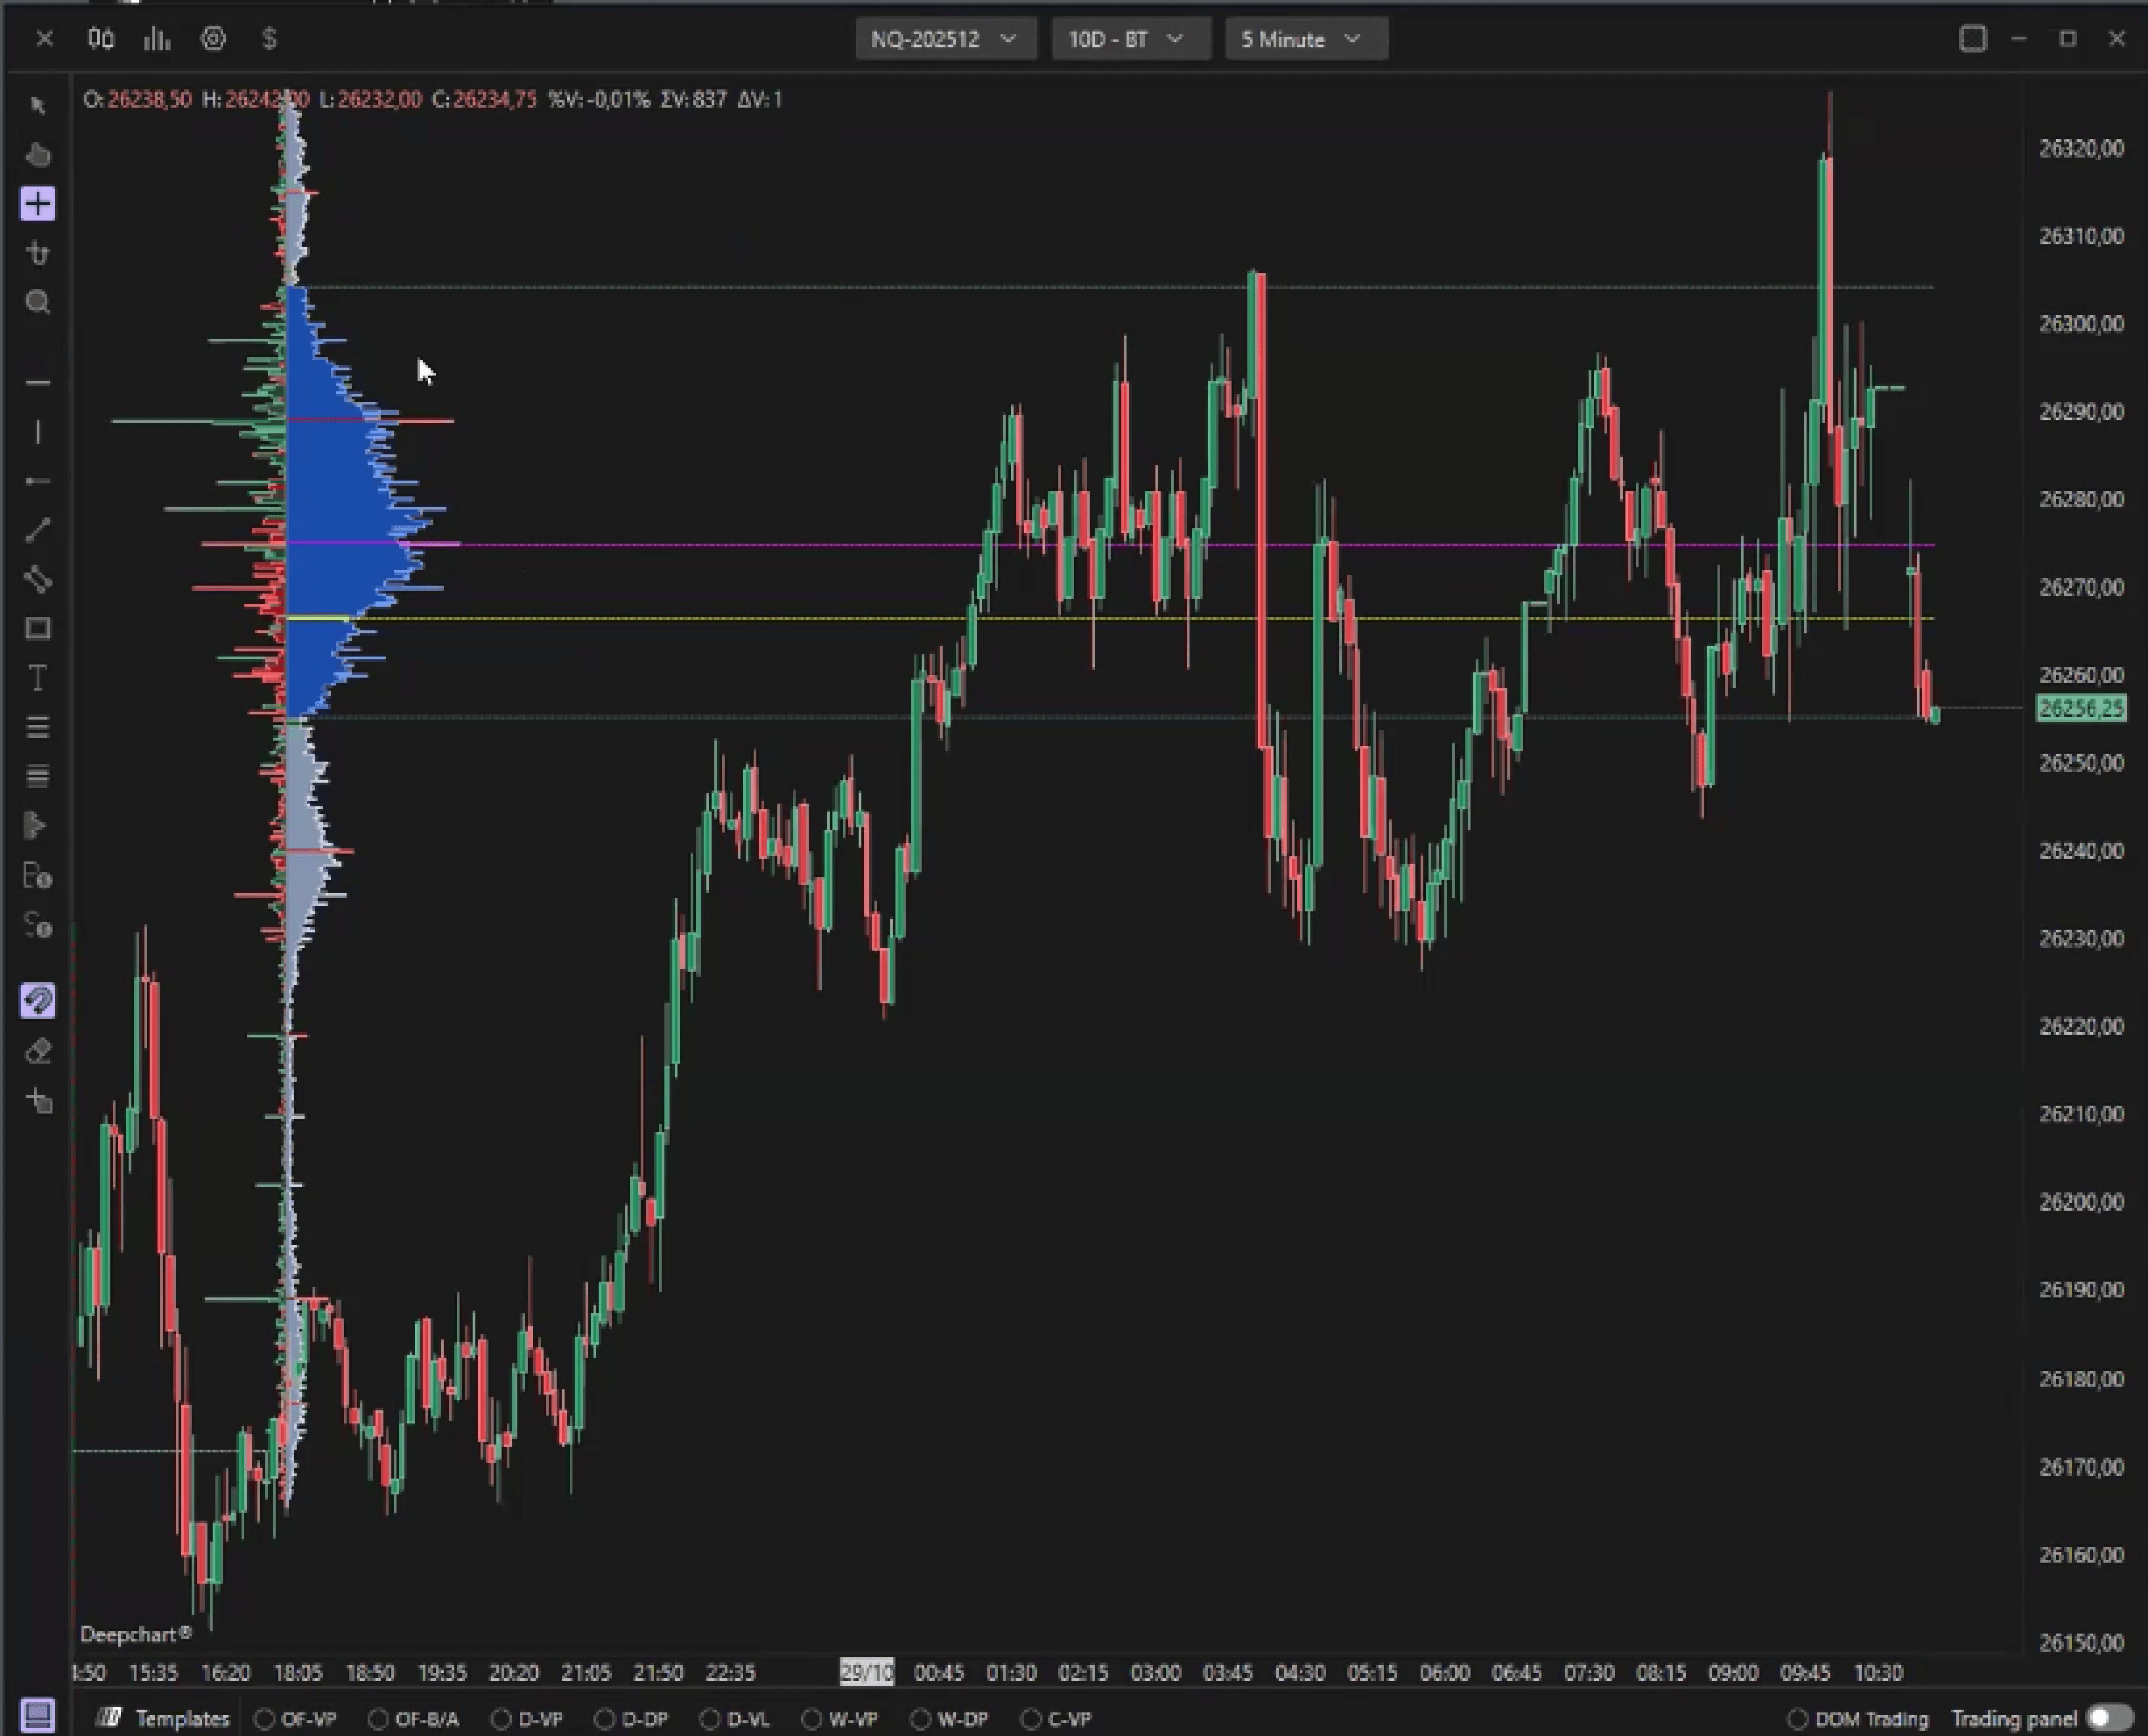
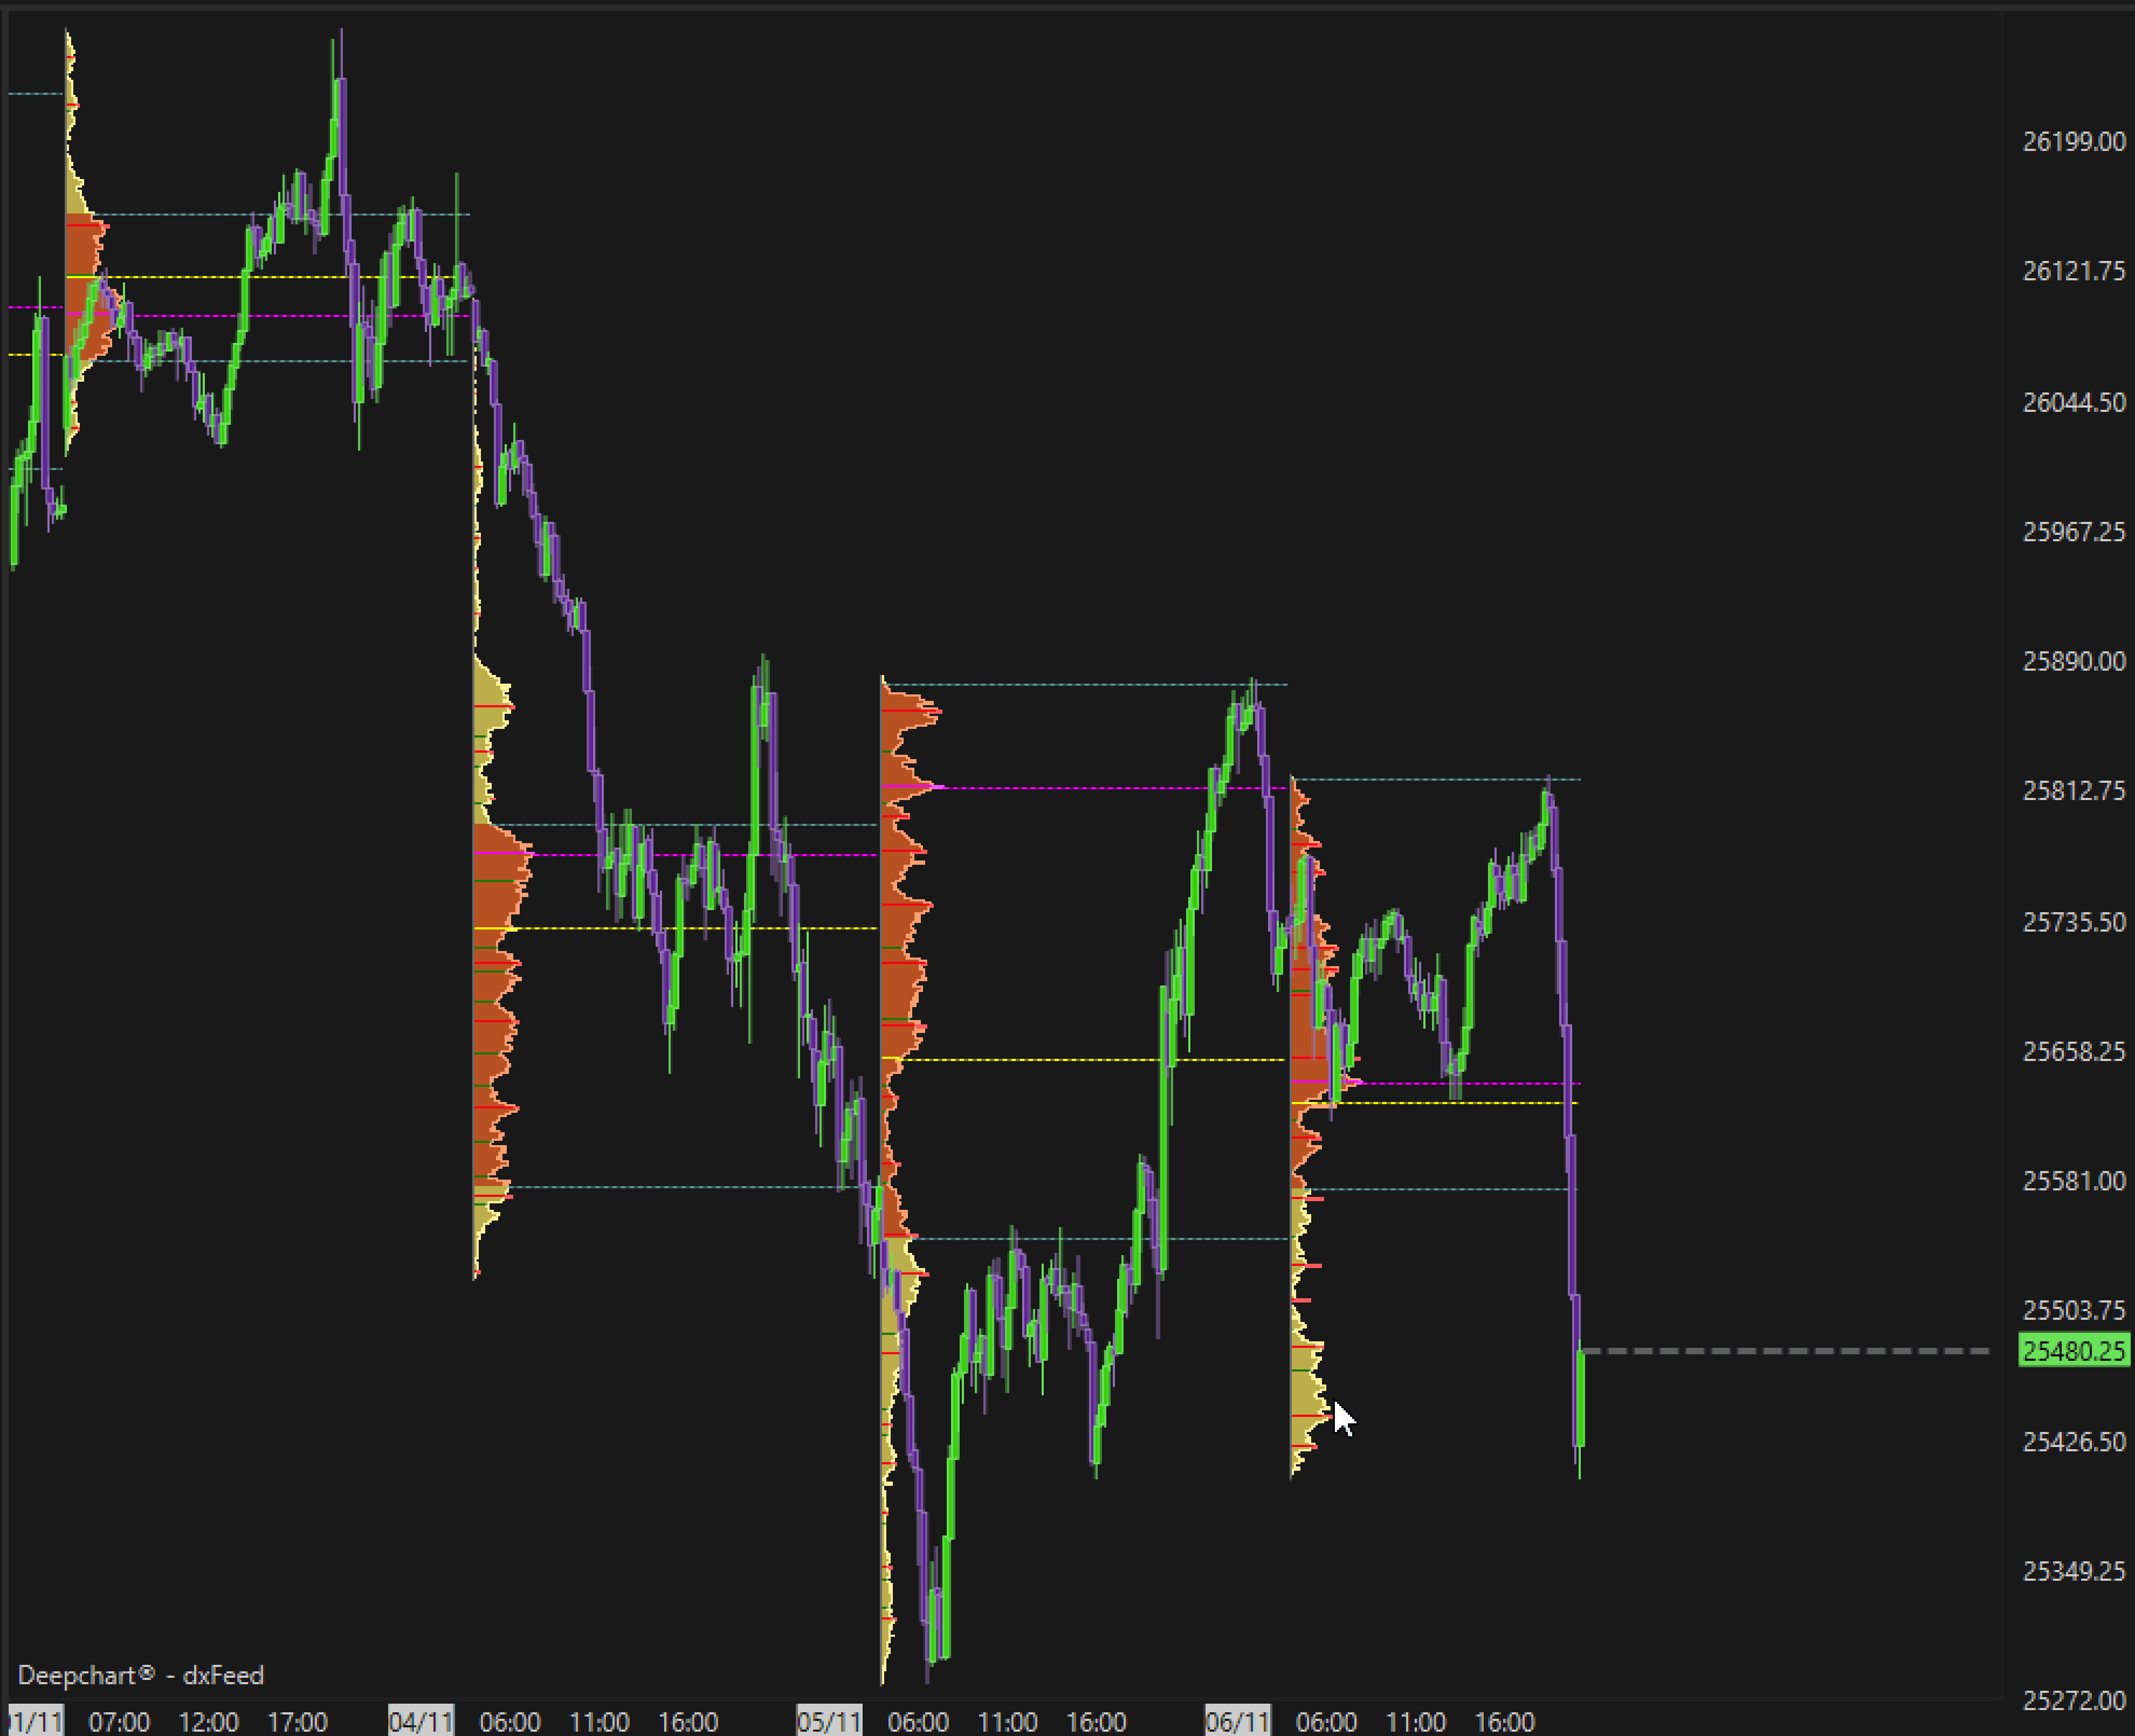
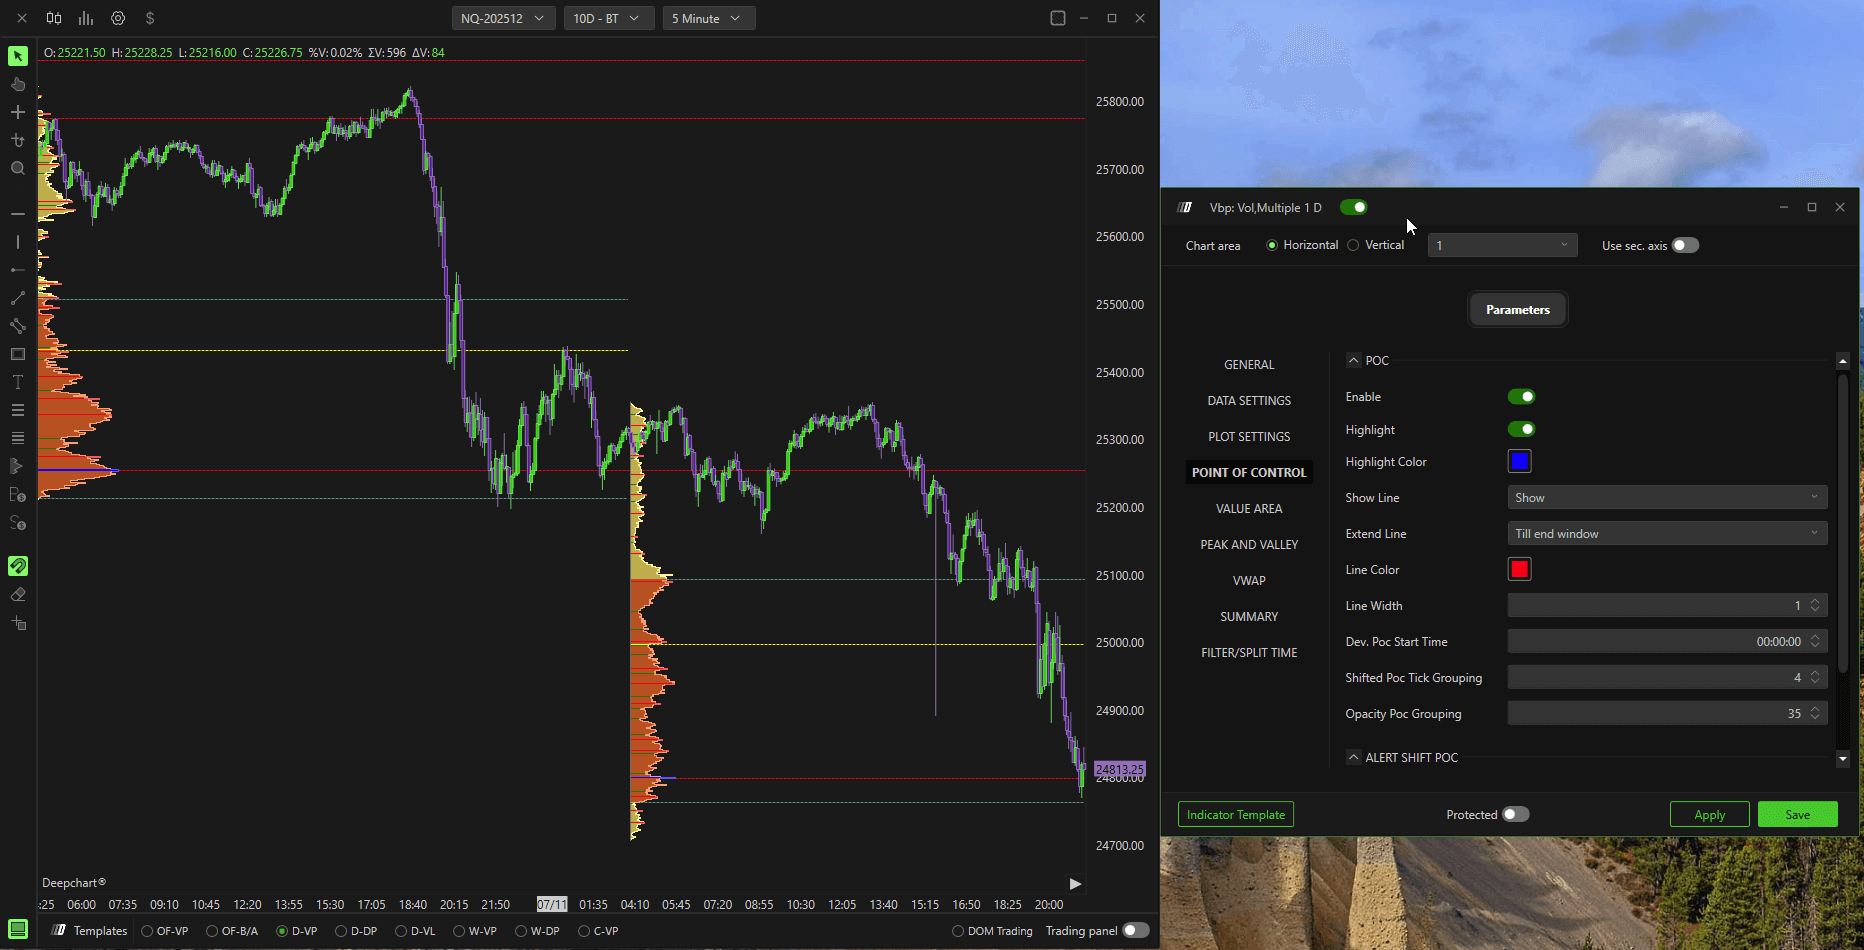
4.POC del profilo
In questa sezione puoi personalizzare il Point of Control (POC) del profilo — il livello in cui si è verificato il volume di scambio più elevato.
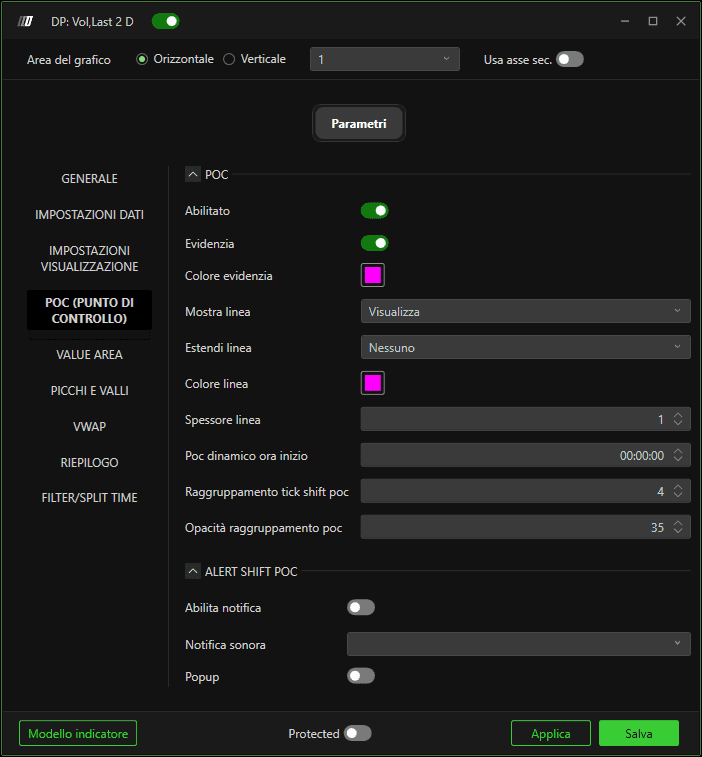
Per prima cosa, abbiamo il pulsante Abilita per attivare o disattivare la visualizzazione del POC.
Poi abbiamo l'opzione Abilita evidenziazione e l'impostazione Colore evidenziazione.
Quando è attivata, evidenzia la barra POC del profilo usando il colore selezionato.
Nell'esempio qui sotto, abbiamo impostato il colore della barra POC su blu.
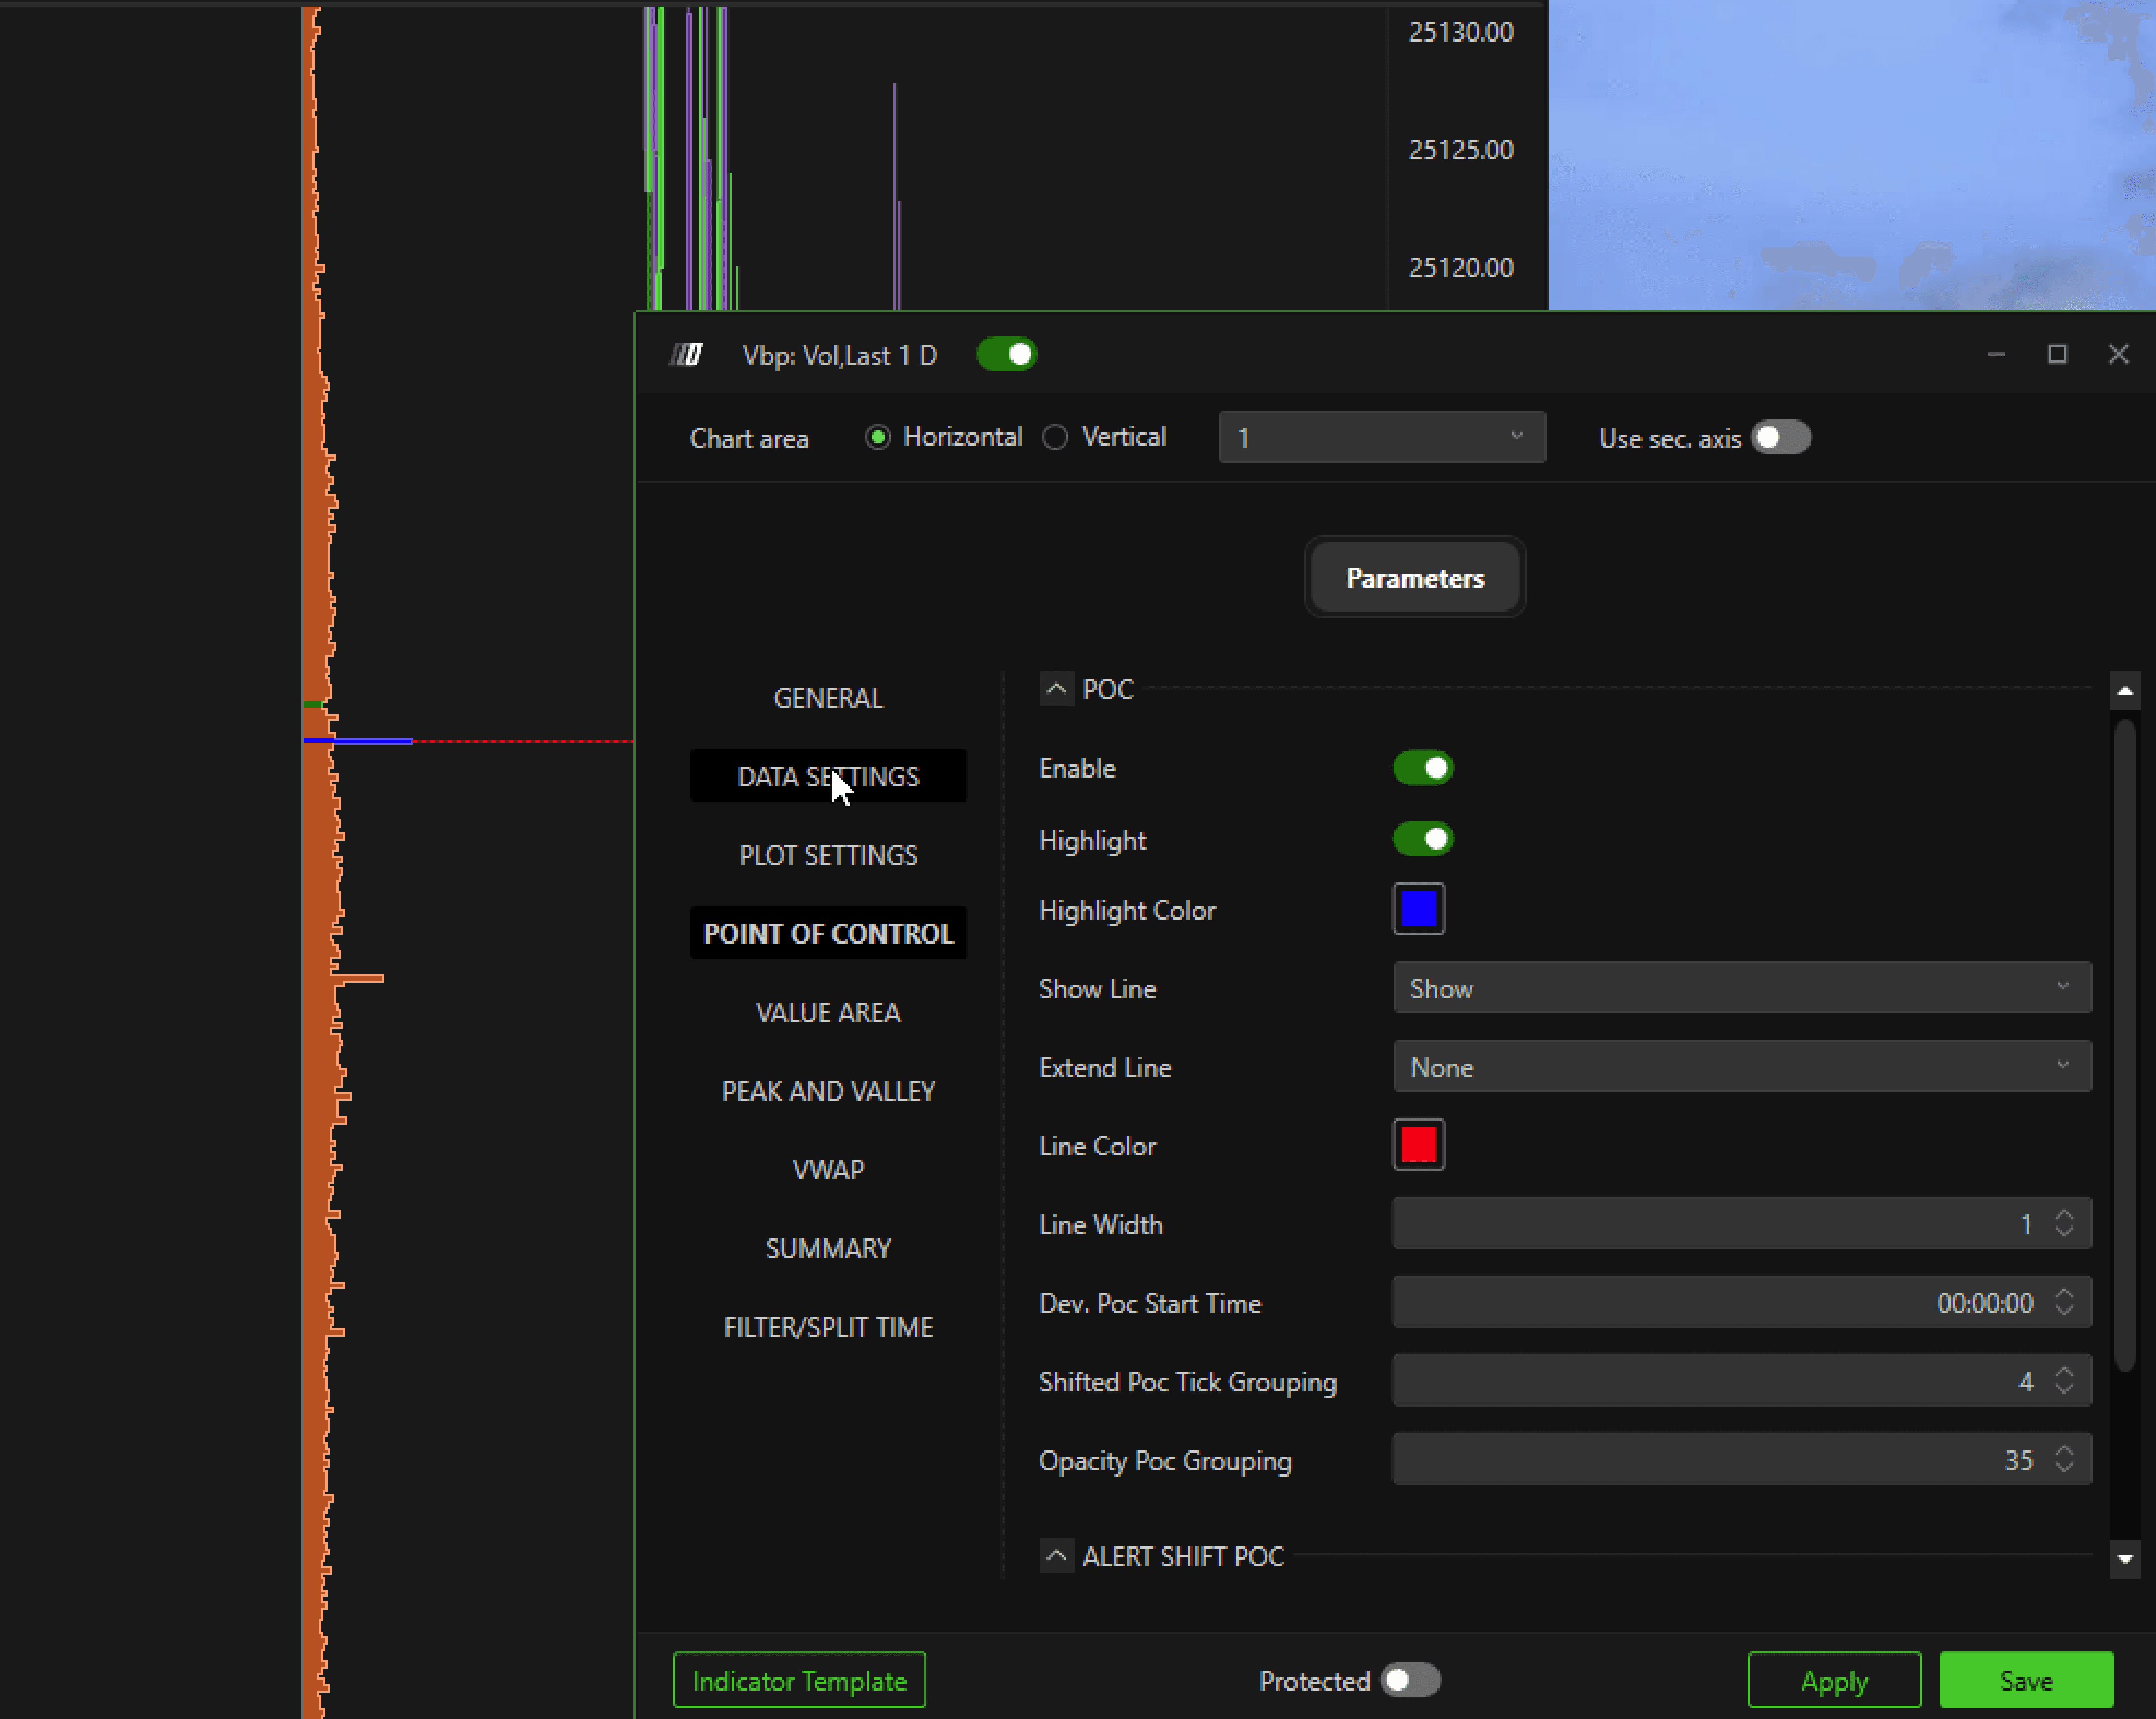
Puoi anche scegliere di visualizzare una Linea POC usando l'opzione Mostra linea — questo disegna una linea orizzontale al livello POC corrente.
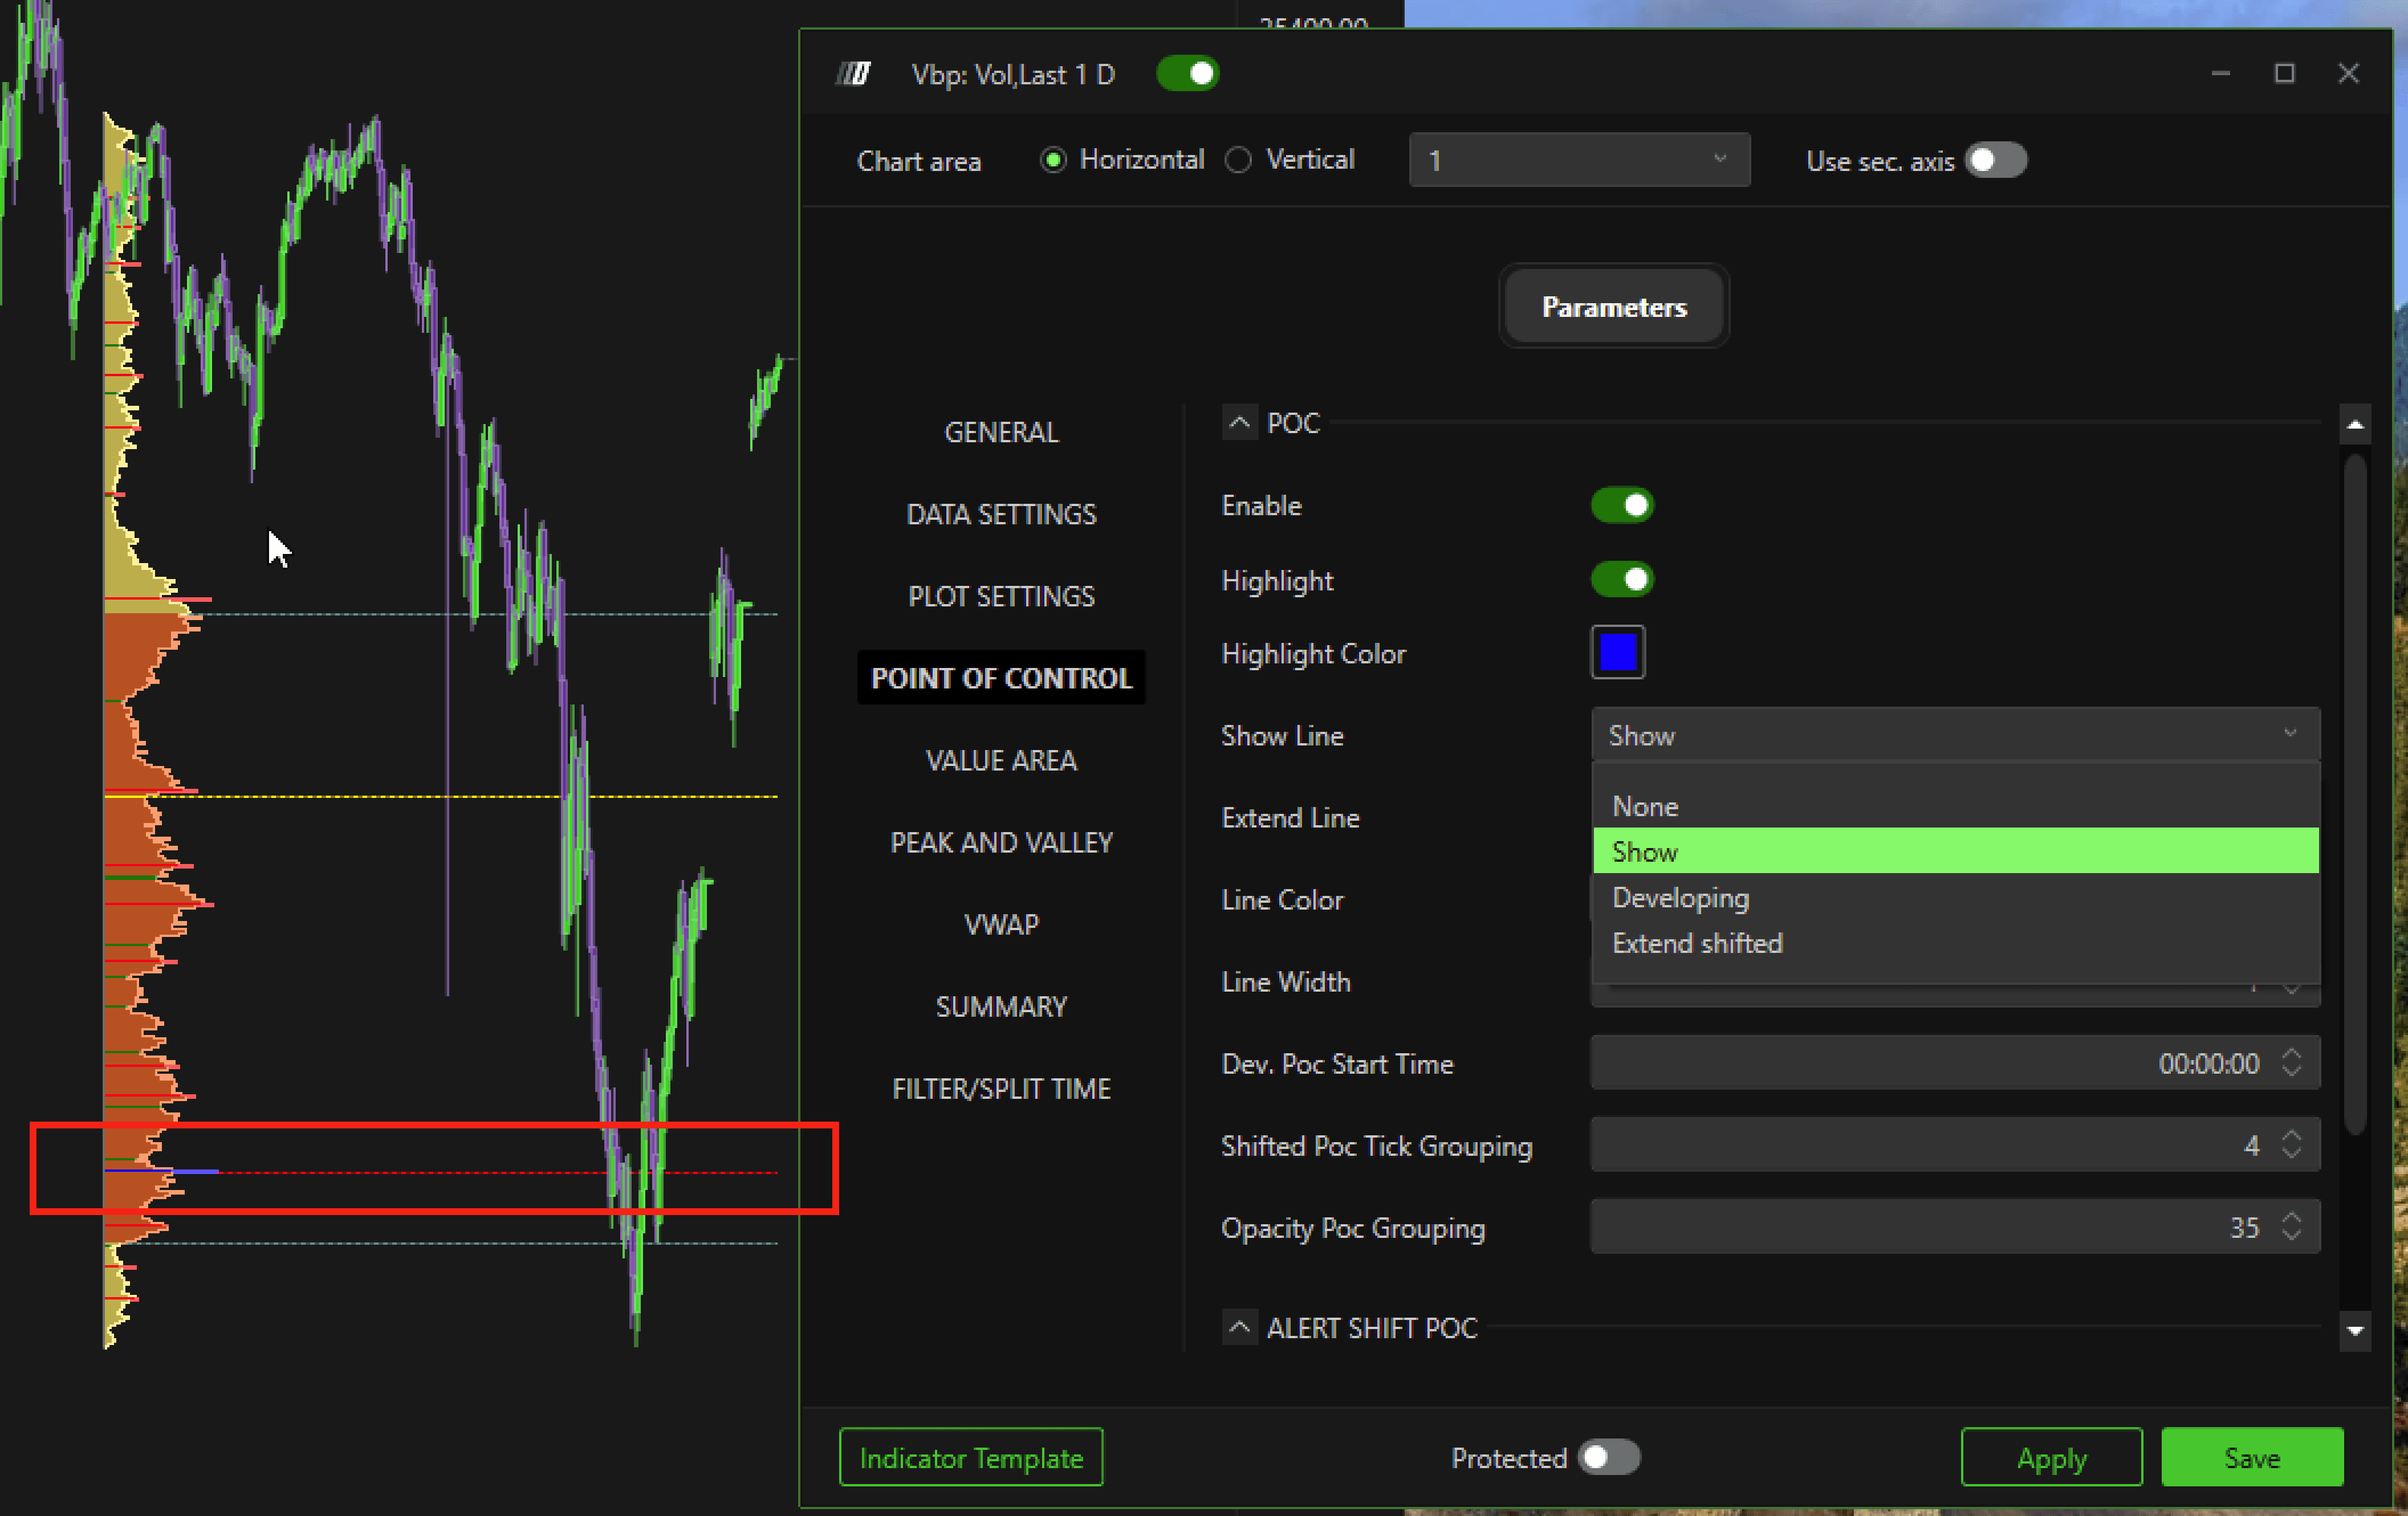
Se imposti il tipo di linea su In sviluppo, vengono visualizzate più linee POC — permettendoti di vedere dove si è trovato storicamente il POC.
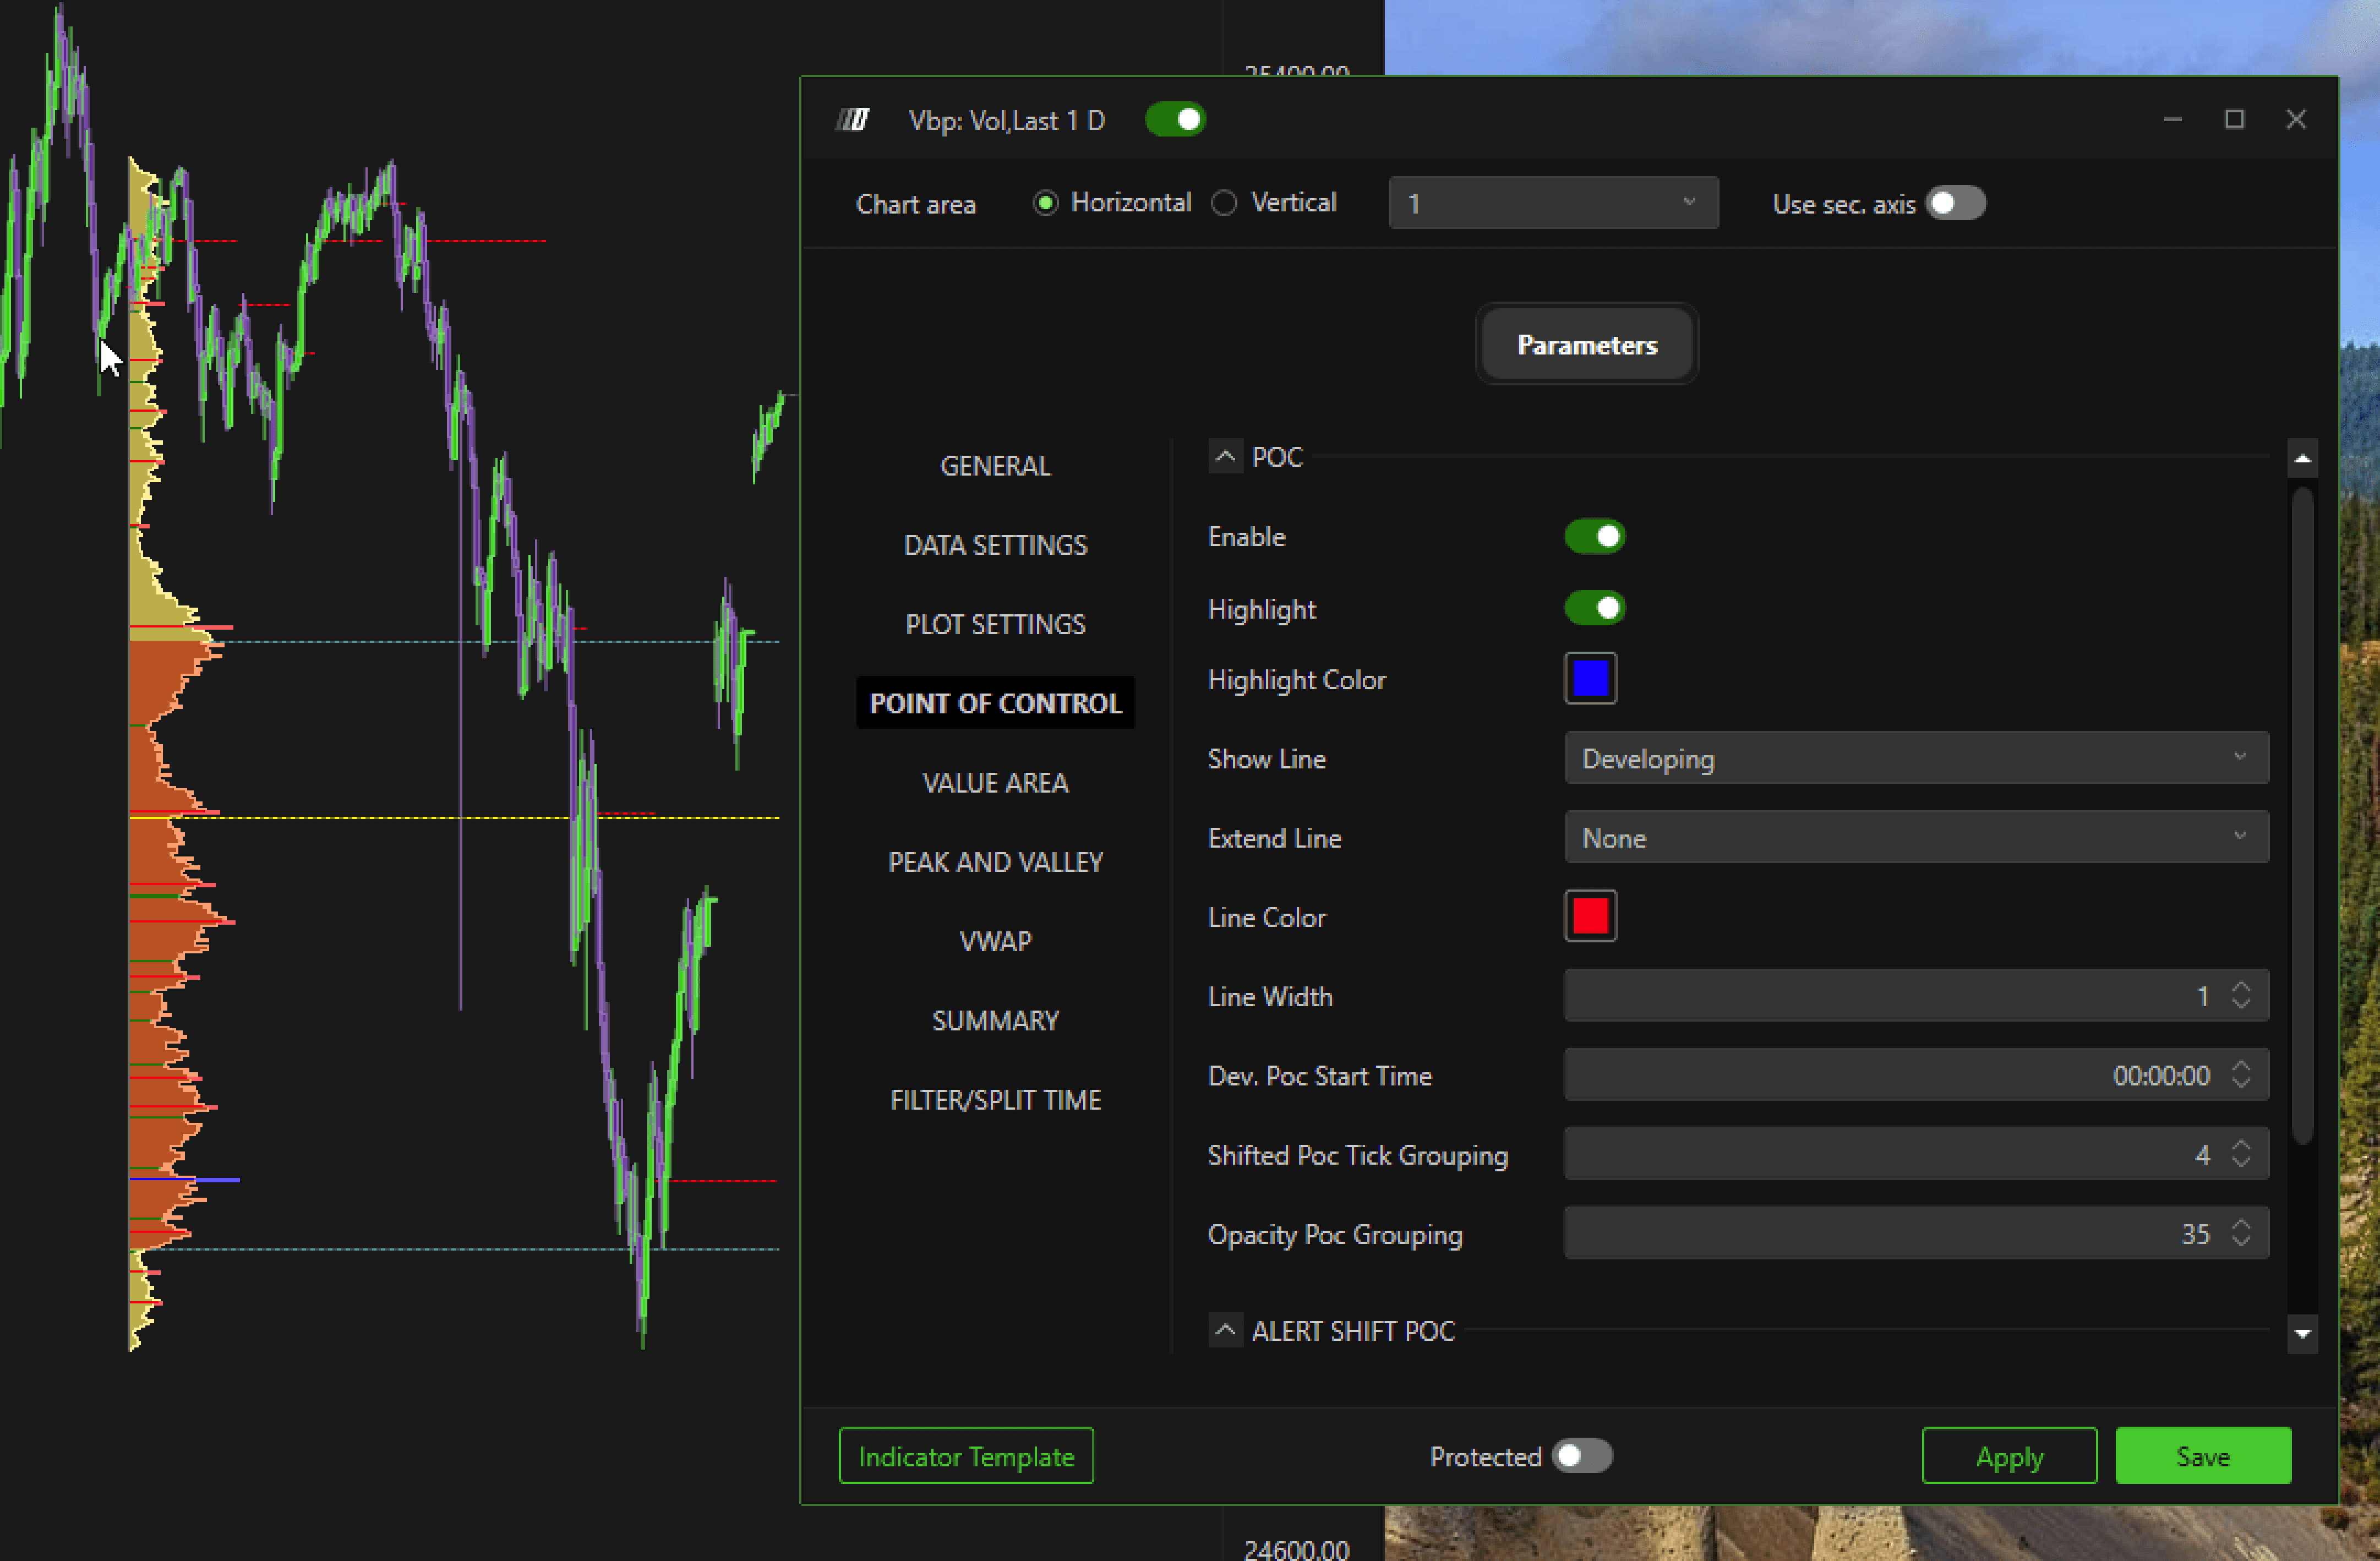
Quando abiliti Estendi linea fino alla fine della finestra, la linea POC si estenderà su tutta l'area visibile del grafico.
Puoi anche personalizzare completamente il colore della linea e lo spessore in base alle tue preferenze.
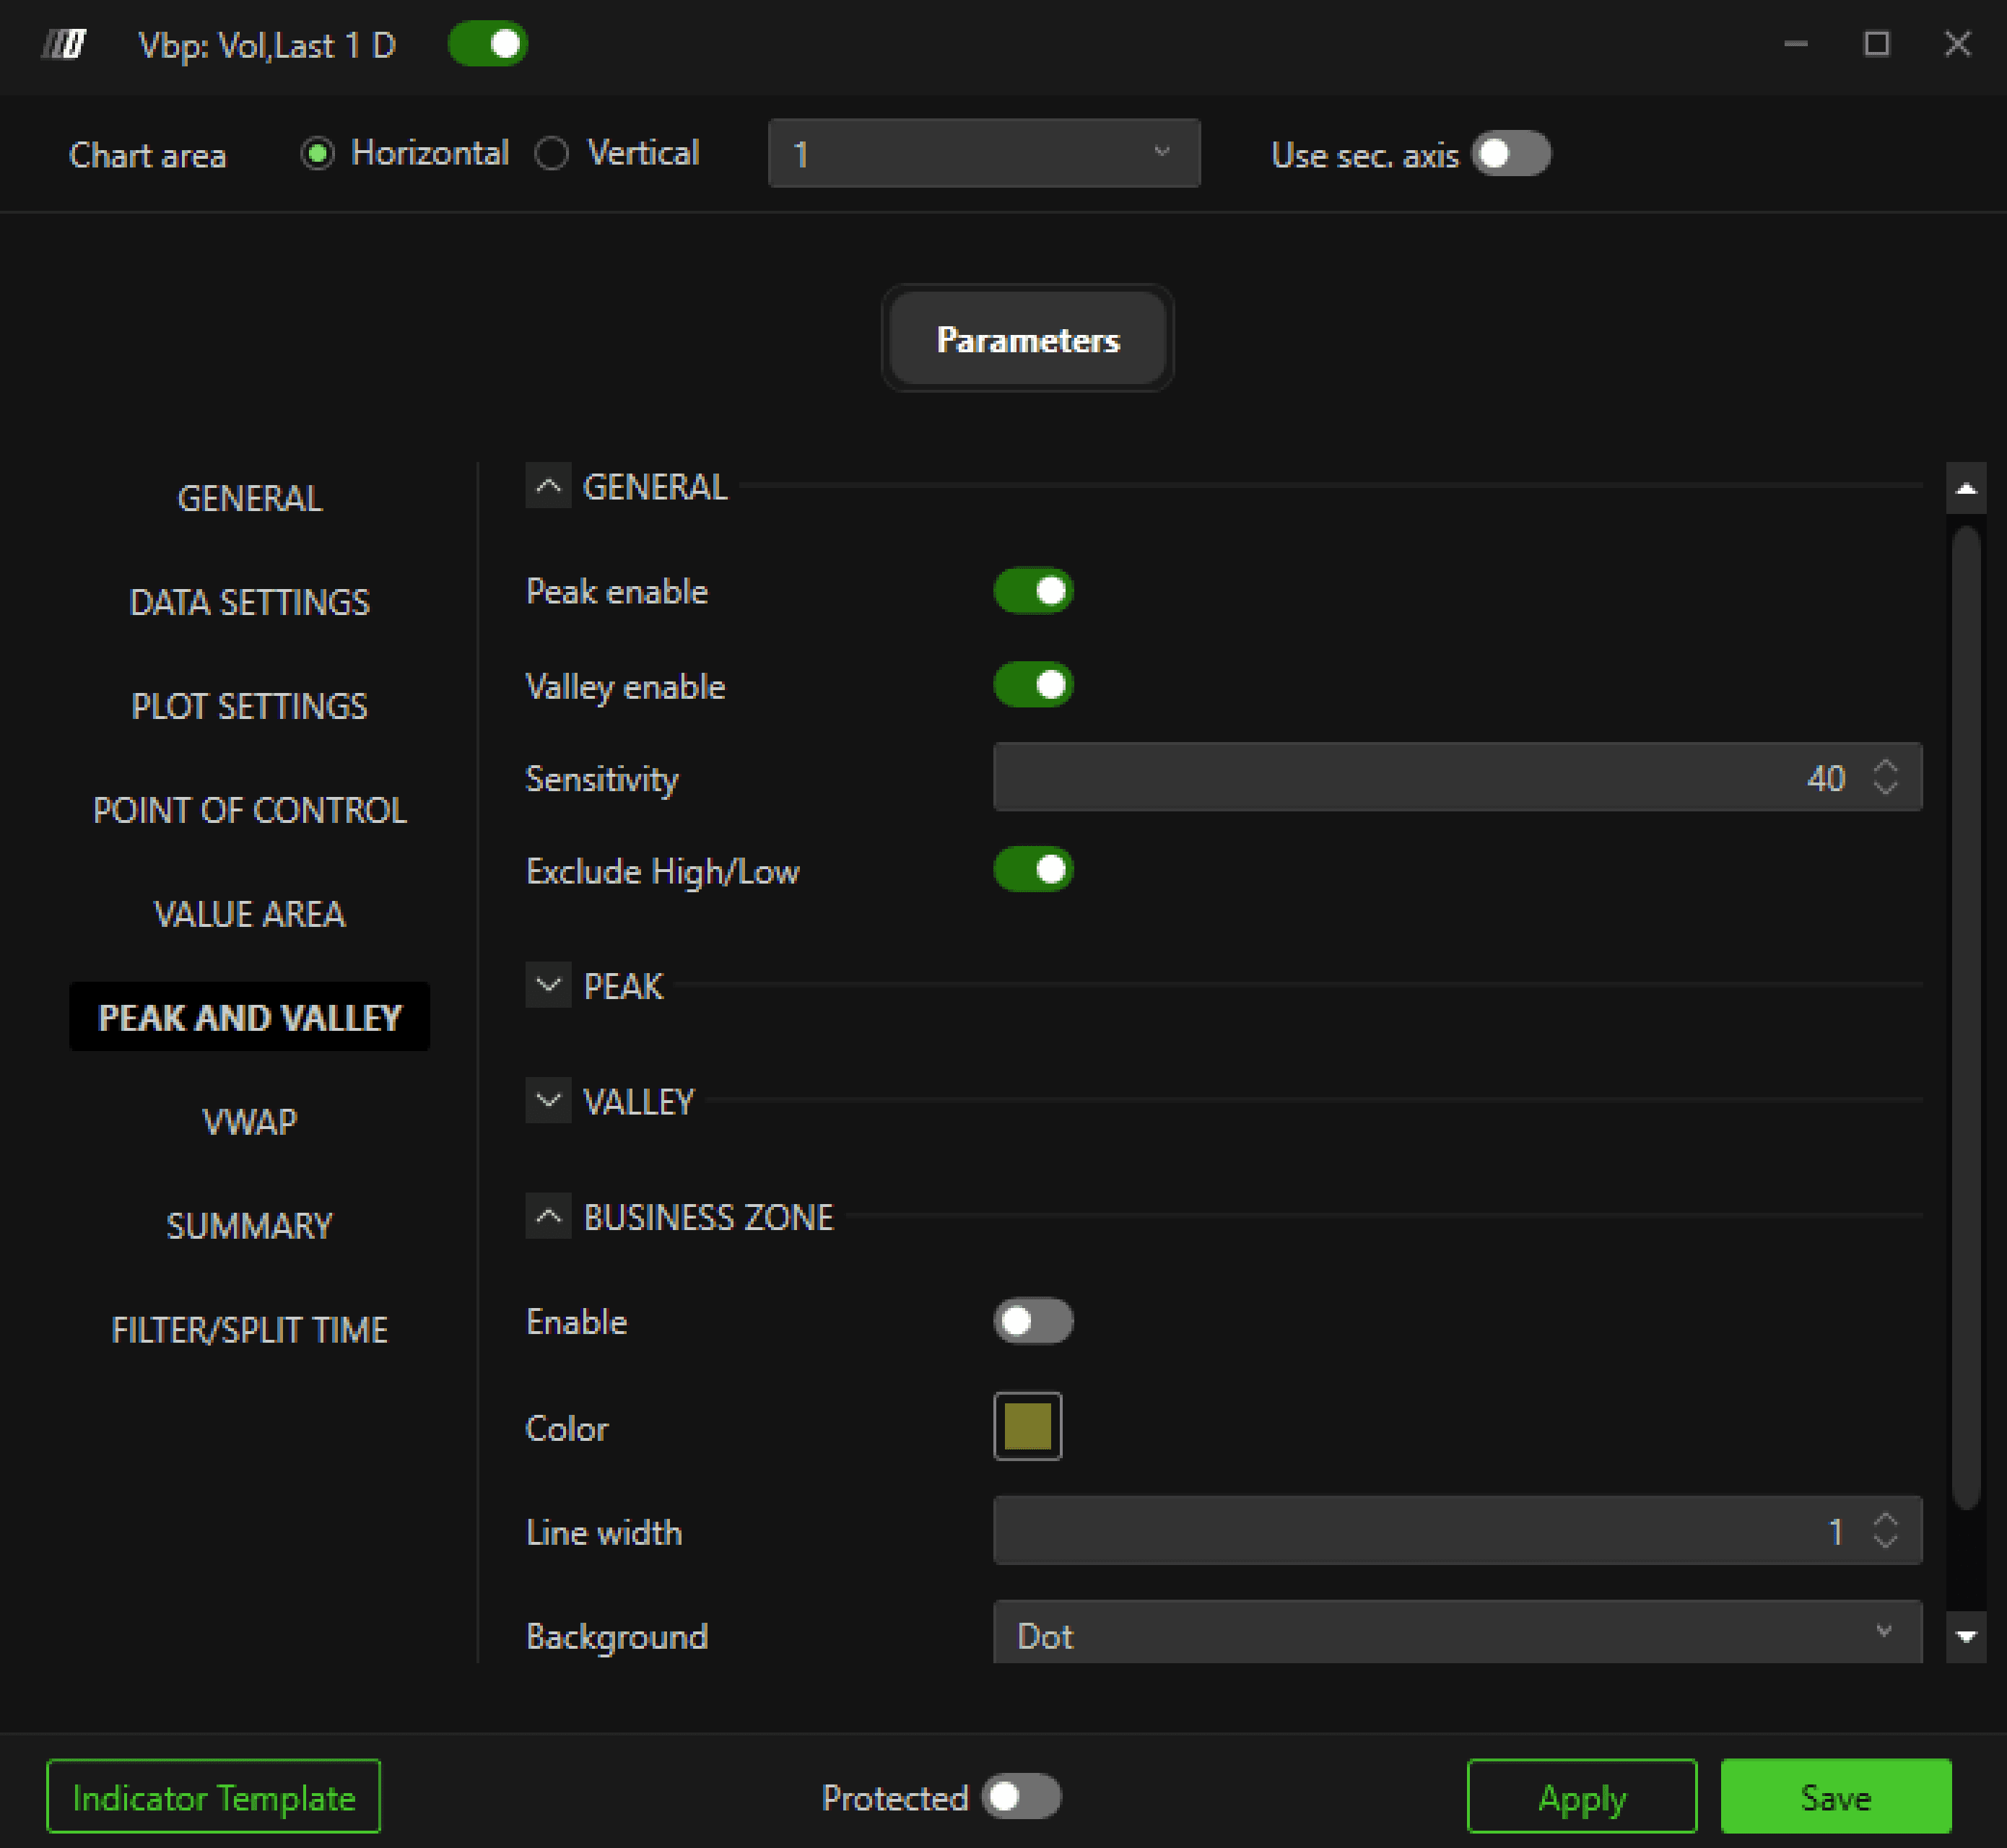
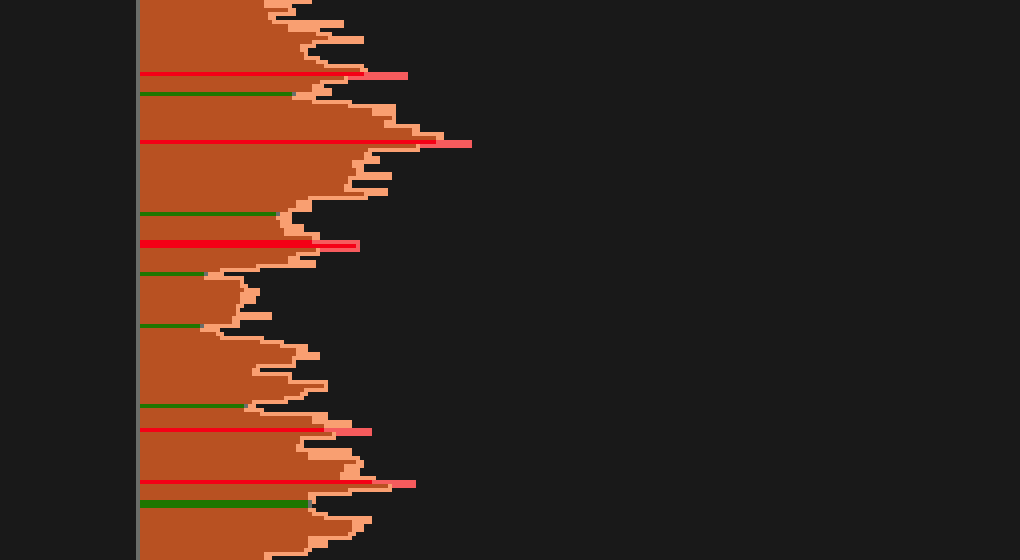
5.Picchi e valli
Con questa impostazione puoi evidenziare i nodi ad alto volume e i nodi a basso volume all'interno del profilo.
I picchi rappresentano i nodi ad alto volume.
Le valli rappresentano i nodi a basso volume.
Puoi personalizzarne l'aspetto (colori e stili) e regolare la sensibilità, che controlla con quale frequenza vengono rilevati i nodi.
Una sensibilità più alta aiuta a filtrare il rumore e mette in evidenza solo i nodi più significativi.
nell'immagine qui sotto puoi vedere che abbiamo nodi ad alto volume in rosso e nodi a basso volume in verde
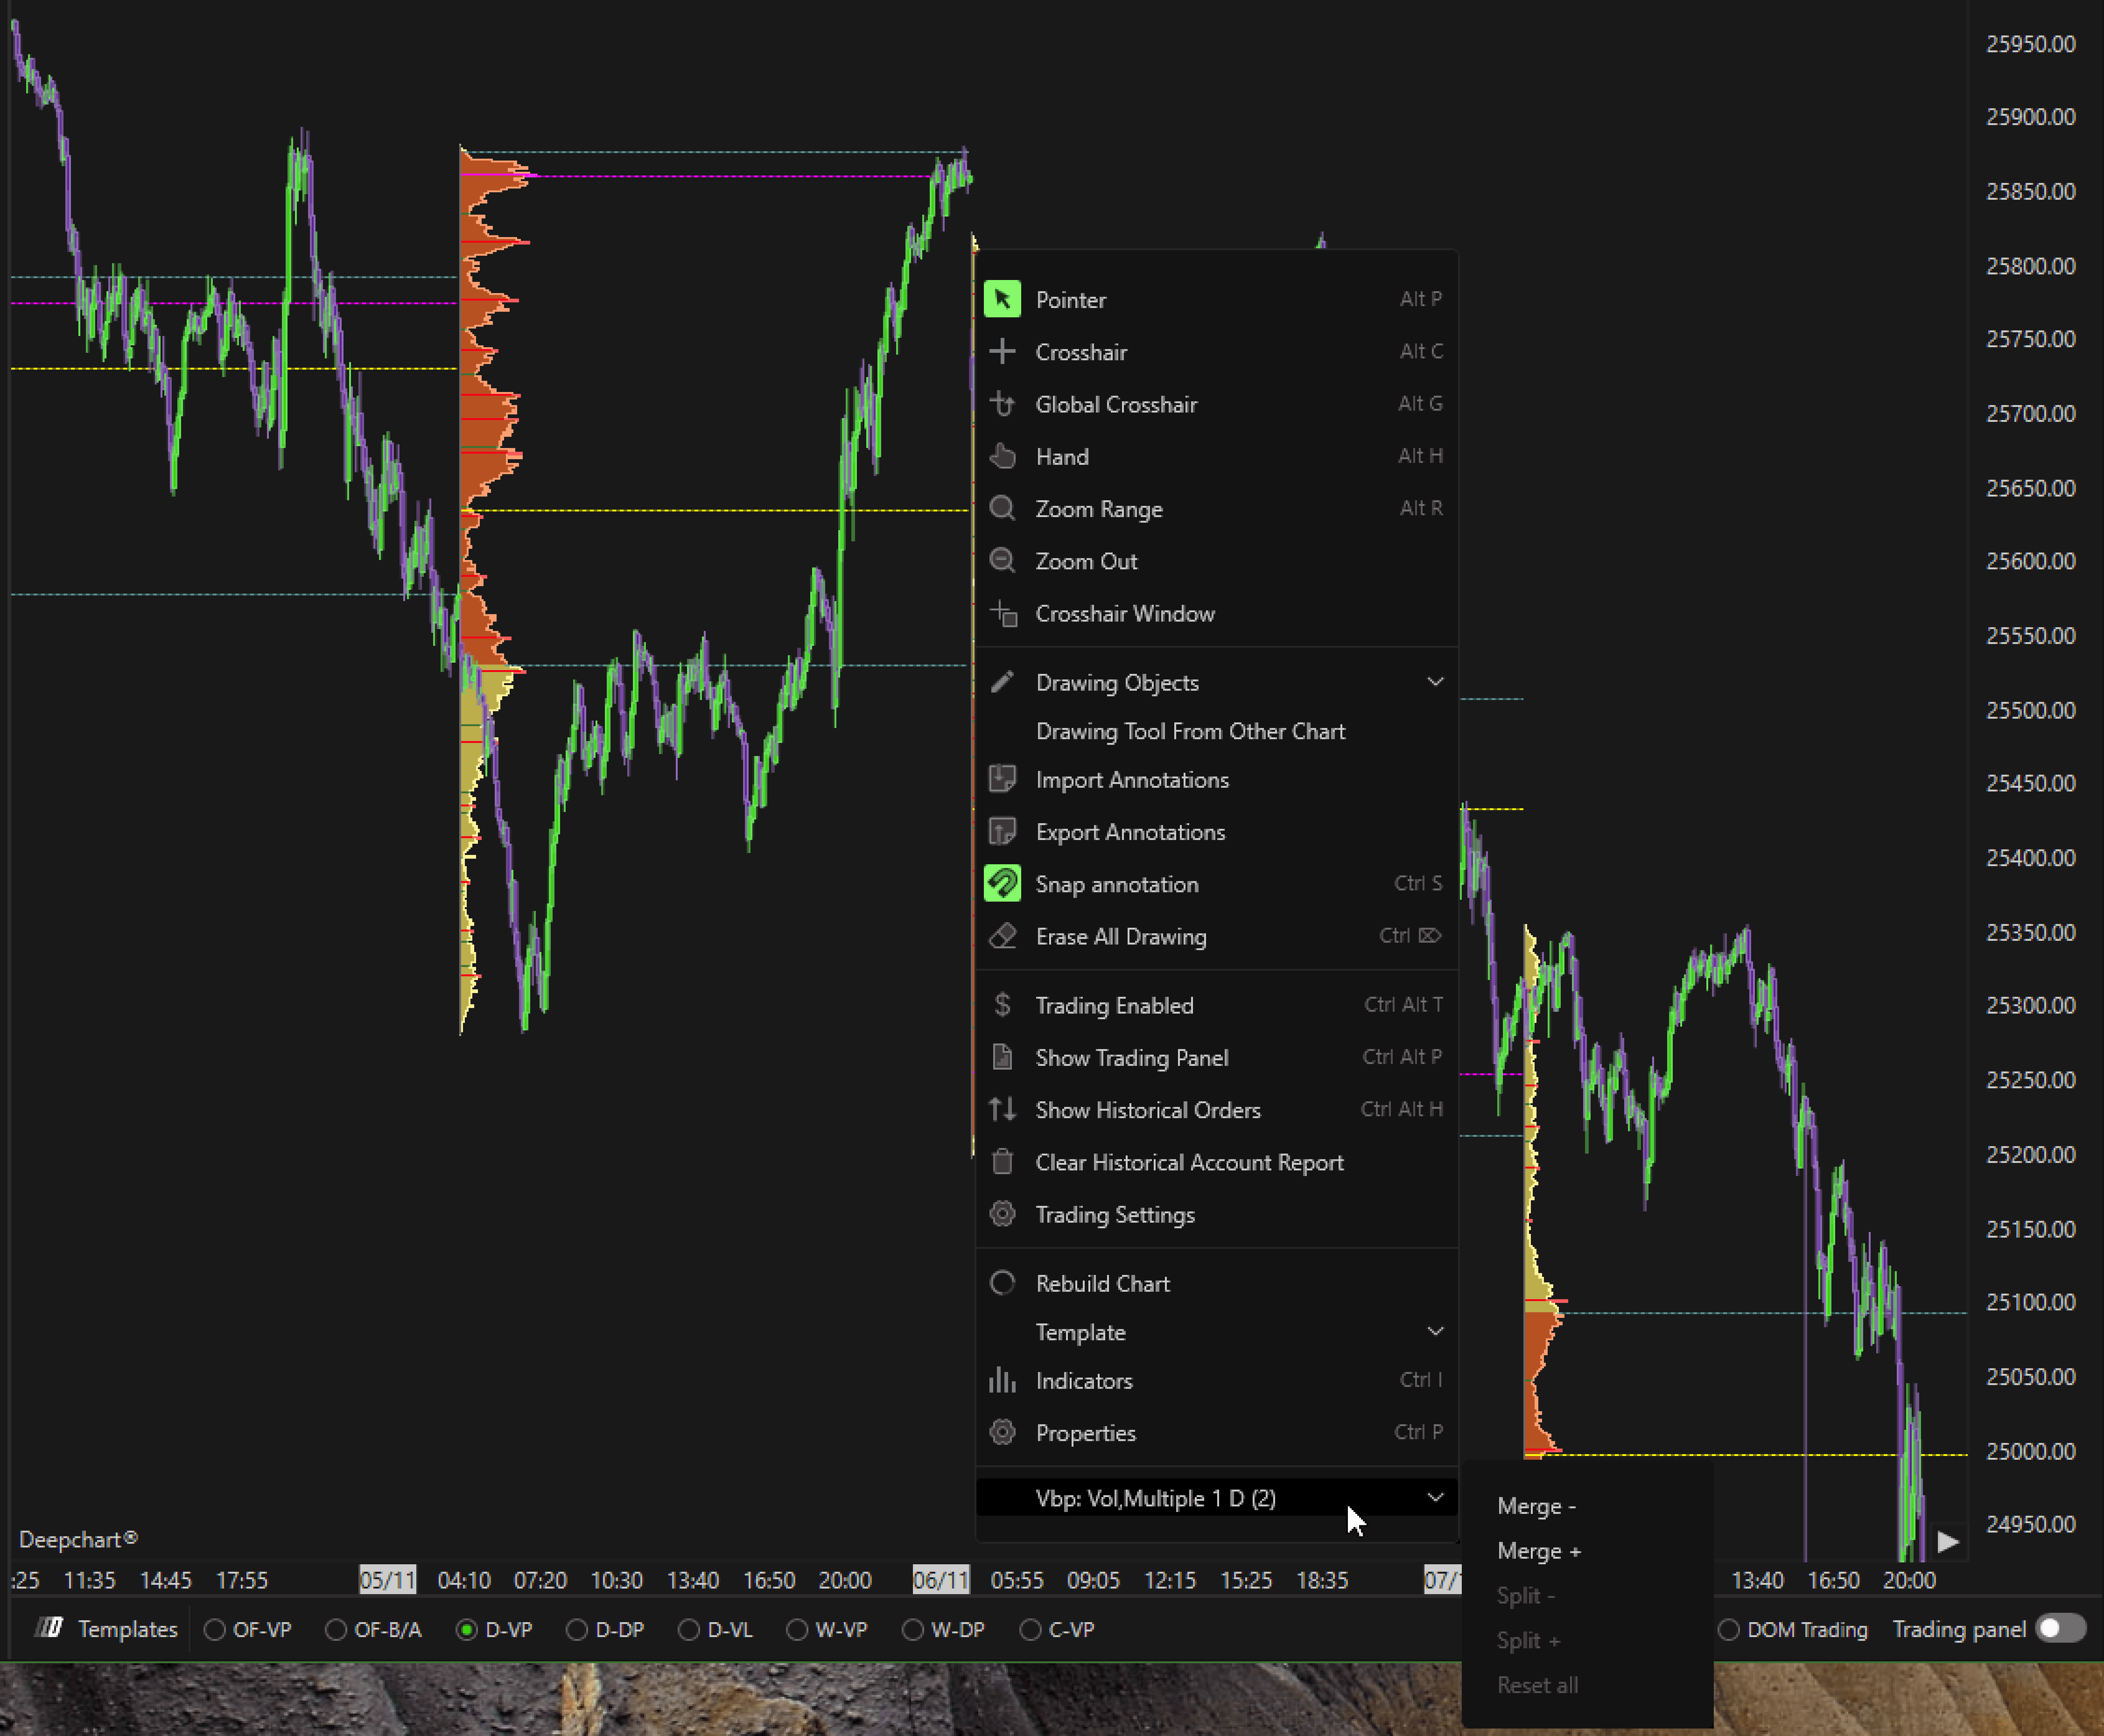
6.Unisci e dividi i profili
In DeepCharts, puoi unire o dividere i profili direttamente dal grafico.
Per farlo, fai clic con il tasto destro su qualsiasi profilo e vai all'ultima opzione nel menu.
Lì troverai i pulsanti per:
Merge- : Unisci con il profilo precedente
Merge+ : Unisci con il profilo successivo
Split- : Dividi dal profilo precedente
Split+ : Dividi dal profilo successivo
Reset: Ripristina tutte le fusioni
Questa funzione è utile quando vuoi combinare più sessioni in un profilo più grande oppure separarle per una vista più dettagliata.