Indicatori
Updated:
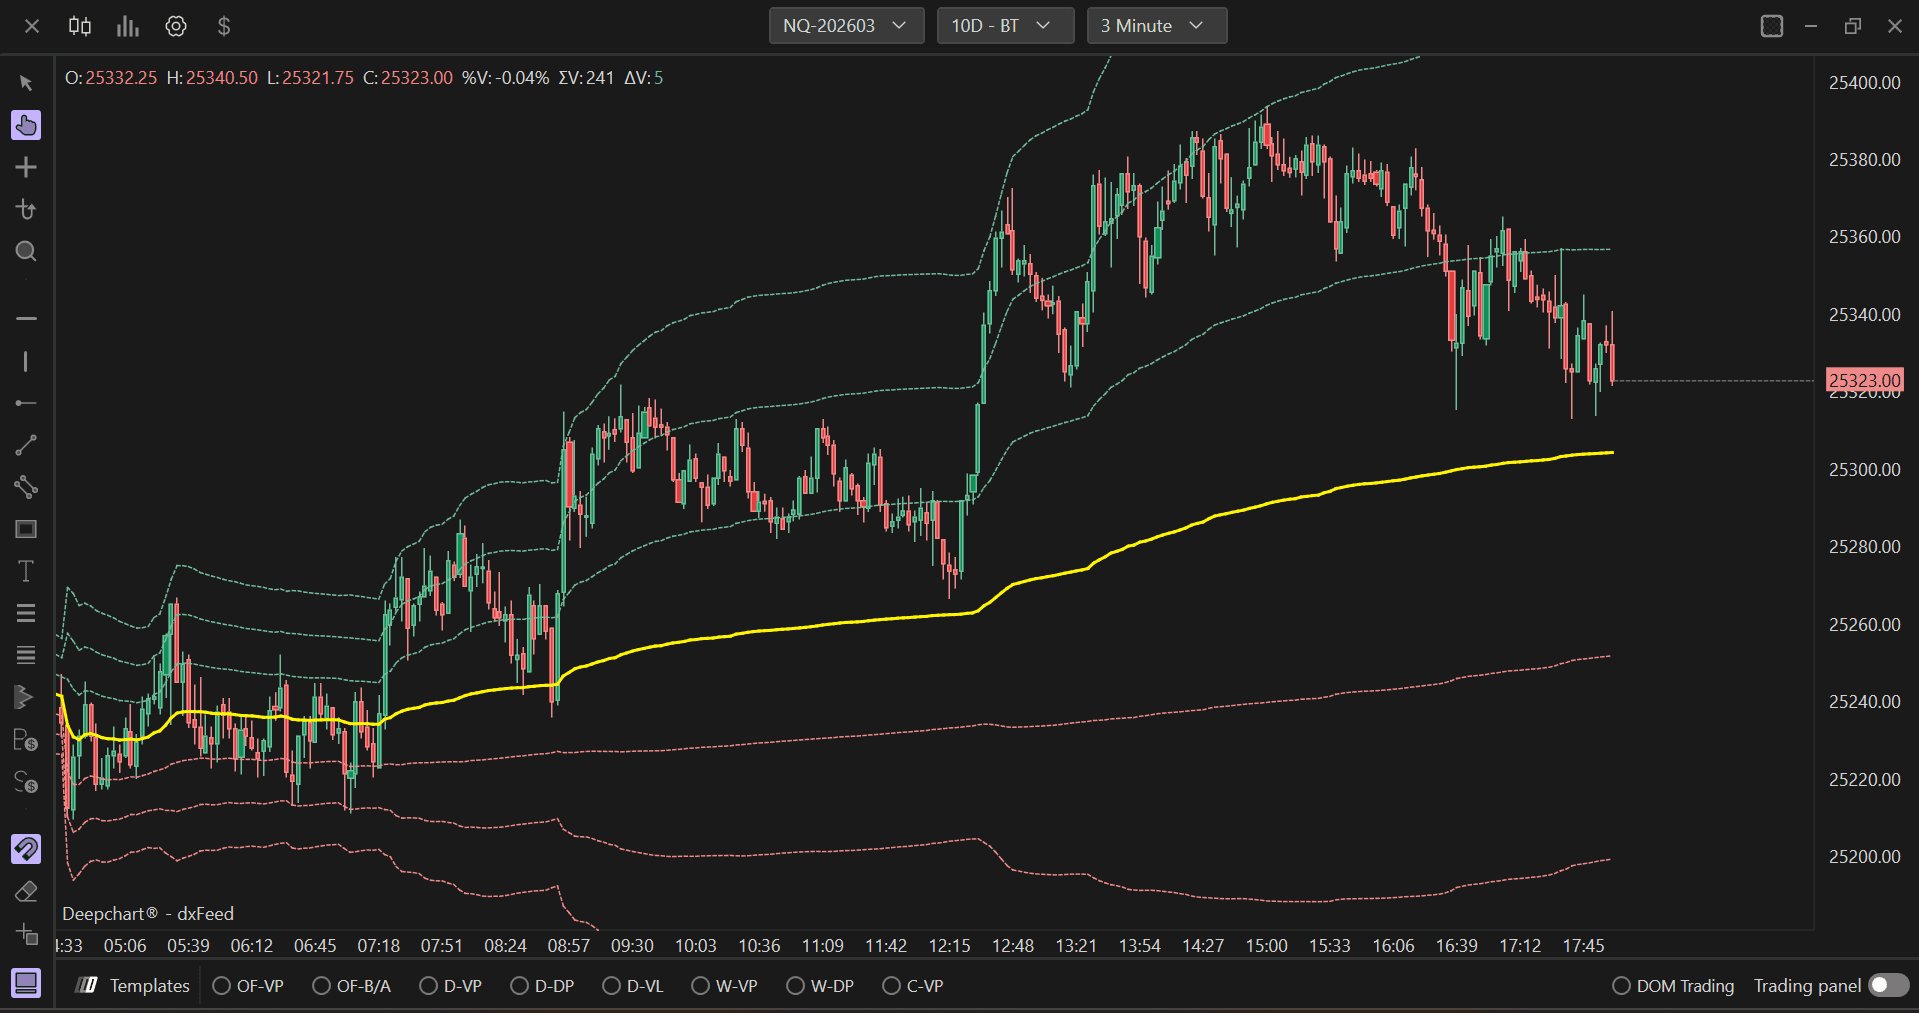
L’indicatore VWAP Envelopes visualizza il Prezzo Medio Ponderato per il Volume (VWAP) delle operazioni effettuate durante un determinato periodo di tempo e le relative deviazioni standard. Queste bande di deviazione standard sono tracciate sopra e sotto il VWAP per identificare la distanza media dei prezzi dal valore medio, offrendo ai trader un modo per misurare la volatilità dei prezzi rispetto alla media ponderata per il volume. Ogni deviazione standard indica una "banda" nell’intervallo di prezzo, aiutando i trader a contestualizzare le zone Premium e Discount.
La caratteristica unica di questo indicatore è che il suo calcolo non si basa sulla mezzanotte ma aggiorna i dati in modalità continua, sostituendo i vecchi dati con quelli nuovi man mano che procede, rendendolo ideale per l’analisi del trading intraday.
Utilizzo delle impostazioni
Facendo clic sull’icona delle impostazioni dell’indicatore si aprirà la finestra di configurazione, all’interno della quale potrai effettuare diverse scelte relative al funzionamento dell’indicatore stesso.
Generale
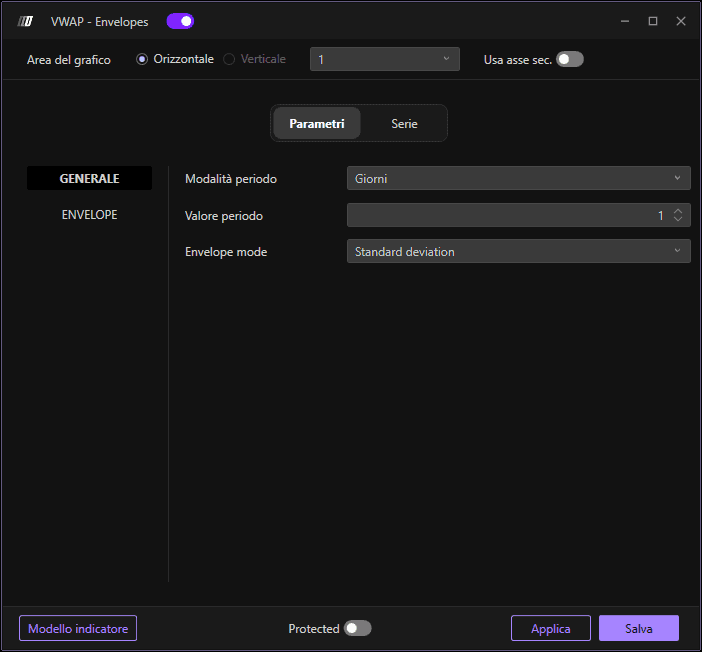
Modalità periodo
Ti consente di definire il periodo di riferimento per il calcolo dell’indicatore. Puoi scegliere tra:
Giornaliero: Mostra il VWAP degli ultimi n giorni. Questo offre una prospettiva VWAP di più lungo termine per lo swing trading e il position trading.
Minuti: Mostra il VWAP degli ultimi n minuti. L’uso della modalità di calcolo in minuti fornisce un VWAP su un periodo più breve, consentendoti di seguire più da vicino il movimento di prezzo e volume nel trading intraday.
Valore periodo
Definisce il valore del periodo indicato nelle impostazioni della Modalità periodo. Ad esempio, se la Modalità periodo è impostata su "Minuti", un Valore periodo di 60 calcolerà il VWAP degli ultimi 60 minuti.
Modalità (proiezioni) Envelope
Definisce la modalità di calcolo per gli Envelopes. Puoi scegliere tra:
Deviazione standard: Il calcolo degli Envelopes si basa sulle deviazioni standard. Questo misura quanto i prezzi si discostano tipicamente dal VWAP, con ciascuna banda che rappresenta 1, 2 o 3 deviazioni standard dalla media.
Percentuale del prezzo: Il calcolo degli Envelopes si basa sulla variazione percentuale del prezzo. Questo ti consente di definire bande envelope basate su una percentuale fissa sopra e sotto il VWAP (ad es. ±2%).
Parametri Envelope
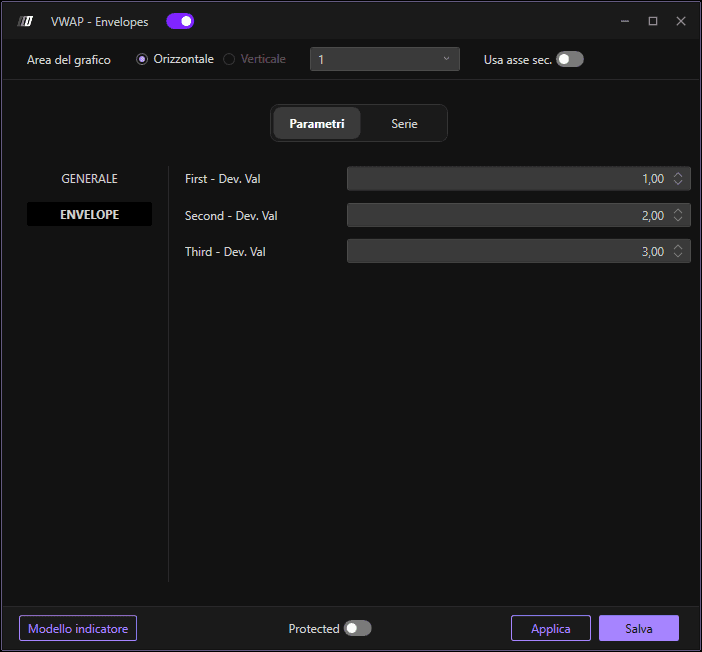
In questa sezione puoi definire i parametri per il calcolo degli Envelope:
1° Valore standard (1UP/1DW): Definisce la prima banda dell’envelope attorno al VWAP. 1UP rappresenta la banda superiore e 1DW rappresenta la banda inferiore. In genere, circa il 68% dell’azione dei prezzi rientra entro 1 deviazione standard.
2° Valore standard (2UP/2DW): Definisce la seconda banda dell’envelope attorno al VWAP. In genere, circa il 95% dell’azione dei prezzi rientra entro 2 deviazioni standard, rendendo queste bande utili per identificare movimenti estremi.
3° Valore standard (3UP/3DW): Definisce la terza banda dell’envelope attorno al VWAP. In genere, circa il 99,7% dell’azione dei prezzi rientra entro 3 deviazioni standard, rendendo queste bande utili per identificare estremi rari.
Sottografici
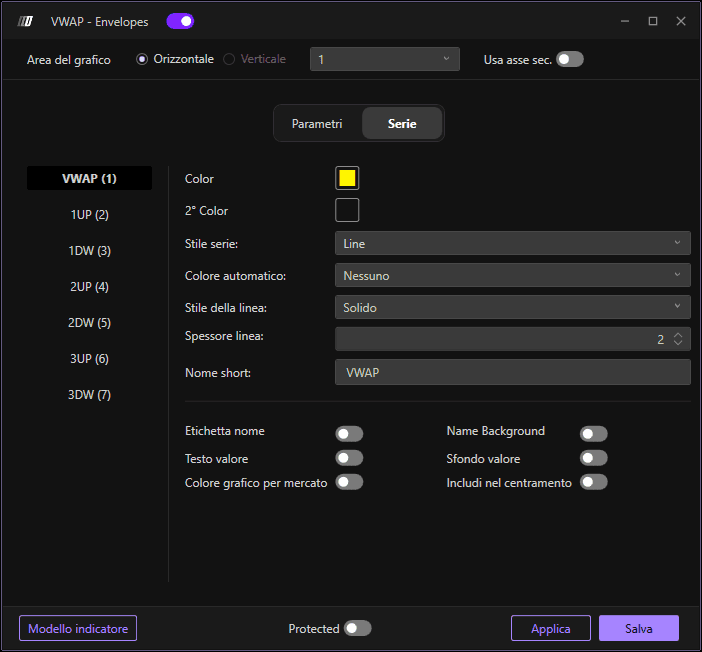
In questa sezione puoi modificare il colore e lo spessore delle linee VWAP e Envelope. Se vuoi nascondere una deviazione standard, fai clic su Series Style e seleziona Ignora.
Colore VWAP: Imposta il colore della linea VWAP principale
Colore 1UP/1DW: Imposta i colori delle bande della prima deviazione standard
Colore 2UP/2DW: Imposta i colori delle bande della seconda deviazione standard
Colore 3UP/3DW: Imposta i colori delle bande della terza deviazione standard
Stile linea: Scegli tra stili di linea continua, puntinata o tratteggiata
Larghezza linea: Regola la larghezza delle linee per una migliore visibilità
Nome breve: Personalizza il nome visualizzato per l’indicatore
Applicazione pratica
L’indicatore VWAP Envelopes è più efficace quando viene utilizzato per:
Identificazione di supporti e resistenze: La linea VWAP e le bande envelope fungono da livelli dinamici di supporto e resistenza basati sui prezzi ponderati per volume.
Identificazione delle zone Premium e Discount: I prezzi sopra il VWAP indicano zone Premium (rialziste), mentre i prezzi sotto indicano zone Discount (ribassiste).
Trading di mean reversion: Quando il prezzo si muove verso le bande esterne (2ª o 3ª deviazione standard), può segnalare un movimento estremo che probabilmente tornerà verso il VWAP.
Conferma del breakout: Una rottura sostenuta sopra l’envelope superiore o sotto quella inferiore può indicare l’inizio di un forte trend.
Trading intraday: L’uso del VWAP basato sui minuti consente ai trader di seguire con elevata precisione i movimenti intraday di prezzo e volume.
Nota: Il VWAP calcolato da questo indicatore si allinea al VWAP del Daily Volume Profile solo al termine della sessione, poiché il calcolo è continuo e non si basa sulla mezzanotte.