Indicatori
Updated:
L indicatore Statistiche di Mercato aiuta i trader a ottenere utili informazioni statistiche per configurare altri strumenti come Big Trades, Volume Clusters, Significant POCs, Delta Filter Bars e Time & Sales. Analizzando i dati caricati sul grafico di riferimento, consente ai trader di identificare i valori più frequenti e meno frequenti di un dataset selezionato dall'utente, fornendo un utile quadro statistico per individuare livelli significativi e impostare i parametri di altri indicatori.
Uso delle impostazioni
Cliccando sull'icona delle impostazioni dell'indicatore si aprirà la sua finestra di configurazione, nella quale è possibile effettuare diverse scelte riguardo alla funzionalità dell'indicatore stesso.
Generale
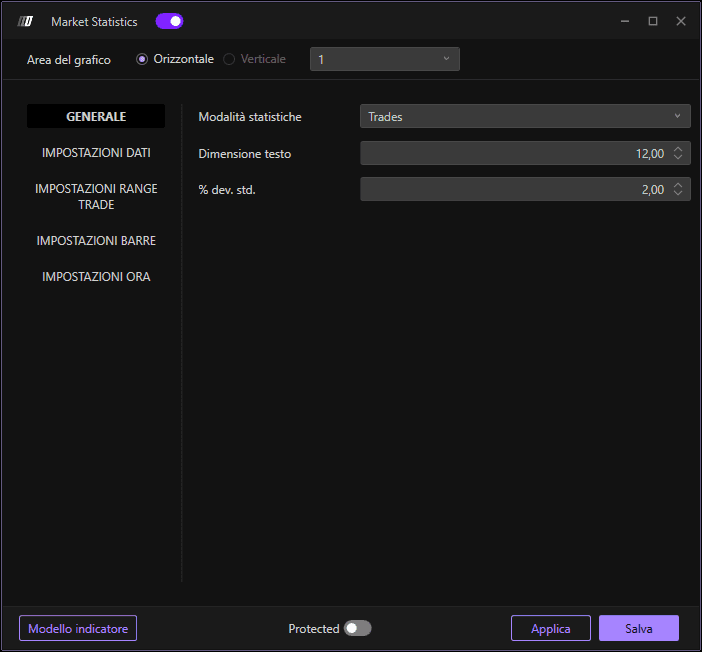
Modalità Statistica
Seleziona il tipo di statistiche da visualizzare:
Trade: Mostra statistiche basate sul numero di trade/contratti.
Barre: Fornisce una visualizzazione delle statistiche relative a barre e candele.
Dimensione del font
Imposta la dimensione del testo visualizzato per una migliore leggibilità delle statistiche sul grafico.
Deviazione Standard (Percentuale di deviazione standard)
Impostazione della percentuale di deviazione standard. La deviazione standard è una misura statistica che indica quanto i valori di un insieme di dati si discostano dalla media di tali valori.
Comprendere la deviazione standard: Più alta è la deviazione standard, più i dati si allontanano dalla media; più è bassa, più i dati sono concentrati intorno alla media.
Deviazione più bassa (ad es. 0,5-1,5): Filtra i valori più vicini alla media, individuando solo quelli più prossimi alla frequenza centrale dei volumi.
Deviazione più alta (ad es. 2-3): Amplia la selezione includendo valori più lontani dalla media, cogliendo un quadro più ampio dell'attività meno frequente.
Impostazioni dati
Tipo di dati
Determina il tipo di dati che desideri analizzare:
Volume: Misura l'ammontare totale di titoli negoziati in un determinato periodo di tempo.
Ordini: Traccia i dati degli ordini e le informazioni di inserimento.
Trade aggregati: Mostra il totale dei trade aggregati combinando i trade allo stesso livello di prezzo.
Filtro Min
Consente di impostare un valore minimo di filtro per i dati selezionati, permettendoti di escludere i valori al di sotto del livello scelto.
Filtro Max
Consente di impostare un valore massimo di filtro per i dati selezionati, permettendoti di escludere i valori al di sopra di questa soglia.
Impostazioni Trade Range

Range iniziale
Definisce il valore iniziale per il calcolo del range di trade. Imposta il limite inferiore dell'intervallo che desideri analizzare.
Range finale
Specifica l'ultimo valore del range per il quale verranno eseguiti i calcoli, definendo l'estensione del range da analizzare. Imposta il limite superiore.
Step Range
Imposta l'incremento tra ciascun valore del range. Questa opzione consente di stabilire con quale frequenza eseguire le analisi sui diversi intervalli di range. Ad esempio, un passo di 50 analizzerà i range 0-50, 50-100, 100-150, ecc.
Impostazioni barre
Barra dati base
Scegli la base per le statistiche delle barre:
POC (Point of Control): Il calcolo statistico si concentrerà sul POC di ciascuna barra.
Delta POC: Il calcolo sarà eseguito sul Delta POC, ossia il punto in cui la differenza tra acquisti e vendite è massima.
Volume: Il calcolo sarà eseguito sul volume dei trade che si verificano per ciascuna barra.
Impostazioni temporali
Definisce i limiti temporali per il calcolo delle statistiche, specificando un filtro iniziale e finale per selezionare l'intervallo di tempo di interesse.
Filtro iniziale
Imposta l'orario di inizio da cui raccogliere i dati. Ad esempio, iniziare 15 minuti dopo l'apertura del mercato per escludere la volatilità di apertura.
Filtro finale
Definisce l'orario di fine per la raccolta dei dati, consentendo di limitare l'analisi a un intervallo specifico della giornata di trading. Ad esempio, terminare 15 minuti prima della chiusura del mercato per escludere la volatilità di chiusura.
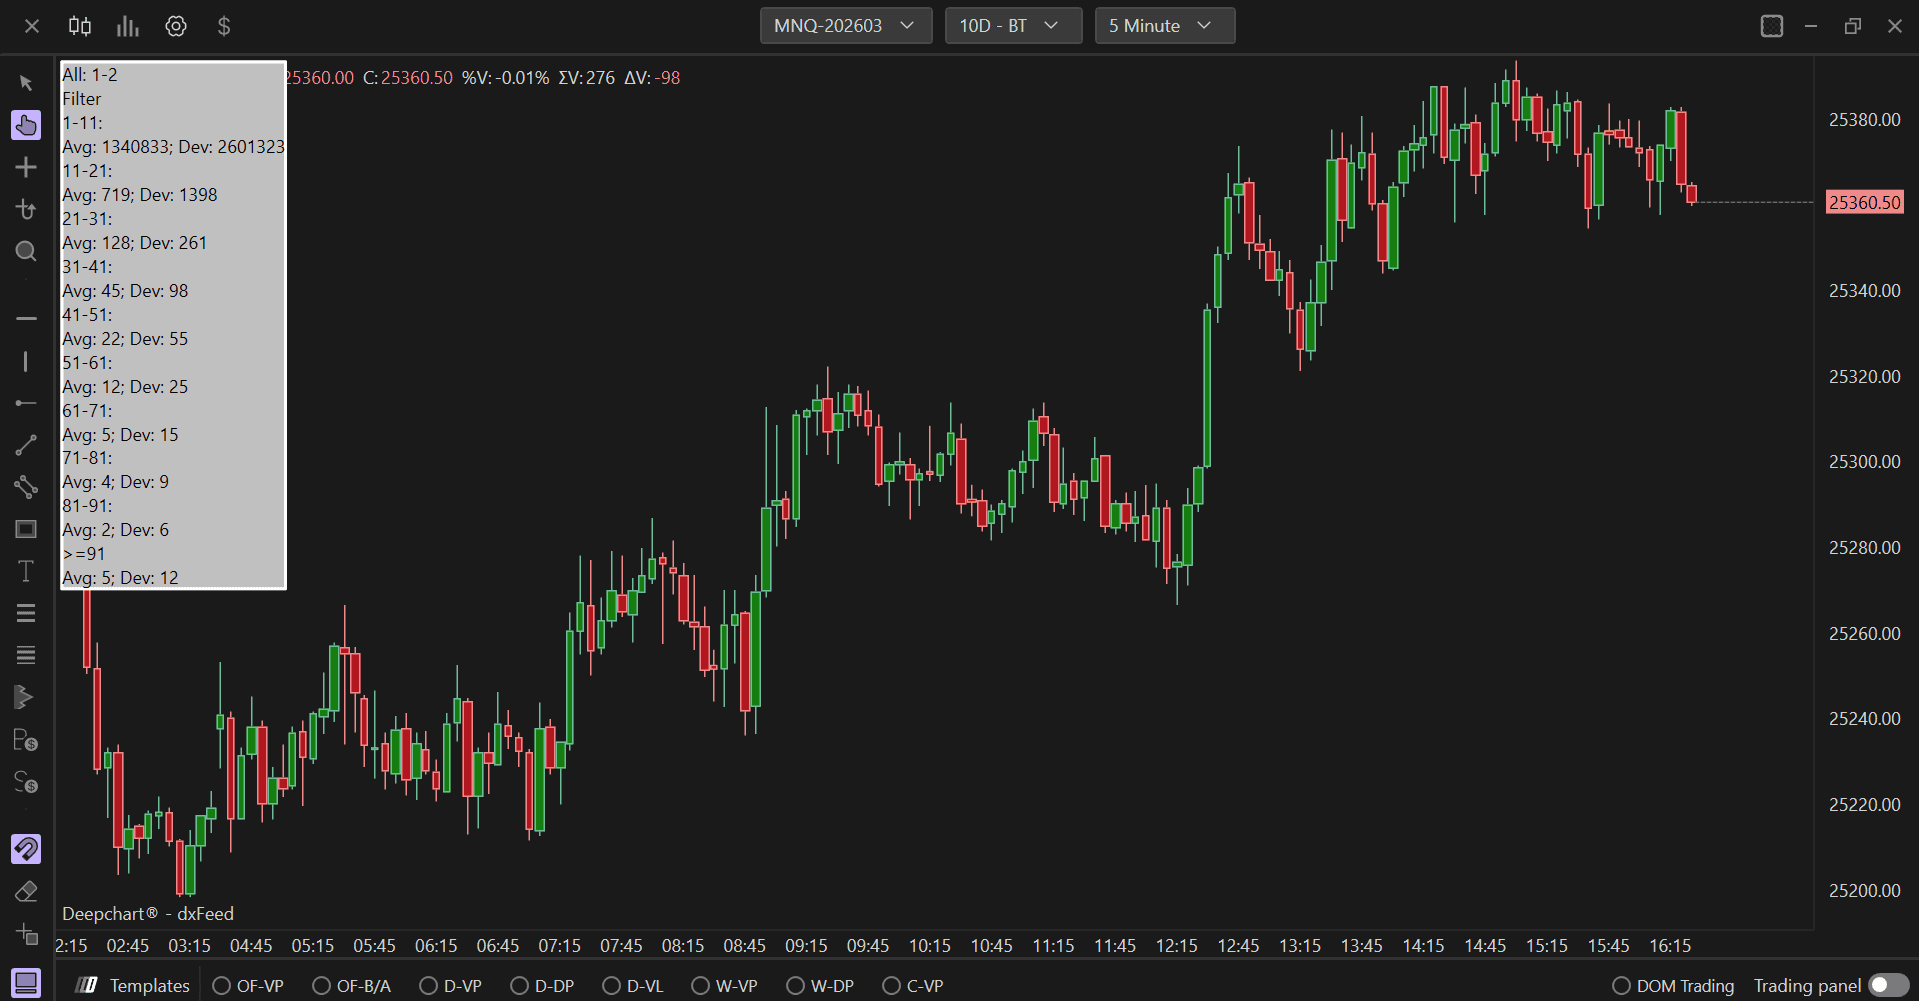
Comprendere l'output delle statistiche
L'indicatore Statistiche di Mercato mostra i risultati raggruppati per intervalli, visualizzando:
AVG (Average): La media del numero di eventi registrati per ciascun intervallo, mostrando quante volte i valori in quell'intervallo si sono verificati durante il periodo di analisi.
Dev (Deviation): La deviazione massima osservata per il relativo intervallo, mostrando la frequenza di picco osservata.
Esempio: Se un intervallo "300-350" mostra AVG: 9 e Dev: 17, significa che i trade aggregati in quella fascia di dimensione si verificano in media 9 volte al giorno, con un massimo di 17 occorrenze osservate.