Indicatori
Updated:
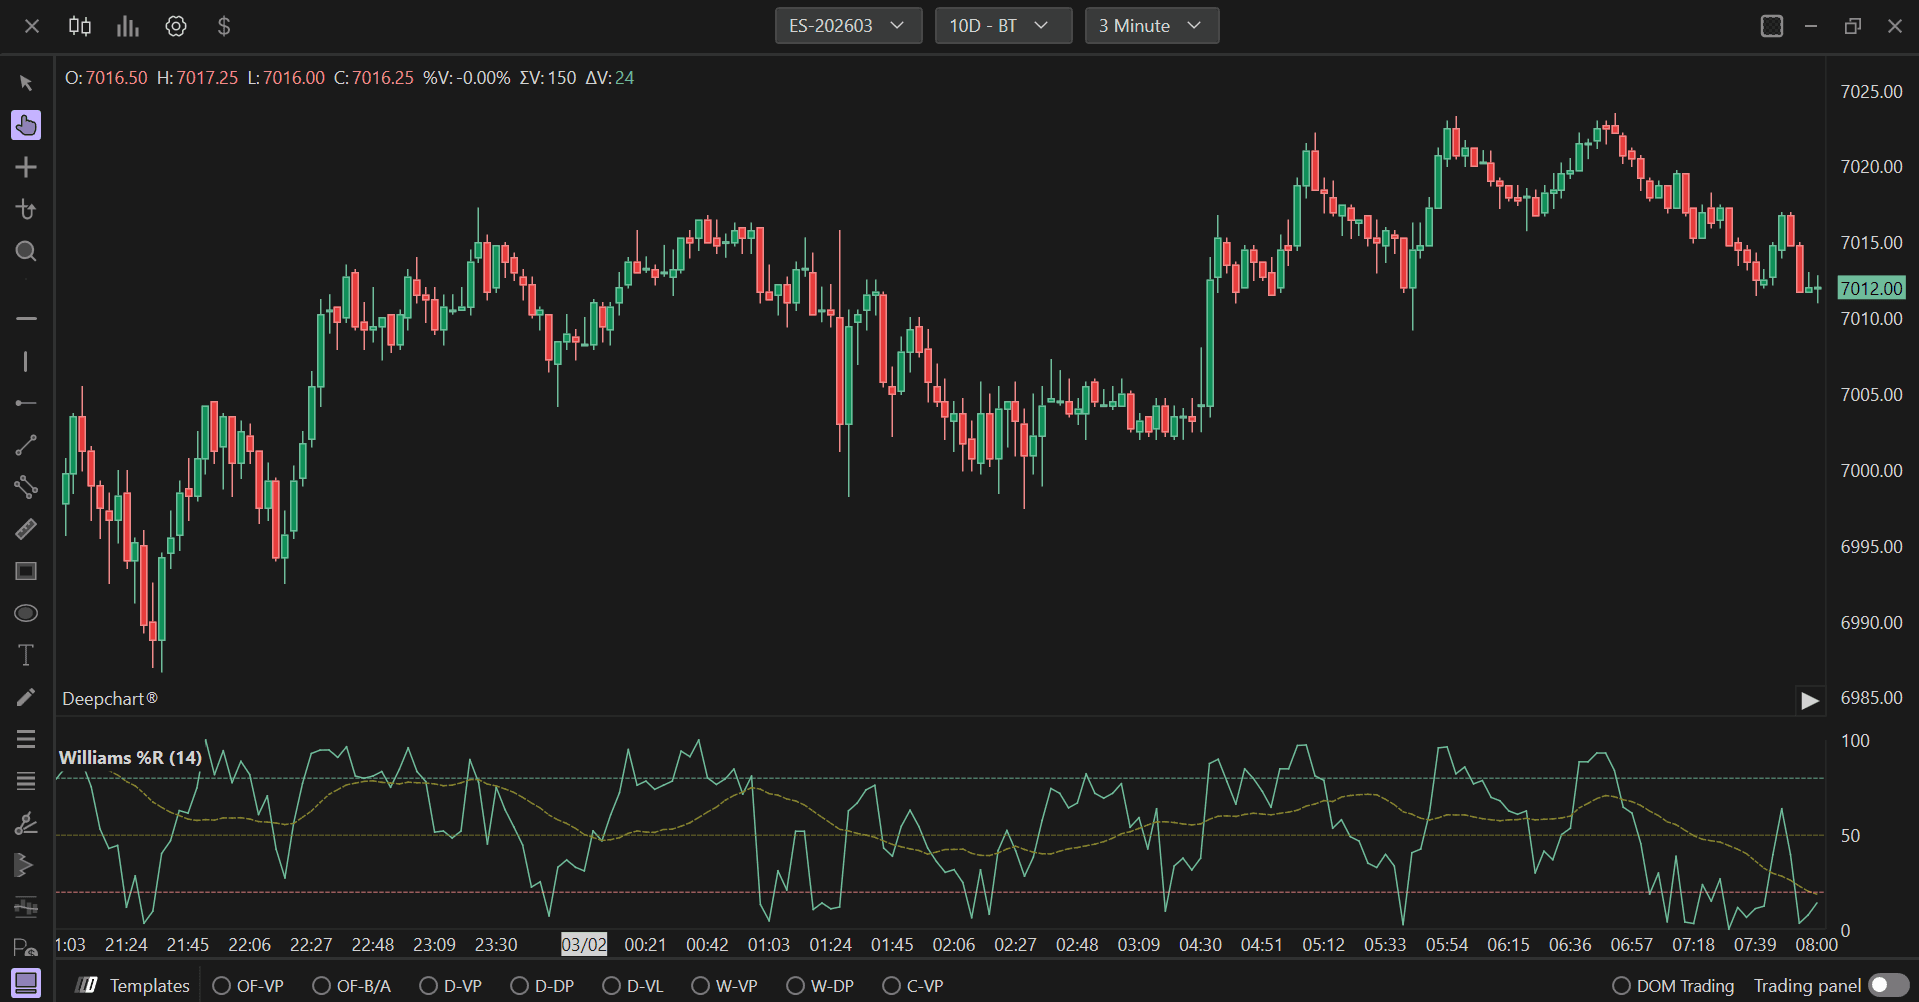
Il Williams %R (Williams Percent Range) è un indicatore di momentum che misura i livelli di ipercomprato e ipervenduto. Confronta il prezzo di chiusura con il range massimo-minimo su un periodo specifico, mostrando valori compresi tra 0 e 100. Valori superiori a 80 indicano in genere condizioni di ipercomprato, mentre valori inferiori a -20 suggeriscono ipervenduto. L'indicatore aiuta i trader a individuare potenziali punti di inversione e a valutare la forza dei movimenti di prezzo.
Impostazioni di utilizzo
Facendo clic sull'icona delle impostazioni dell'indicatore si aprirà la finestra di configurazione, all'interno della quale sarà possibile effettuare diverse scelte relative al funzionamento dell'indicatore stesso.
Impostazioni
Lunghezza
Definisce il periodo di lookback per il calcolo del Williams %R. Il valore predefinito è 14. Questo parametro determina quanti bar vengono utilizzati per individuare il massimo più alto e il minimo più basso. Una lunghezza più breve (ad es. 10) rende l'indicatore più sensibile e reattivo alle variazioni di prezzo, generando segnali più frequenti. Una lunghezza più lunga (ad es. 20 o più) crea una linea più fluida con meno segnali, potenzialmente più affidabili, considerando un intervallo di prezzo più ampio.
Impostazioni della media
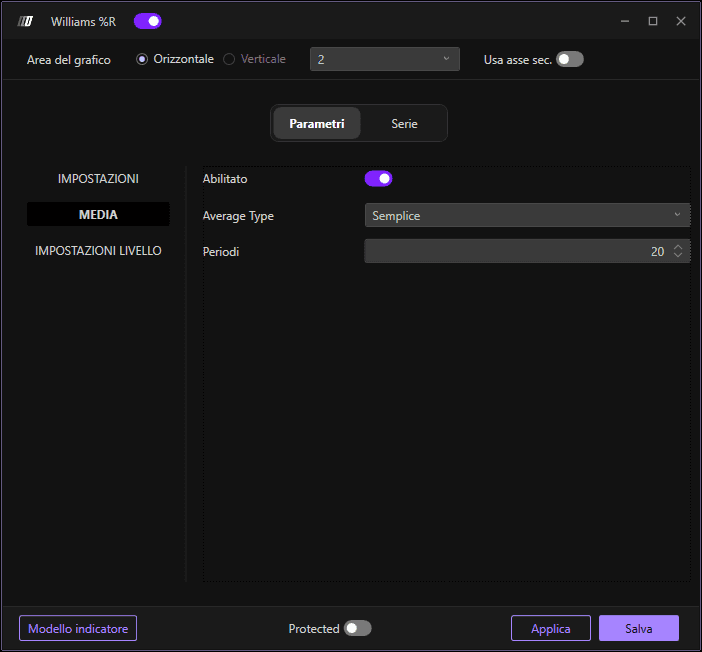
Abilita
Quando abilitato, applica una smussatura tramite media mobile alla linea del Williams %R. Questa smussatura riduce il rumore e le fluttuazioni di breve termine, rendendo più chiari trend e segnali. La linea smussata aiuta a filtrare i movimenti di prezzo minori e a concentrarsi sui cambiamenti direzionali più significativi.
Tipo di media
Definisce il tipo di media mobile applicata per smussare il Williams %R. Le opzioni disponibili sono:
Semplice: Media Mobile Semplice (SMA), che attribuisce lo stesso peso a tutti i valori del periodo.
Esponenziale: Media Mobile Esponenziale (EMA), che attribuisce maggiore peso ai valori più recenti per una risposta più rapida ai cambiamenti.
Triangolare: Media Mobile Triangolare, che applica una doppia smussatura per risultati ancora più fluidi.
Ponderata: Media Mobile Ponderata (WMA), che attribuisce progressivamente più peso ai valori più recenti.
Lunghezza
Imposta la lunghezza del periodo per la media mobile di smussatura. Il valore predefinito è 20. Questo determina quanti valori del Williams %R vengono utilizzati nel calcolo della smussatura. Valori più alti creano linee più fluide e meno sensibili ai cambiamenti recenti, mentre valori più bassi mantengono una maggiore reattività all'azione dei prezzi corrente. Questo va regolato in base al proprio timeframe di trading e alla propria strategia.
Impostazioni dei livelli
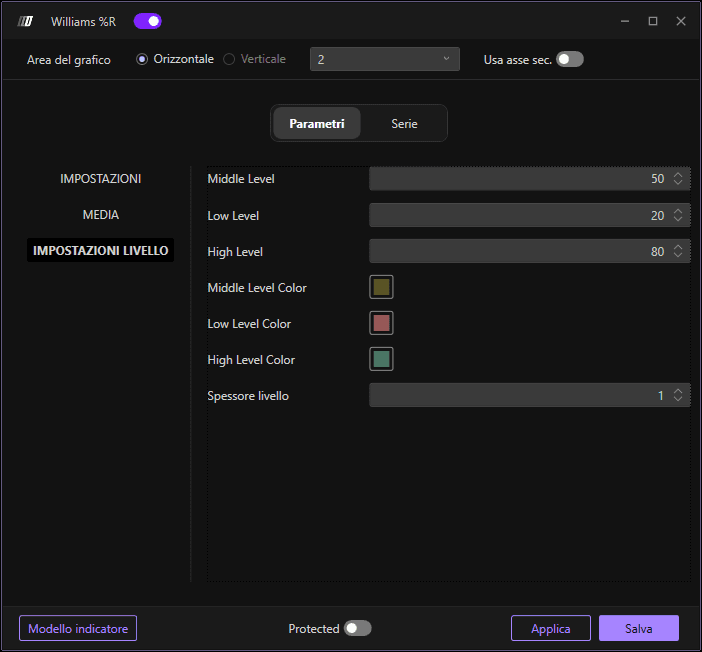
Livello intermedio
Imposta il livello di riferimento centrale sulla scala del Williams %R. Il valore predefinito è 50. Questo livello funge da punto medio di riferimento, aiutando i trader a identificare quando l'indicatore si trova nella metà superiore o inferiore del suo intervallo. Alcuni trader usano questo livello per valutare la direzione complessiva del momentum.
Livello basso
Definisce la soglia di ipervenduto. Il valore predefinito è 20. Quando il Williams %R scende al di sotto di questo livello, suggerisce che il mercato potrebbe essere in ipervenduto, segnalando potenzialmente un'opportunità di acquisto o un'inversione al rialzo in arrivo. Questo livello aiuta a individuare una forte pressione al ribasso.
Livello alto
Definisce la soglia di ipercomprato. Il valore predefinito è 80. Quando il Williams %R sale al di sopra di questo livello, suggerisce che il mercato potrebbe essere in ipercomprato, segnalando potenzialmente un'opportunità di vendita o un'inversione al ribasso in arrivo. Questo livello aiuta a individuare una forte pressione al rialzo.
Colore del livello intermedio
Imposta il colore della linea del livello di riferimento centrale. Scegli un colore neutro che garantisca una buona visibilità sullo sfondo del grafico senza sovrastare la linea principale del Williams %R. Questo aiuta a distinguere il riferimento centrale dai livelli di ipercomprato e ipervenduto.
Colore del livello basso
Imposta il colore della linea del livello di ipervenduto. Di solito utilizza un colore che indichi potenziali opportunità di acquisto o condizioni di ipervenduto. Questo segnale visivo aiuta i trader a identificare rapidamente quando l'indicatore entra nella zona di ipervenduto.
Colore del livello alto
Imposta il colore della linea del livello di ipercomprato. Di solito utilizza un colore che indichi potenziali opportunità di vendita o condizioni di ipercomprato. Questo segnale visivo aiuta i trader a identificare rapidamente quando l'indicatore entra nella zona di ipercomprato.
Spessore dei livelli
Regola lo spessore di tutte e tre le linee di riferimento dei livelli (intermedio, basso e alto). Il valore predefinito è 1. Aumentare questo valore rende le linee dei livelli più evidenti e più facili da vedere sul grafico, mentre diminuirlo crea linee di riferimento più sottili e discrete che non dominano la visualizzazione.
Subgrafici
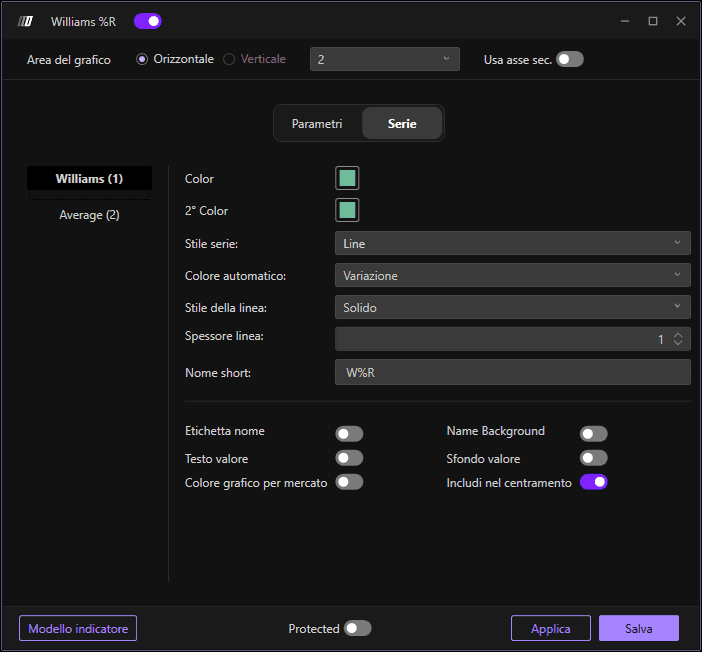
Williams
Questa è la linea principale del Williams %R che visualizza i valori primari dell'oscillatore. La designazione (1) indica che questa è la prima serie tracciata dall'indicatore.
Colore
Imposta il colore principale della linea del Williams %R (serie 1). Scegli un colore che offra un buon contrasto con lo sfondo del grafico e che sia distinto dal colore della linea media. Questa è la linea principale su cui i trader si concentreranno per i segnali.
2° colore
Imposta il colore secondario per la linea della media smussata (serie 2). Dovrebbe essere visivamente distinto dal colore della linea principale del Williams %R, consentendo ai trader di differenziare facilmente l'indicatore grezzo dalla sua versione smussata.
Stile del subgrafico
Definisce come vengono visualizzati i dati del Williams %R. L'impostazione predefinita è "Line", che mostra l'indicatore come una linea continua, facilitando il monitoraggio dei cambiamenti di momentum e l'identificazione dei pattern di trend. Altre opzioni possono includere punti, barre o altre rappresentazioni visive.
Colore automatico
Determina la logica di colorazione automatica della linea del Williams %R. Impostalo su "Slope" per cambiare automaticamente il colore della linea in base al fatto che l'indicatore stia salendo o scendendo.
Stile della linea
Imposta lo stile della linea del Williams %R. L'impostazione predefinita è "Solid" per una linea continua e senza interruzioni. Altre opzioni includono tratteggiata, puntinata, che possono aiutare a distinguere questo indicatore dagli altri sul grafico.
Spessore della linea
Regola lo spessore della linea del Williams %R. Il valore predefinito è 1. Aumentare questo valore rende la linea più evidente e più facile da vedere, soprattutto su schermi più grandi o quando si monitorano più indicatori.
Nome breve
Consente di impostare un nome breve o un'etichetta personalizzata per l'indicatore che apparirà nella legenda del grafico. L'impostazione predefinita è "W%R". Questo è utile per distinguere tra più indicatori Williams %R con parametri diversi o quando si desidera usare una convenzione di denominazione personalizzata.