Indicatori
Updated:
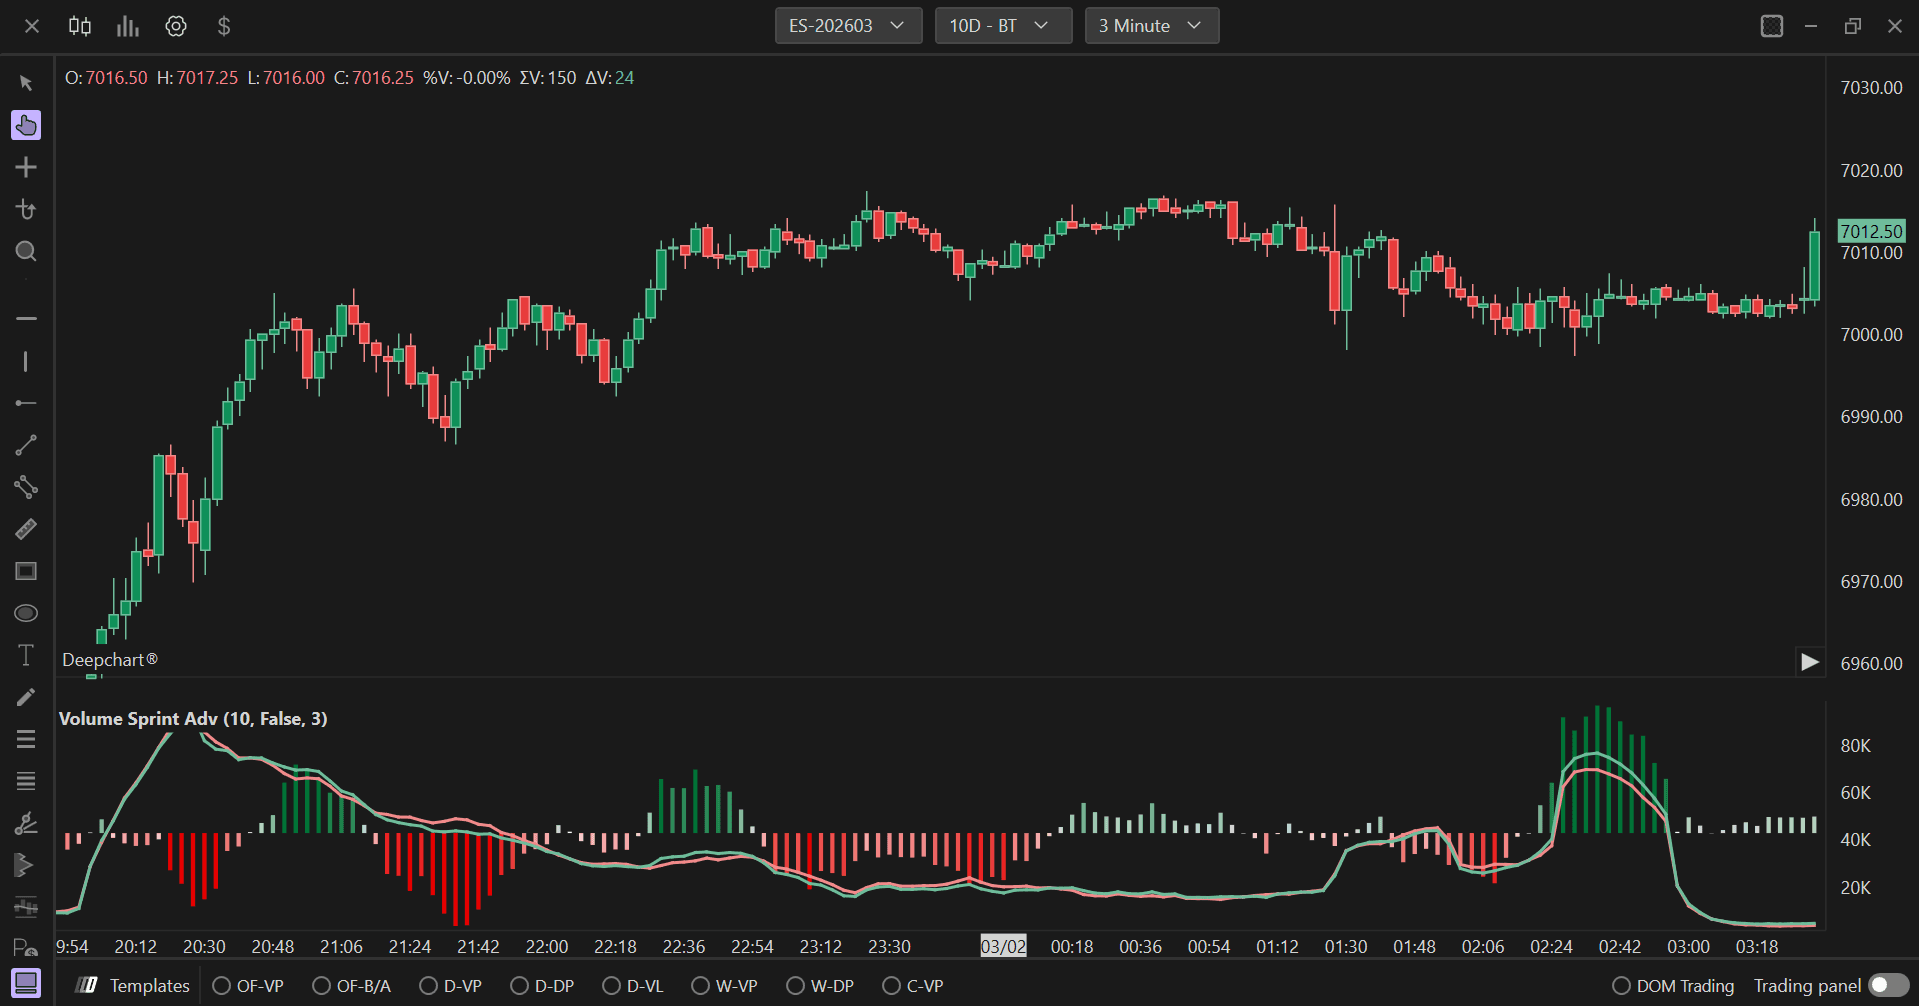
L’indicatore Volume/Delta Sprint visualizza i valori cumulativi di volume e delta su periodi di tempo specificati come istogramma in un pannello separato. Aiuta i trader ad analizzare i pattern di accumulo dei volumi, identificare i periodi di pressione d’acquisto o di vendita e valutare la forza alla base dei movimenti di prezzo. L’indicatore offre opzioni avanzate di smussamento e diversi tipi di input dati per un’analisi completa del volume.
Impostazioni di utilizzo
Facendo clic sull’icona delle impostazioni dell’indicatore si aprirà la sua finestra di configurazione, all’interno della quale sarà possibile effettuare diverse scelte relative alla funzionalità dell’indicatore stesso.
Parametri generali
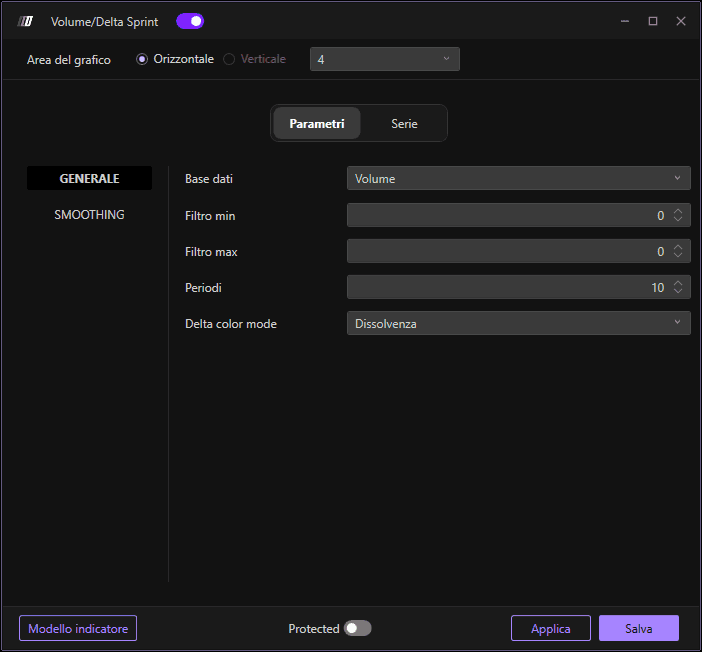
Dati di input
Definisce il tipo di dati utilizzati per il calcolo dello sprint. Le opzioni disponibili sono:
Volume: Utilizza il volume totale scambiato, mostrando l’attività di trading complessiva indipendentemente dalla direzione.
Ordine: Utilizza i dati del flusso degli ordini, tracciando gli ordini effettivamente inseriti nel mercato.
Trade: Utilizza i dati dei trade eseguiti, con particolare attenzione alle transazioni completate.
Filtro Min
Imposta il valore minimo di soglia per filtrare i dati. I valori al di sotto di questa soglia verranno esclusi dal calcolo, aiutando a rimuovere il rumore e a concentrarsi su movimenti significativi di volume o delta.
Filtro Max
Imposta il valore massimo di soglia per filtrare i dati. I valori al di sopra di questa soglia verranno esclusi dal calcolo, aiutando a rimuovere outlier o picchi anomali che potrebbero distorcere l’analisi.
Lunghezza
Definisce il periodo temporale o il numero di barre su cui viene calcolato lo sprint di volume/delta. Il valore predefinito è 10. Questo parametro determina quanto indietro l’indicatore guarda per accumulare i valori di volume o delta. Lunghezze più brevi forniscono valori dello sprint più reattivi e in tempo reale, mentre lunghezze più lunghe smussano i dati e mostrano pattern di accumulo più ampi.
Modalità colore Delta
Determina come le barre dell’istogramma vengono colorate in base ai valori di delta. Le opzioni disponibili sono:
Sfumatura: I colori sfumano gradualmente o transitano in base all’intensità dei valori di delta, offrendo un gradiente visivo che mostra l’intensità della pressione d’acquisto o di vendita.
Fisso: Utilizza colori fissi per i valori di delta positivi e negativi senza transizioni graduali, offrendo una chiara distinzione binaria tra pressione d’acquisto e di vendita.
Impostazioni di smussamento

Abilita
Quando è abilitato, applica lo smussamento ai dati dello sprint volume/delta per ridurre il rumore e rendere i trend più evidenti. Lo smussamento aiuta a filtrare le fluttuazioni di breve periodo e fornisce un quadro più chiaro dei pattern sottostanti di accumulo del volume.
Tipo di media
Definisce il tipo di media mobile utilizzato per lo smussamento. Le opzioni disponibili sono:
Simple: Media mobile semplice (SMA), che assegna lo stesso peso a tutti i valori nel periodo.
Esponenziale: Media mobile esponenziale (EMA), che assegna un peso maggiore ai valori più recenti per una risposta più rapida ai cambiamenti.
Triangolare: Media mobile triangolare, che applica un doppio smussamento per risultati ancora più fluidi.
Ponderata: Media mobile ponderata (WMA), che assegna progressivamente più peso ai valori più recenti.
Lunghezza
Imposta la lunghezza del periodo per il calcolo dello smussamento. Questo determina quante barre vengono incluse nel calcolo della media mobile. Valori più alti creano linee più fluide e meno sensibili ai cambiamenti recenti, mentre valori più bassi mantengono una maggiore reattività ai dati attuali.
Subgrafici
Colore
Imposta il colore principale per le barre dell’istogramma quando i valori di delta sono positivi o quando si utilizza lo schema di colori principale. Questo rappresenta la pressione d’acquisto o l’accumulo positivo di volume.
2° Colore
Imposta il colore secondario per le barre dell’istogramma quando i valori di delta sono negativi. Questo rappresenta la pressione di vendita o l’accumulo negativo di volume.
Stile subgrafico
Definisce come vengono visualizzati i dati dello sprint volume/delta. Il valore predefinito è "Bars", che mostra i dati come un istogramma con barre verticali, rendendo facile confrontare l’accumulo di volume tra diversi periodi di tempo.
Colore automatico
Determina la logica di colorazione automatica delle barre dell’istogramma. Impostato su "+/-" per colorare automaticamente le barre in base al fatto che i valori siano positivi o negativi, fornendo un feedback visivo immediato sulla pressione d’acquisto rispetto a quella di vendita.
Stile linea
Imposta lo stile delle barre dell’istogramma. Il valore predefinito è "Solid" per barre piene, che mostra chiaramente l’entità del volume per ciascun periodo.
Larghezza linea
Regola la larghezza delle barre dell’istogramma. Il valore predefinito è 3. Barre più larghe rendono i dati di volume più evidenti e facili da leggere, mentre barre più sottili consentono una visualizzazione più compatta quando si analizzano più periodi di tempo.
Nome breve
Consente di impostare un nome breve o un’etichetta personalizzata per l’indicatore che apparirà nella legenda del grafico. È utile per distinguere tra più indicatori di volume o quando si utilizza lo stesso indicatore con parametri diversi.