

Delta tells you how fast an option moves. Gamma tells you how fast that answer changes — and once you see how the biggest players in the market are forced to react to it, you'll understand why some sessions feel glued to a level and others feel like they're running away from everyone. Episode 3 of our Greeks series.

Speed was only half the story
In Episode 2 we built delta: the option's speed, its rough odds, its real exposure. We also left a warning on the table — delta is a snapshot, not a setting. This episode is about the force that moves it.
Gamma measures how much delta changes when the underlying moves one point. If delta is your speedometer, gamma is your foot on the accelerator. A call with delta 0.50 and some gamma doesn't stay a 0.50-delta call: the index rallies and it's suddenly a 0.55, then a 0.60. The option is getting longer as the market rises — its exposure is growing exactly when the trade is working.
Geometrically, gamma is the curvature of the option's value curve. Delta was the slope of that curve; gamma is how quickly the slope steepens. Flat curve, no gamma. Bent curve, gamma. (That bend has a more general name — convexity — and it deserves its own episode. It's coming.)
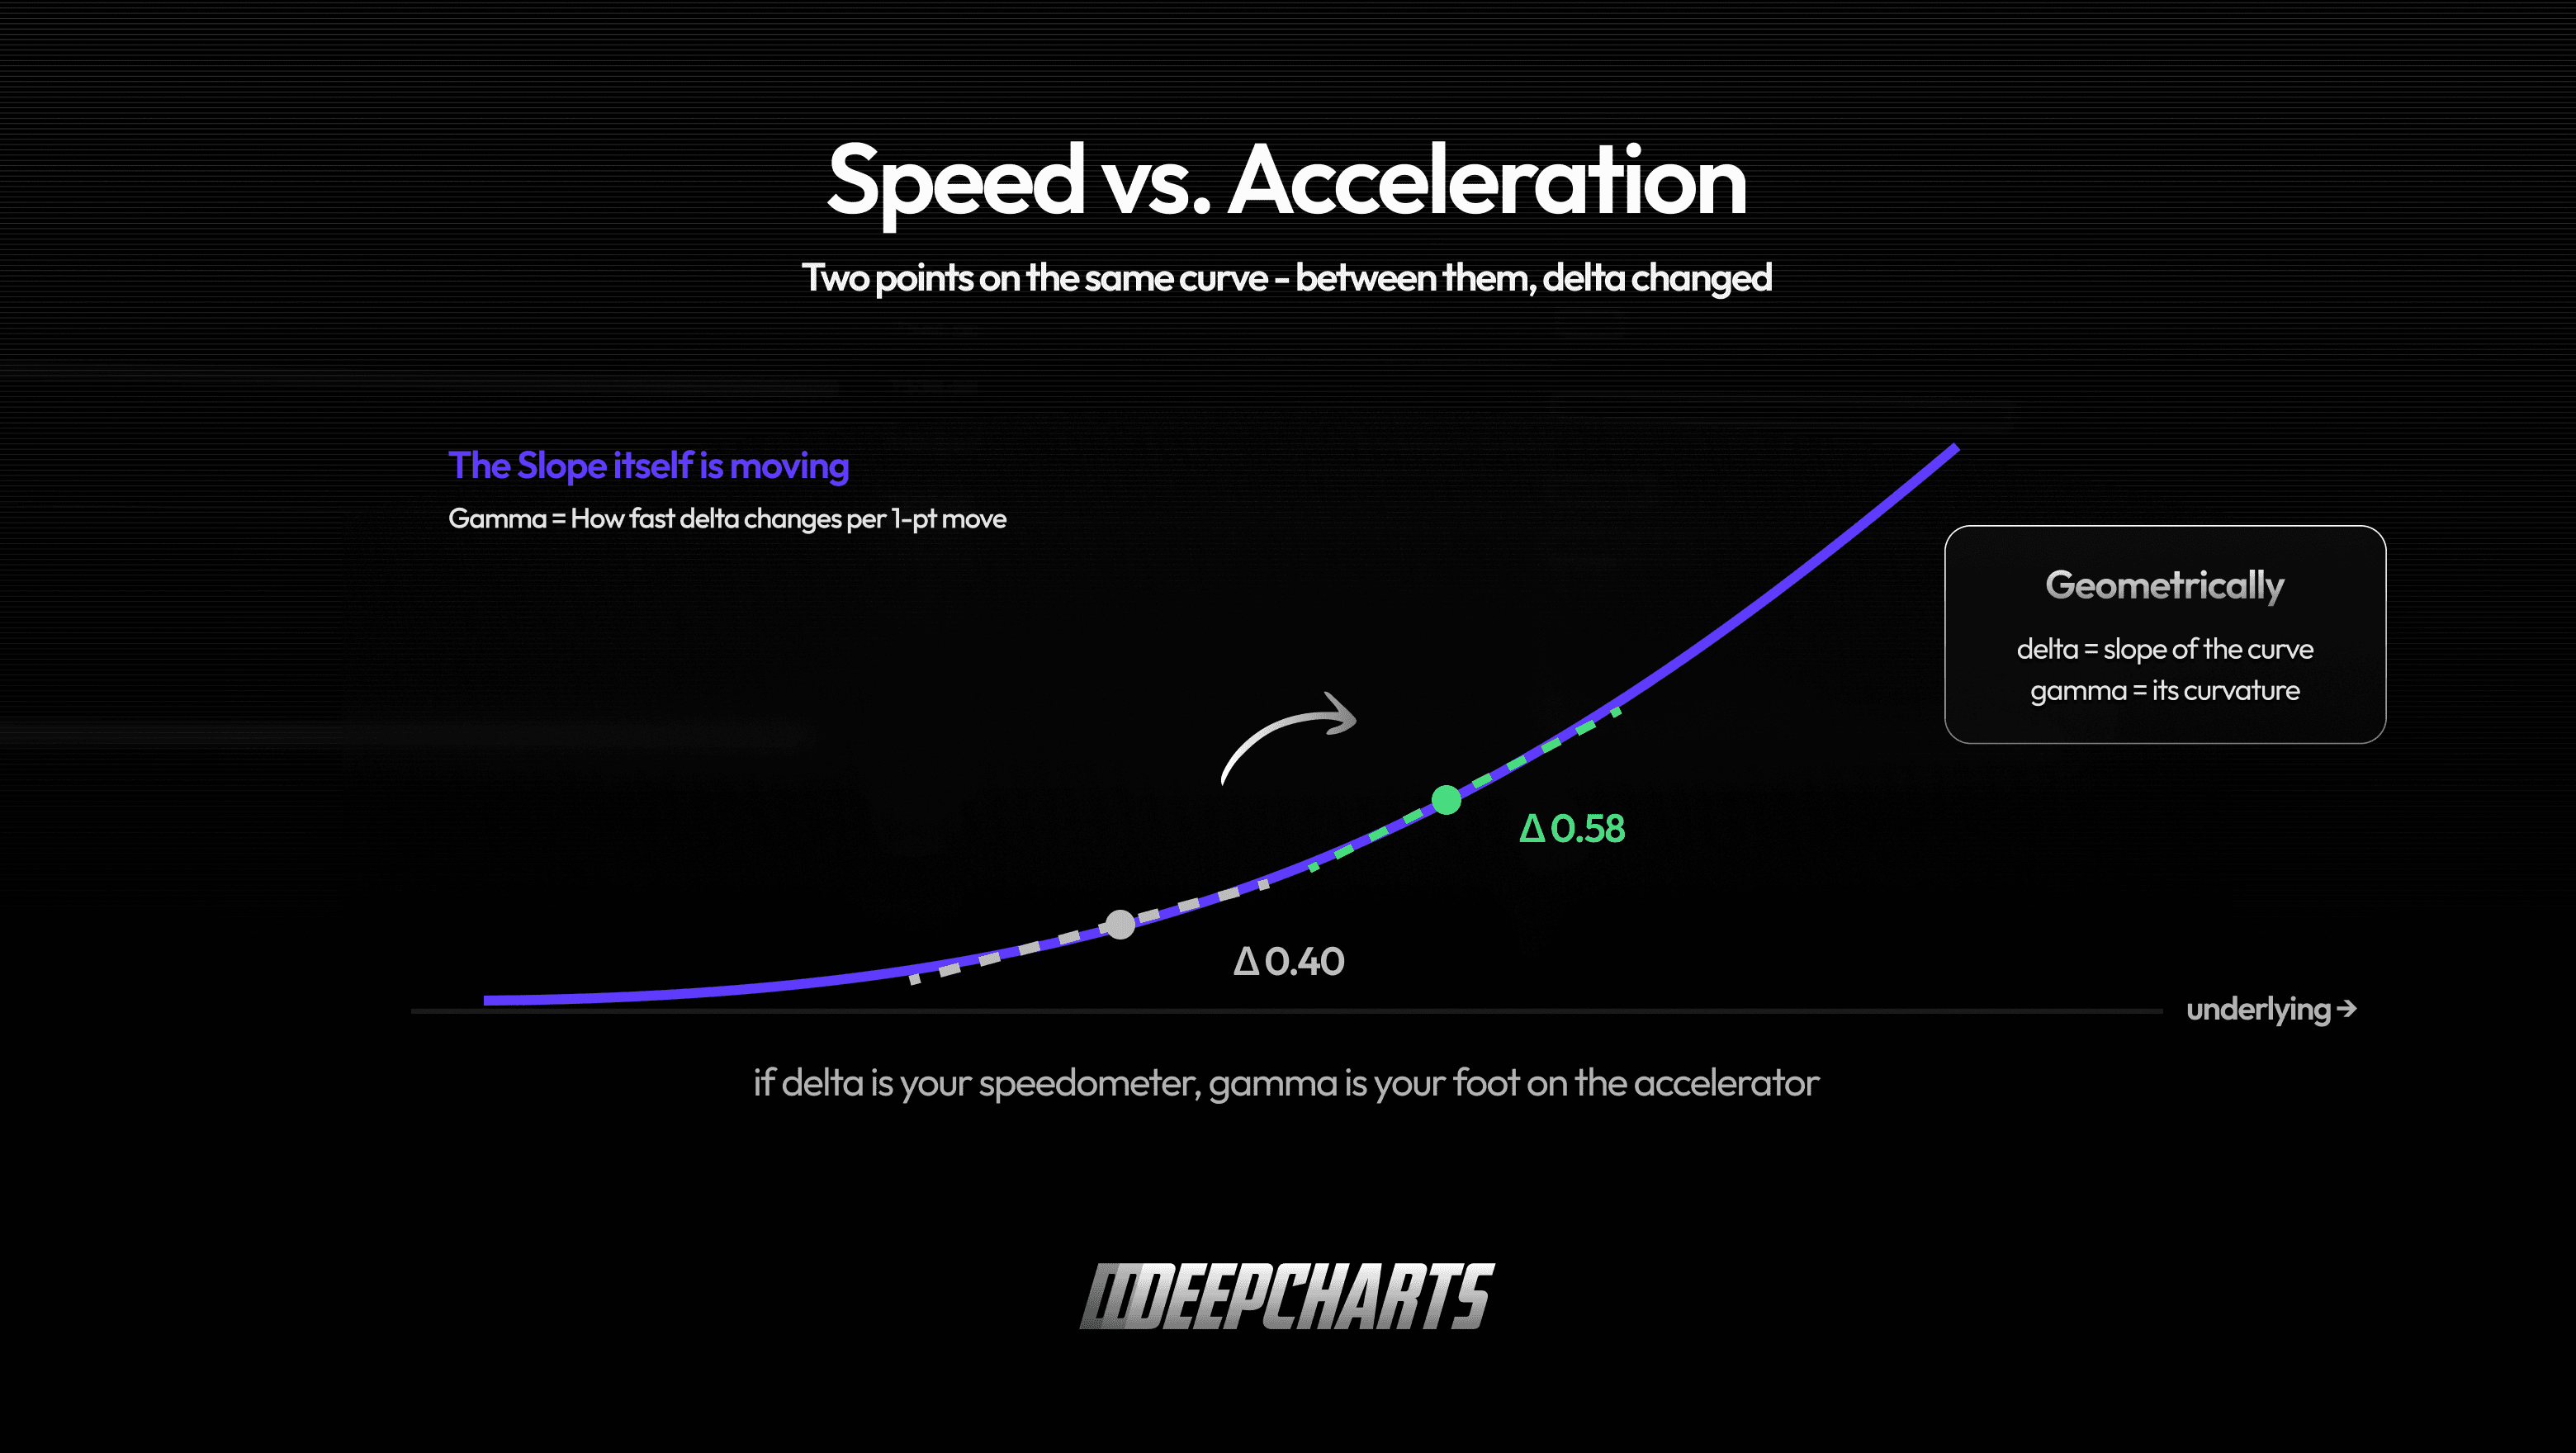
Figure 1 · Speed vs. acceleration
The arithmetic, in one worked example
Numbers make it concrete. A dealer has sold 500 calls, strike 6,000, delta 0.50, and hedged by buying 25,000 index units' worth of futures (500 × 100 × 0.50). Book neutral, everyone's happy.
The index rallies 20 points. With a gamma of about 0.004 per point, delta climbs from 0.50 to roughly 0.58. The short call position is now short 29,000 units — but the hedge is still 25,000. The dealer is suddenly 4,000 units short, through no decision of its own. That's gamma: the hedge didn't break, the target moved.
To get neutral again the dealer must buy the difference — roughly 80 ES contracts. If the index keeps rallying, more. If it reverses, the dealer finds itself over-hedged and must sell some back. Gamma is the reason hedging is a verb, not an event.

Figure 2 · The moving target
Where gamma lives
Gamma is not spread evenly across the board. Two rules locate it.
It peaks at the money. Deep in-the-money options already behave like the underlying (delta ≈ 1, nothing left to change); deep out-of-the-money options barely react (delta ≈ 0, nothing changing yet). The uncertainty — and therefore the gamma — concentrates around the strike, where the option's fate is genuinely undecided.
It explodes as expiration approaches. With a month left, a 20-point move barely revises the odds. With an hour left, the same move can take an at-the-money option from coin-flip to near-certainty — delta swinging from 0.50 toward 1 in minutes. That's maximum gamma. It's why a 0DTE option sitting on the right strike is, in a real sense, pure gamma: enormous, and gone by the close.
Put the two rules together and you can picture the whole board: a bell of gamma centered on the current price, growing taller and narrower as expiration approaches.
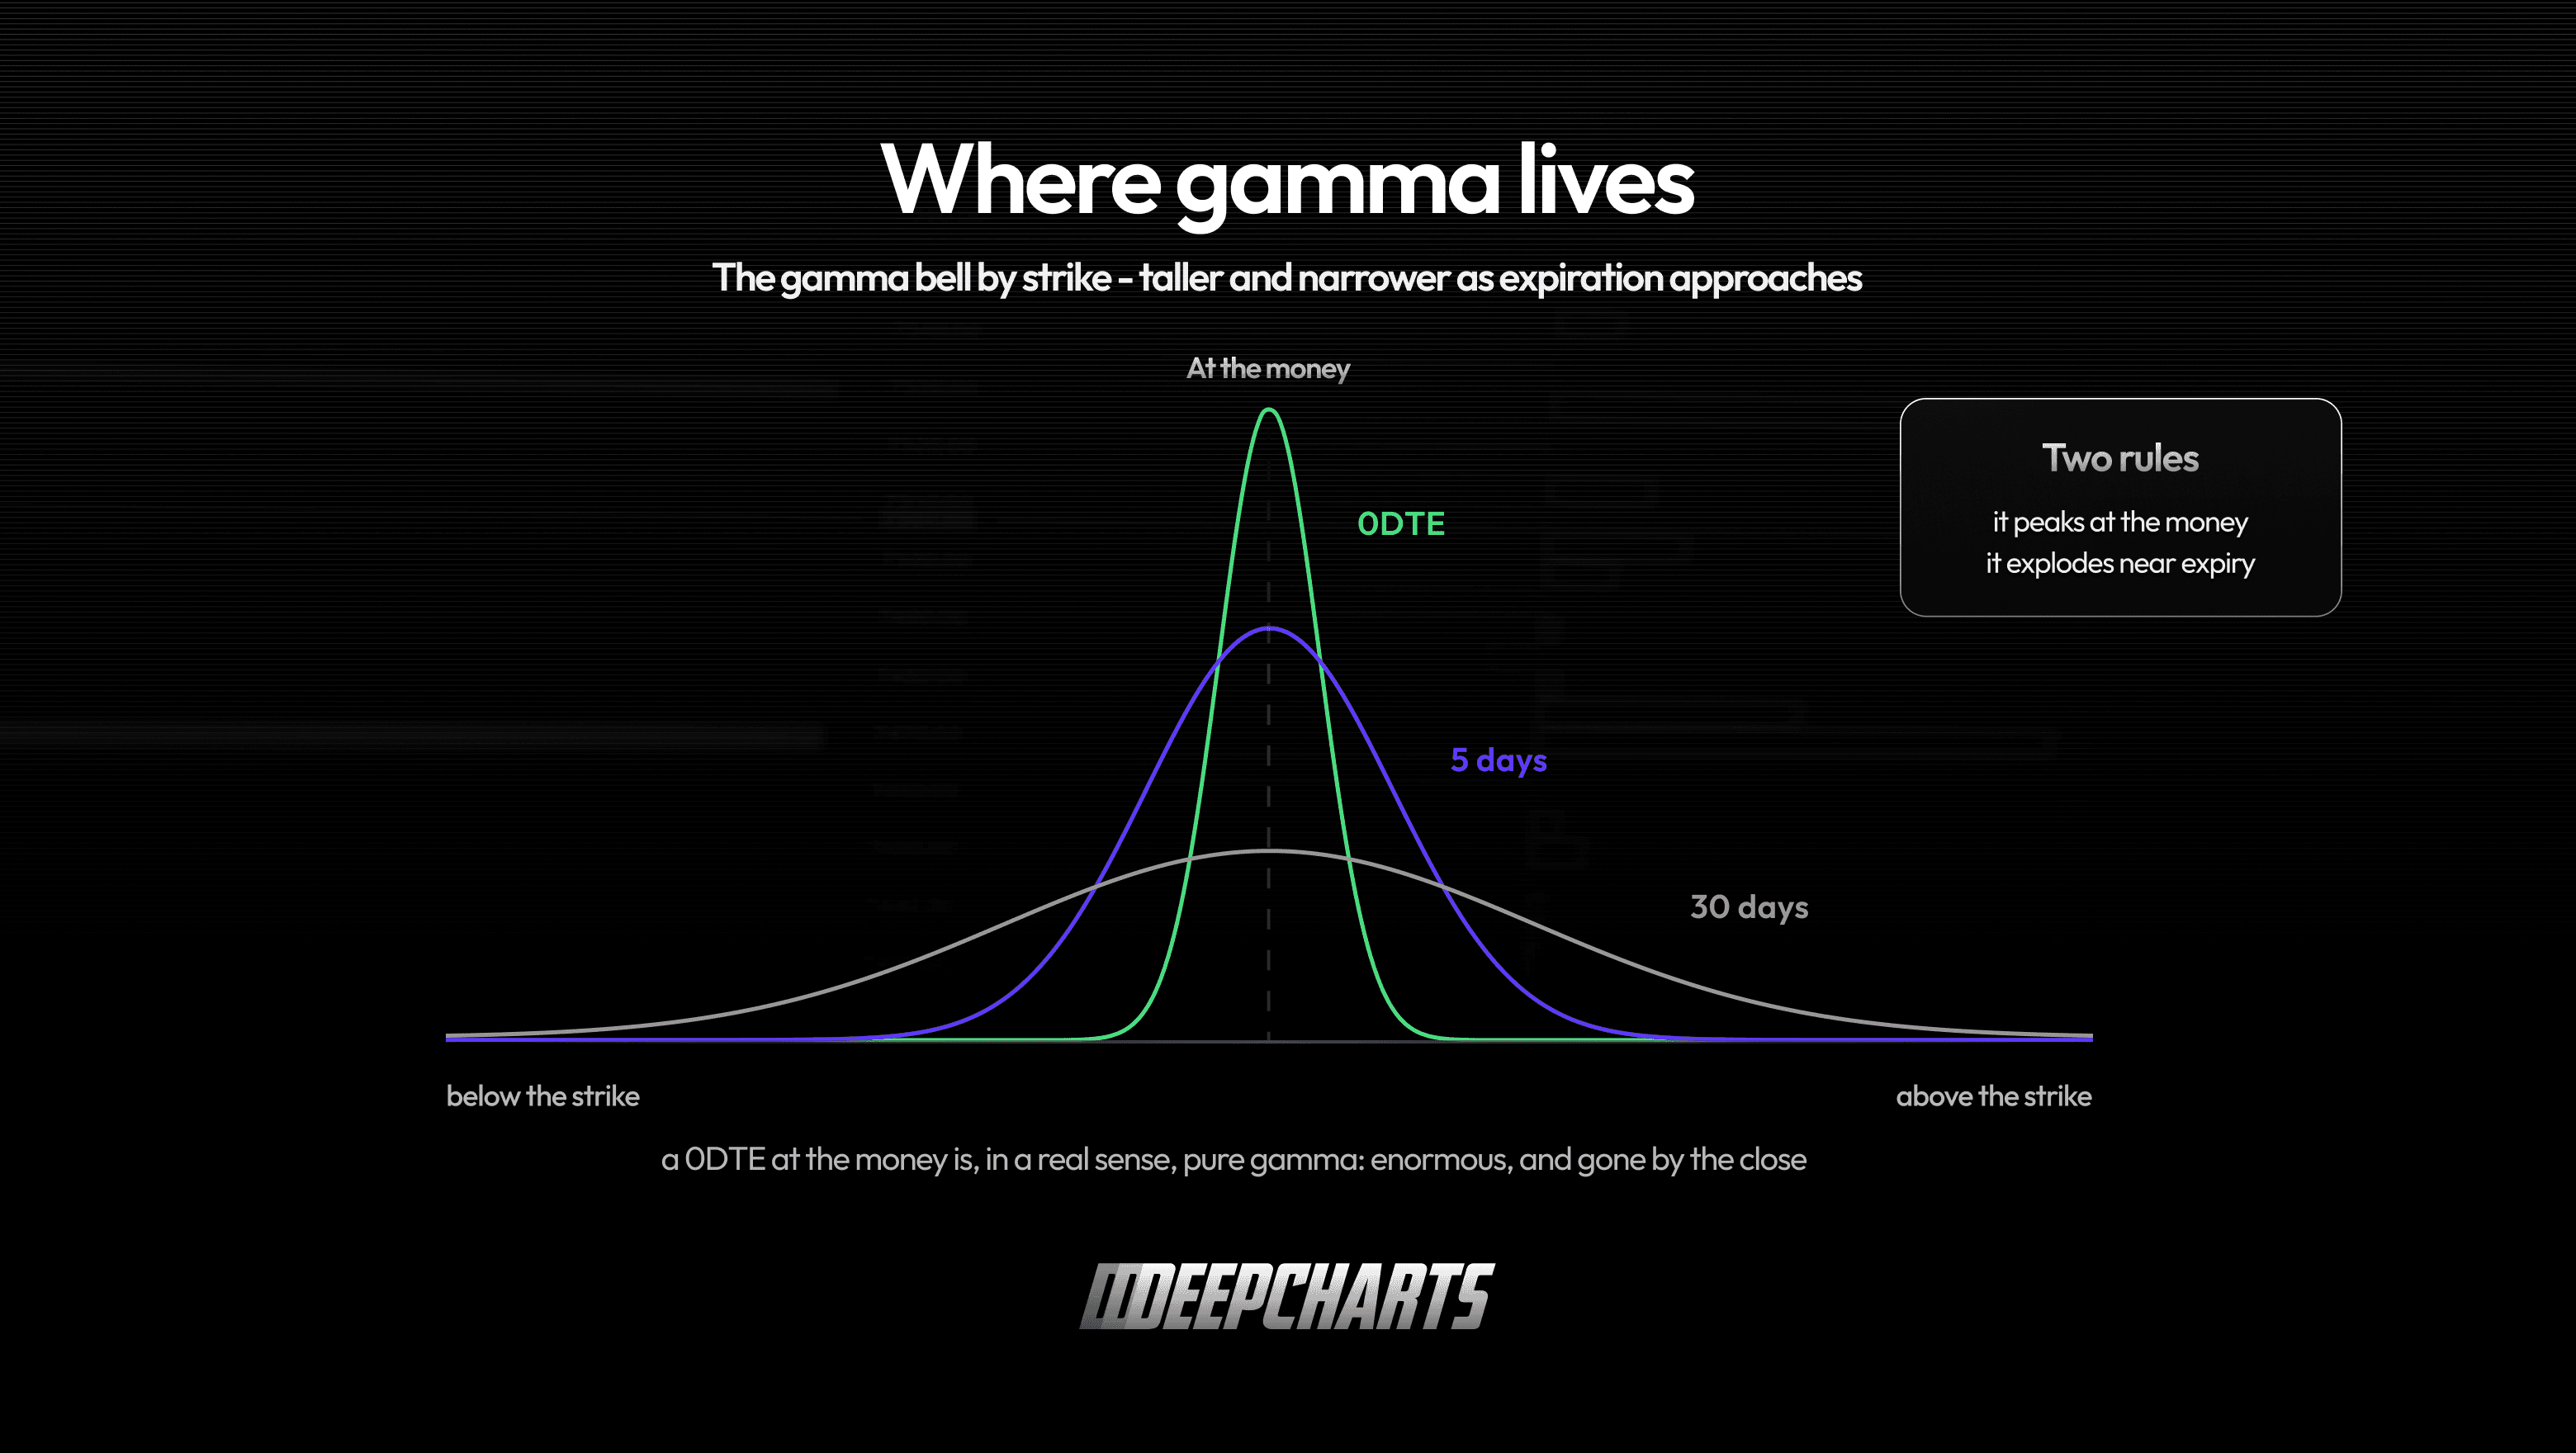
Figure 3 · Where gamma lives
Here's a connection worth keeping from last episode: remember the delta S-curve — near 0 far out-of-the-money, 0.50 at the strike, near 1 deep in? Gamma is the steepness of that curve. Far from expiry the S is lazy and shallow; near expiry it turns into a step function. Same picture, one derivative apart.
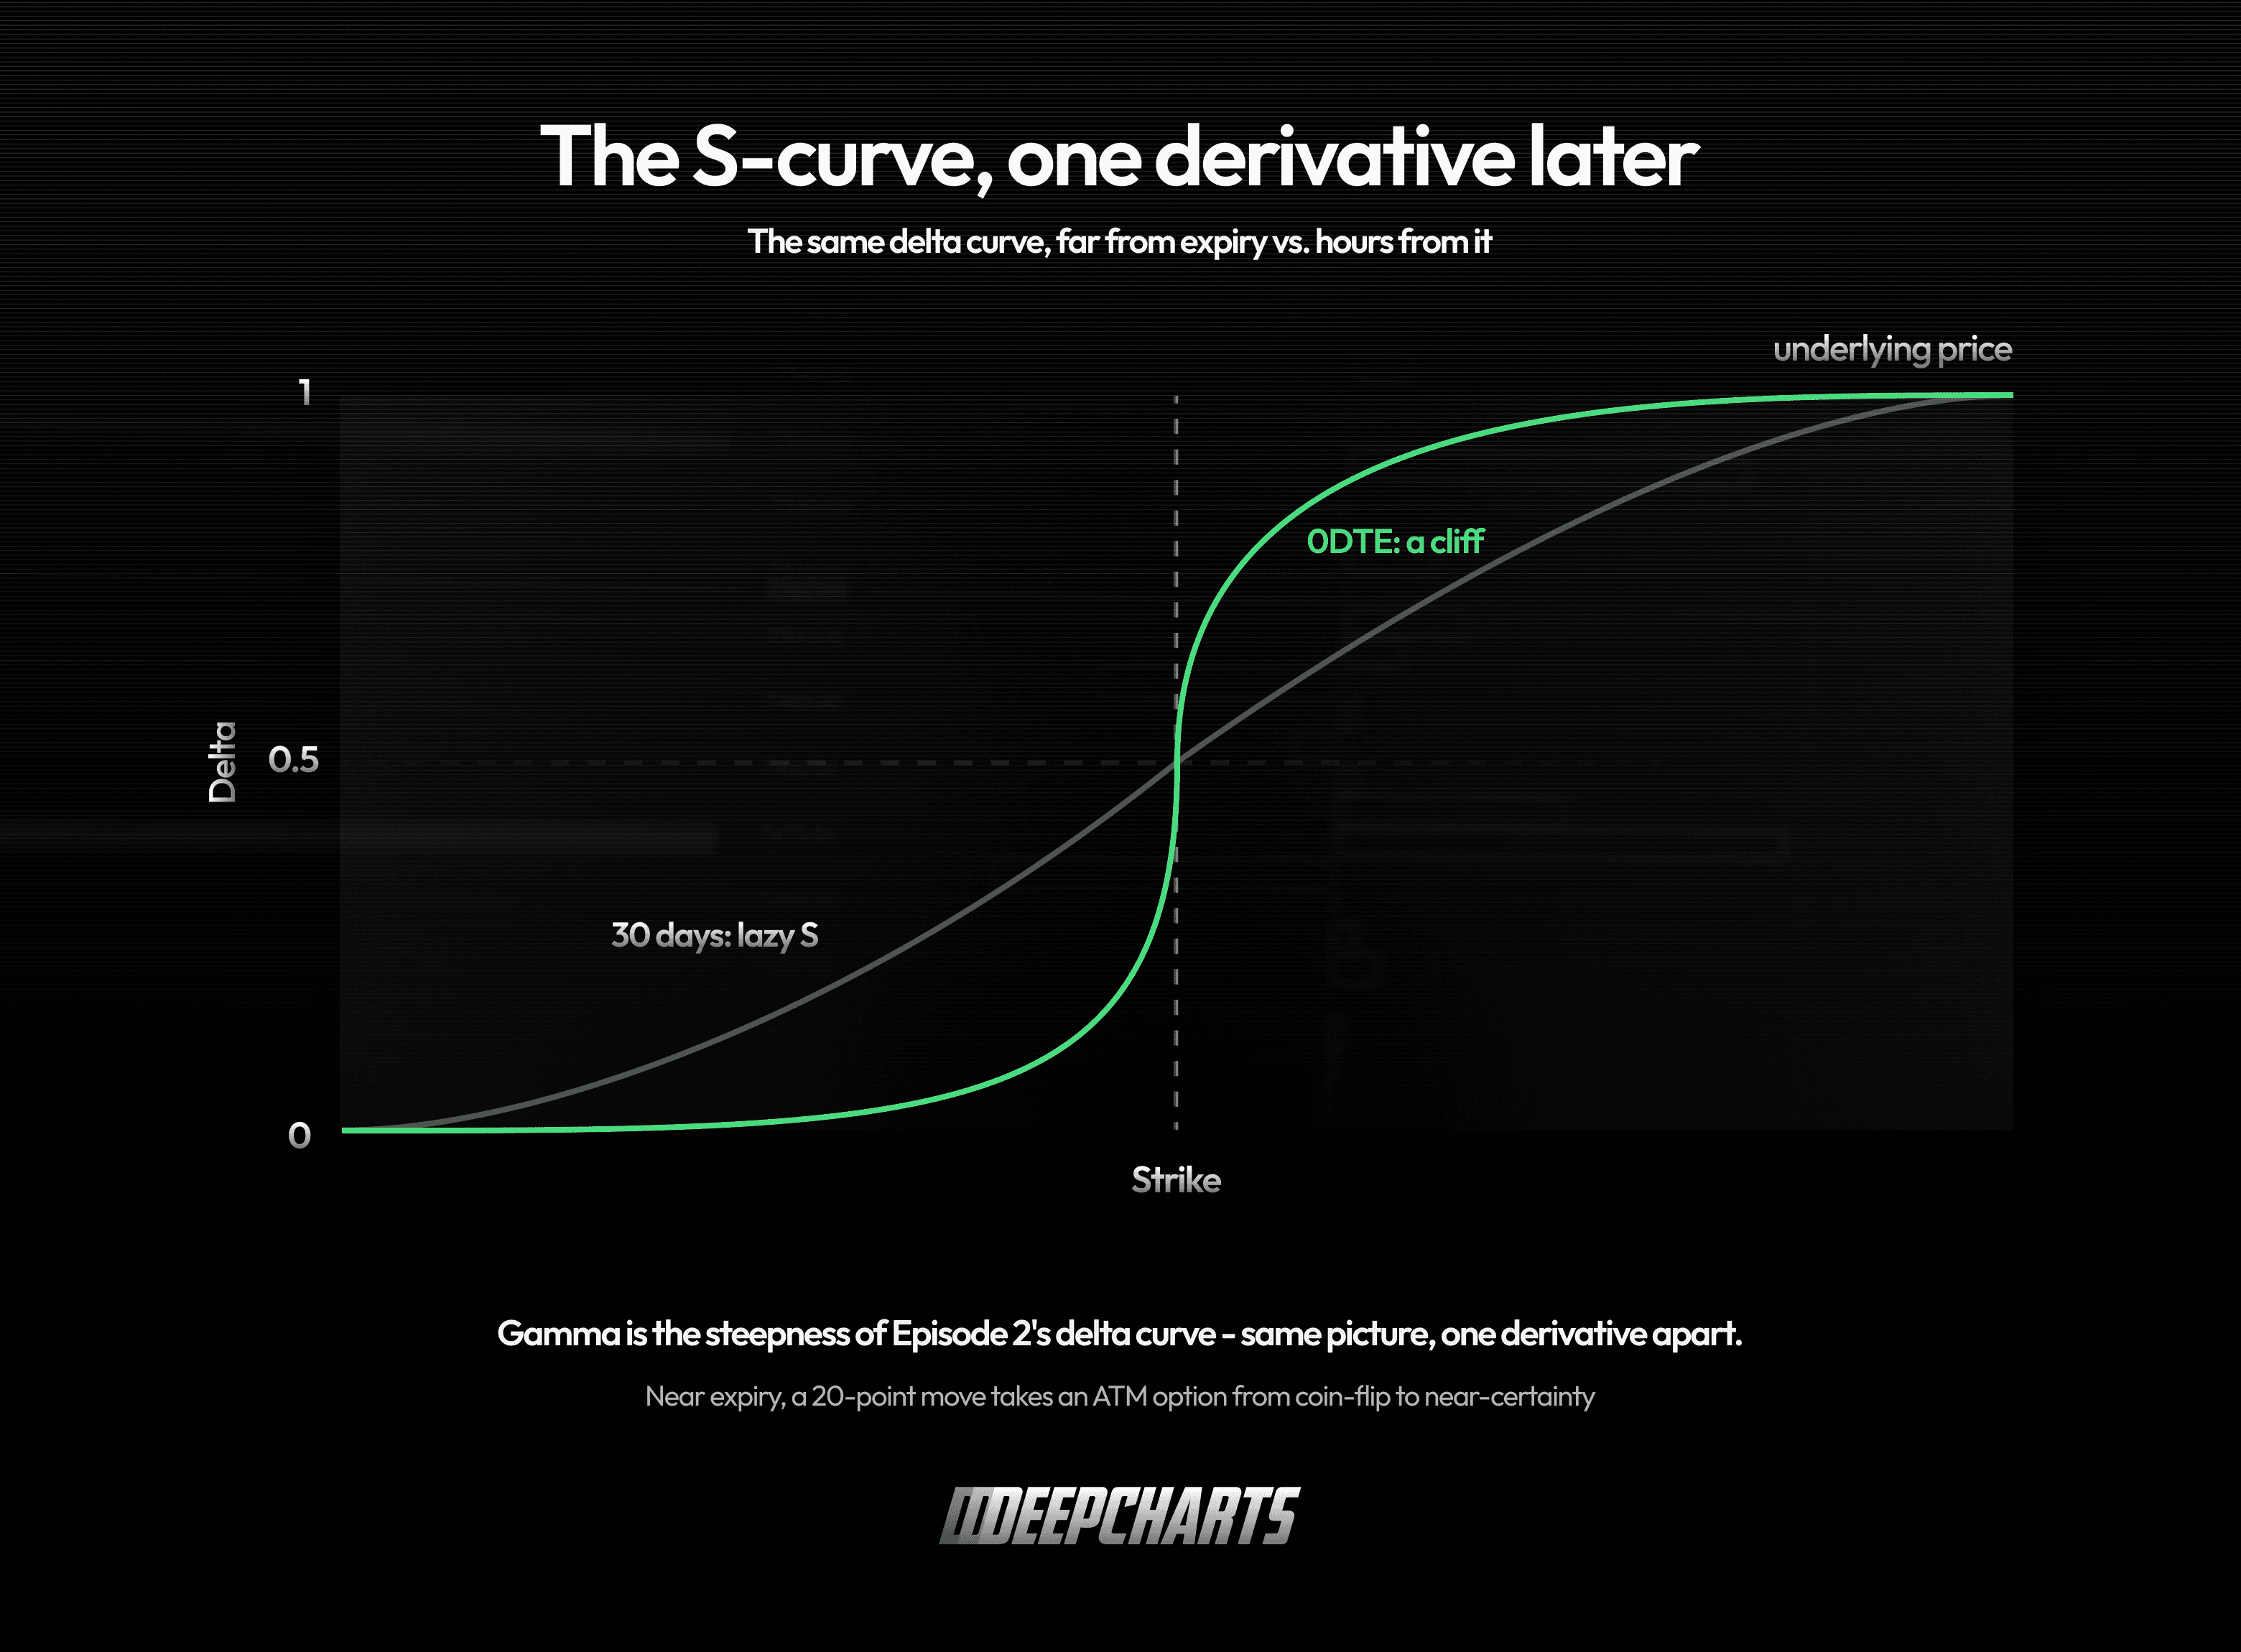
Figure 4 · The S-curve, one derivative later
Long gamma, short gamma: the two seats
Every option position puts you in one of two seats, and the ride is completely different.
Long gamma (you own options): your exposure grows when the market goes your way and shrinks when it doesn't. Rallies make you longer, sell-offs make you shorter — automatically, with no decision required. It's a comfortable seat. The catch: you pay for it, every day, through theta — the rent from Episode 1, and the star of the next one.
Short gamma (you've sold options): the mirror image. The market rallies and you're getting shorter into strength; it breaks and you're getting longer into weakness. Your exposure grows exactly when it hurts. Sellers accept this seat because they collect the rent — but the seat has to be managed, constantly.
Now scale that second seat up. The dealers who carry the other side of the world's option flow are structurally in one seat or the other, in enormous size, and they refuse directional risk — so they re-hedge, mechanically, as delta moves. Which seat they're in decides the direction of that re-hedging:
Dealers long gamma: their delta grows too long on rallies (they sell futures into strength) and too short on dips (they buy weakness). A counter-current flow. Moves tend to get dampened, breakouts tend to struggle — the market can feel like it's wearing a seatbelt.
Dealers short gamma: the exact opposite. Rallies force them to buy strength, breaks force them to sell weakness. A pro-cyclical flow that pours fuel on whatever is already happening. Moves tend to extend, sell-offs tend to accelerate.
Same arithmetic, opposite market character. No conspiracy required — just thousands of hedges pointing the same way. And note the honest verbs: tend to. These are structural pressures to verify on the tape, not laws of physics.
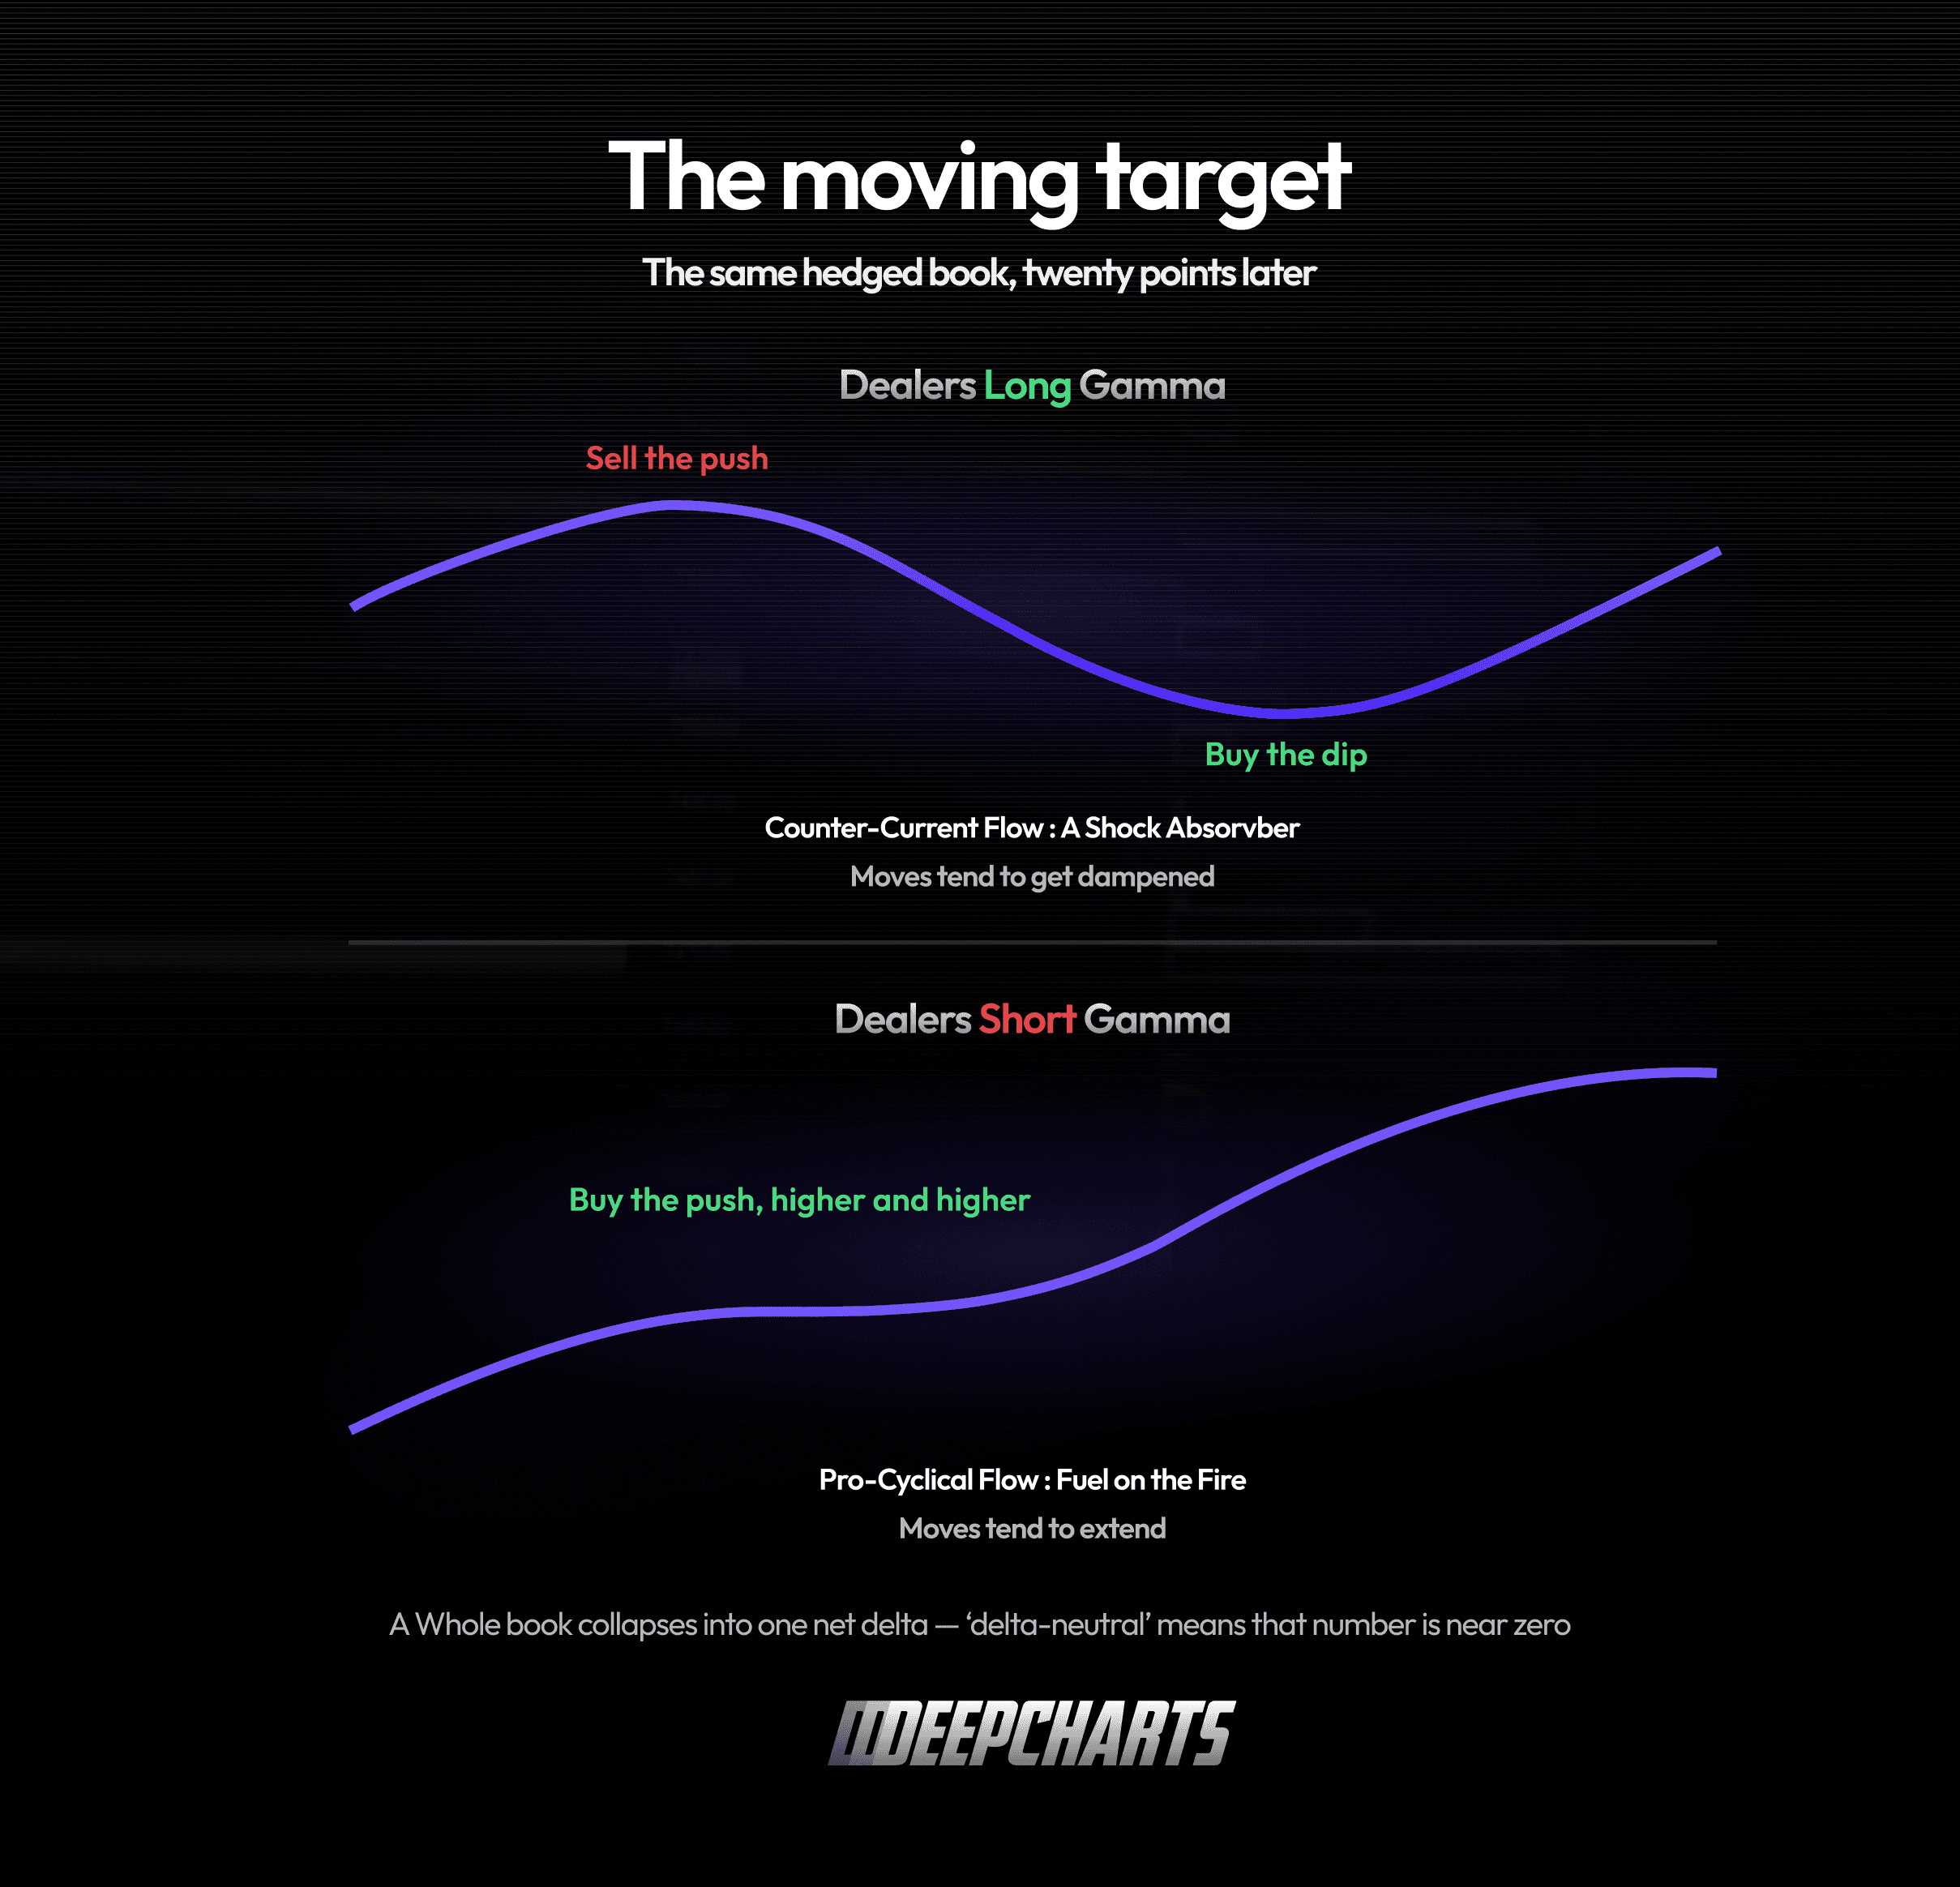
Figure 5 · The two seats
So what's a "gamma squeeze", then?
You've heard the phrase. Here's the mechanism, minus the mythology.
Suppose aggressive, concentrated call buying hits short-dated strikes just above the price. Dealers sell those calls — now they're short gamma at those strikes. Price rises toward the strikes: the calls' delta climbs, and the dealers, hedging, must buy the underlying as it rises. That buying pushes price further, which raises delta further, which forces more buying. A feedback loop.
That's a gamma squeeze: hedging pressure amplifying the very move that triggers it. The famous 2021 meme-stock episodes made the phrase mainstream, and the loop is real — but it needs fuel: concentrated strikes, short expirations, one-directional flow, and a market thin enough to move. It's a description of a rare alignment, not a strategy on demand. Most days, gamma doesn't squeeze anything; it just quietly sets the market's character.
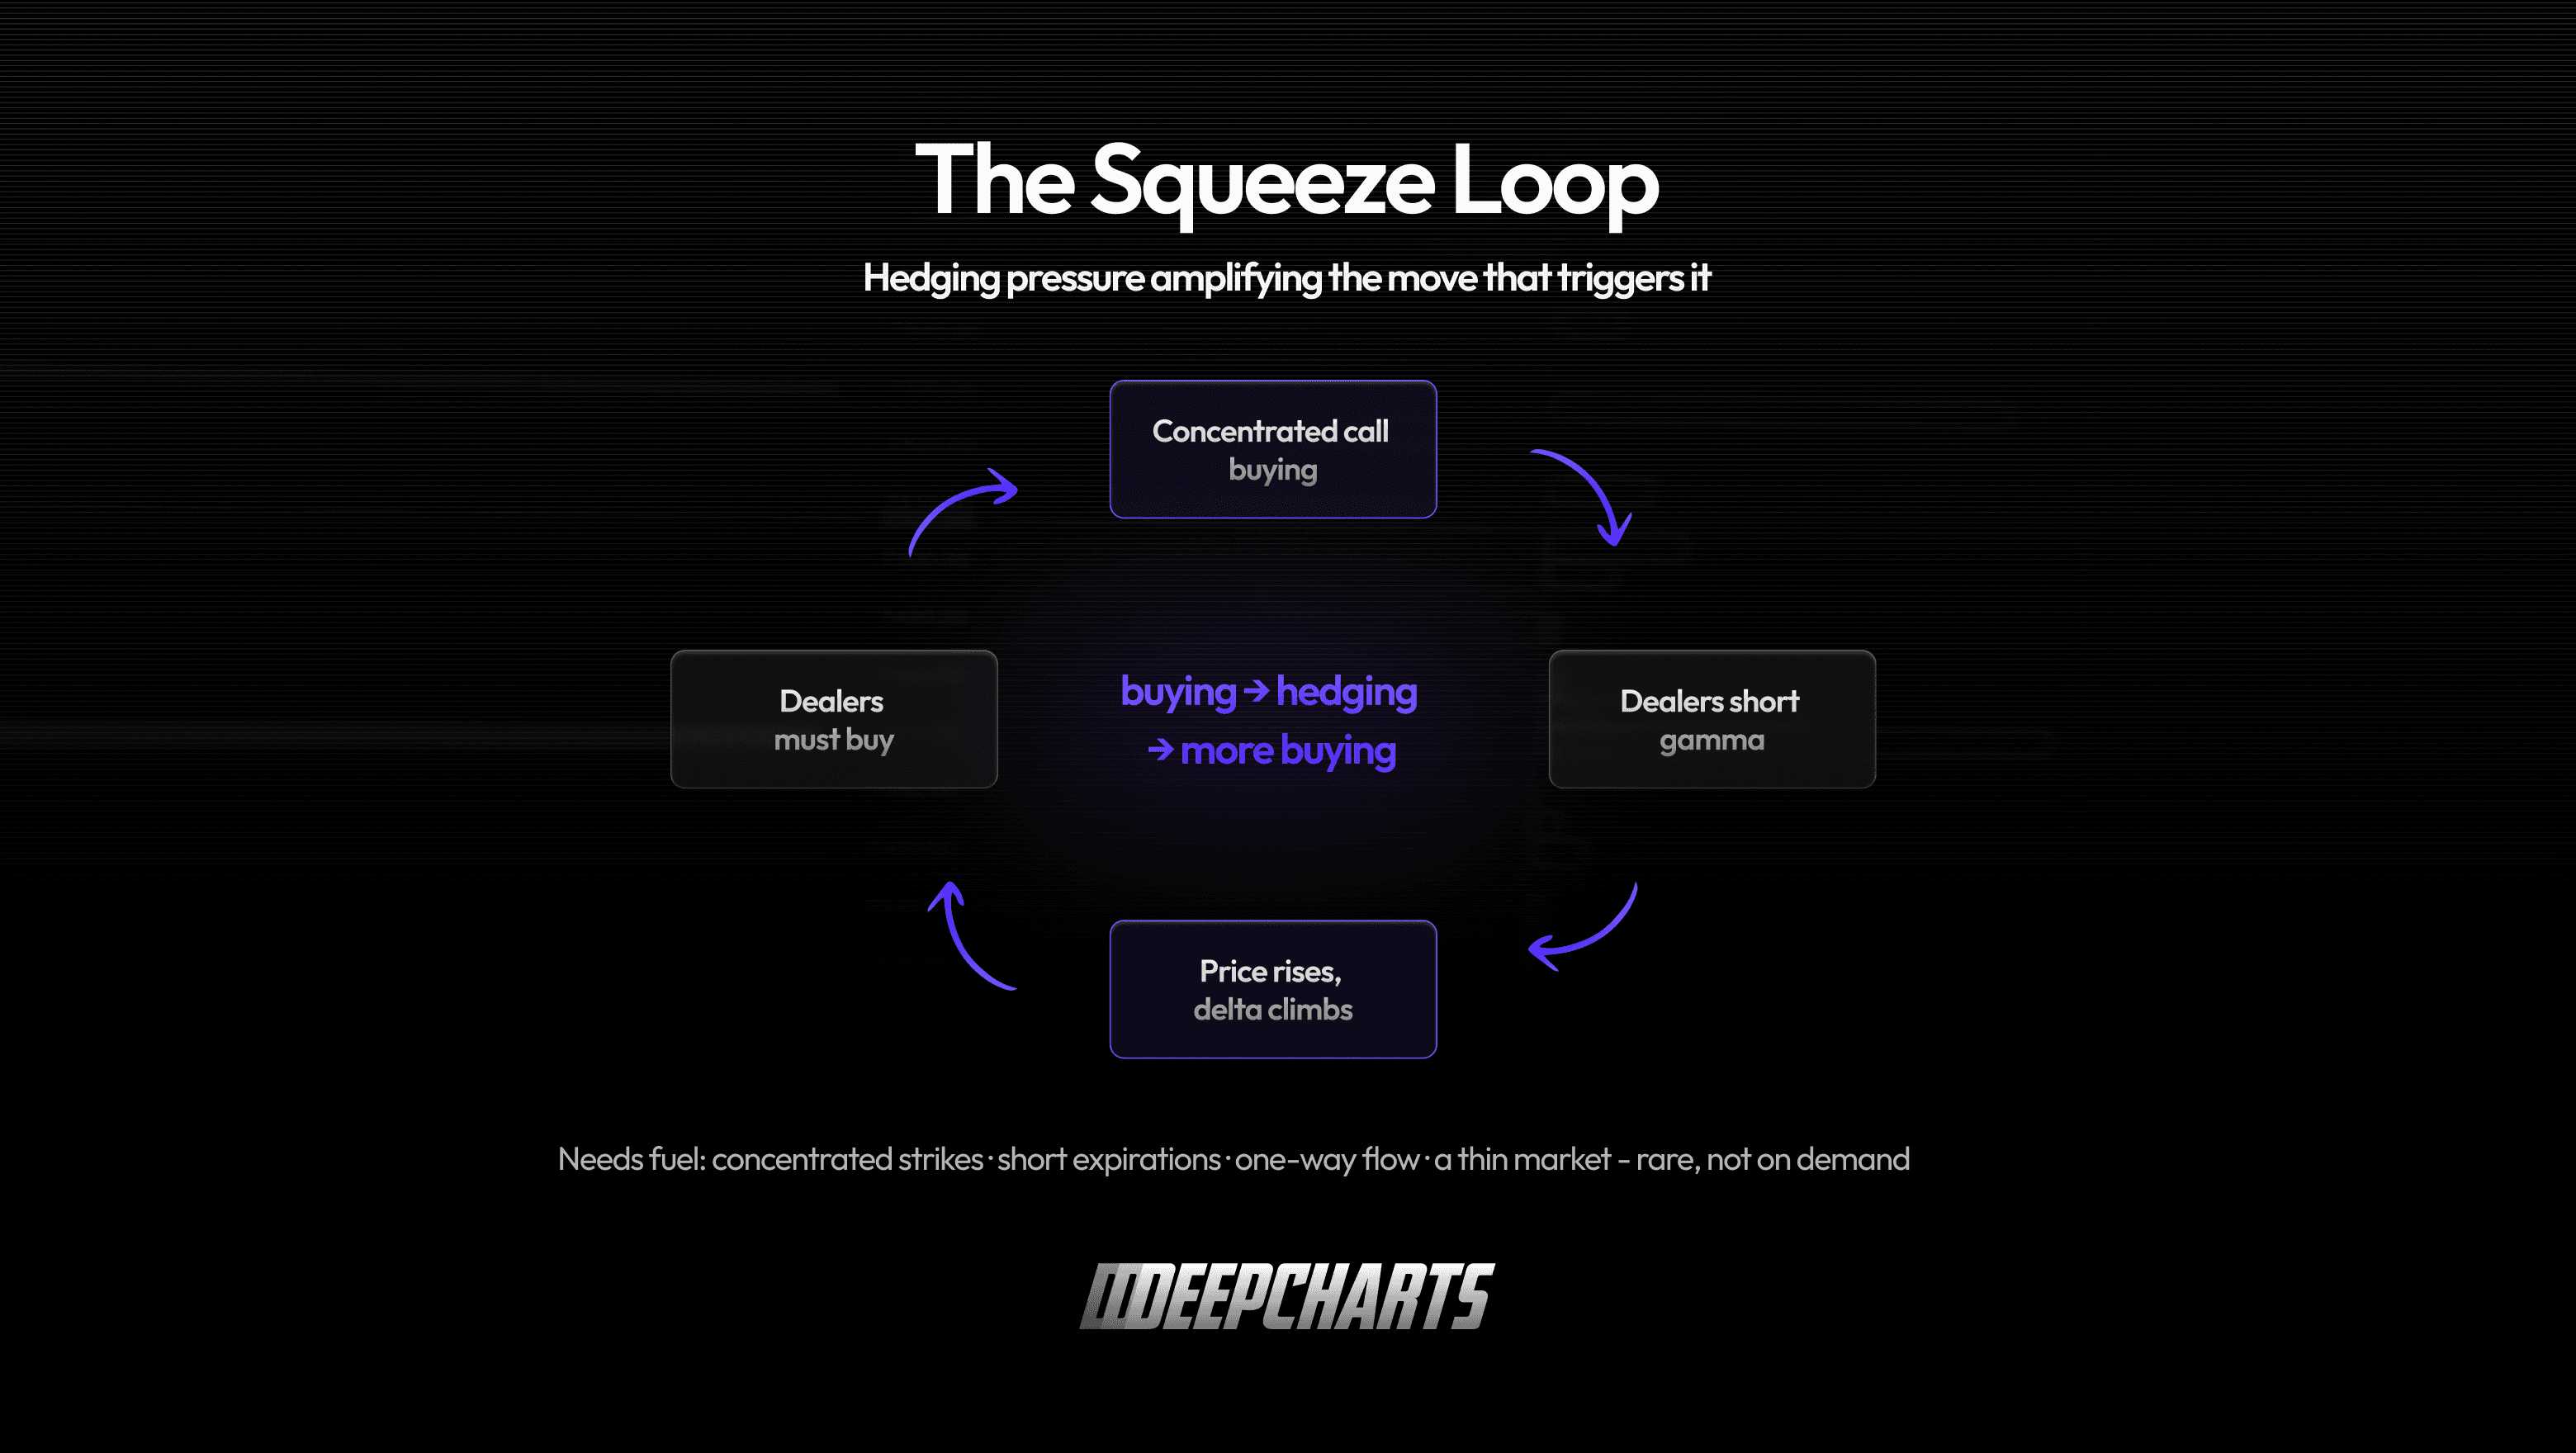
Figure 6 · The squeeze loop
Why futures traders care
Everything above lands in one place: the futures tape.
Gamma decides the size and direction of the re-hedging that option books require as price moves. When aggregate dealer books are long gamma, there's a standing tendency for mechanical flow to lean against moves; when they're short, to lean with them. Sessions where every breakout dies and sessions where every pullback evaporates often aren't different moods — they're different gamma.
For a futures trader this is context, not a signal. It suggests which kind of session you might be in, where forced flow should concentrate if it shows up, and which failures are worth respecting. Then the tape gets the last word: tendencies are there to be verified, level by level, in the order flow you actually watch.
One Greek left to price all this convexity you've been admiring: the rent. Next episode, theta.
FAQ
What is gamma in options, in simple terms?
Gamma is how much an option's delta changes when the underlying moves one point. If delta is speed, gamma is acceleration. A 0.50-delta call with high gamma can be a 0.60-delta call twenty points later.
Why is gamma highest at the money and near expiration?
Because that's where the option's fate is most undecided. Deep in- or out-of-the-money, delta is already settled near 1 or 0; at the strike with little time left, small moves swing the odds — and delta — violently.
What do "long gamma" and "short gamma" mean?
Long gamma (owning options): your exposure automatically grows when the market moves your way. Short gamma (sold options): it grows against you, and the position must be actively managed. For hedgers, long gamma implies trading against the market's moves, short gamma implies trading with them.
What is a gamma squeeze?
A feedback loop where dealers short gamma from concentrated call buying are forced to buy the underlying as it rises, amplifying the rally that forces them to buy more. Real, but rare: it needs concentrated short-dated strikes, one-way flow and a market thin enough to move.
Does gamma affect futures markets?
Indirectly and mechanically: dealers hedge their option books with index futures, and gamma dictates how those hedges must be adjusted as price moves. Aggregate gamma positioning shapes whether mechanical flow tends to dampen or amplify moves on the futures tape.
Episode 4: theta — the rent everyone pays for the acceleration everyone wants.
Deepcharts Team
·
Share this on
