Indicadores profundos
Updated:
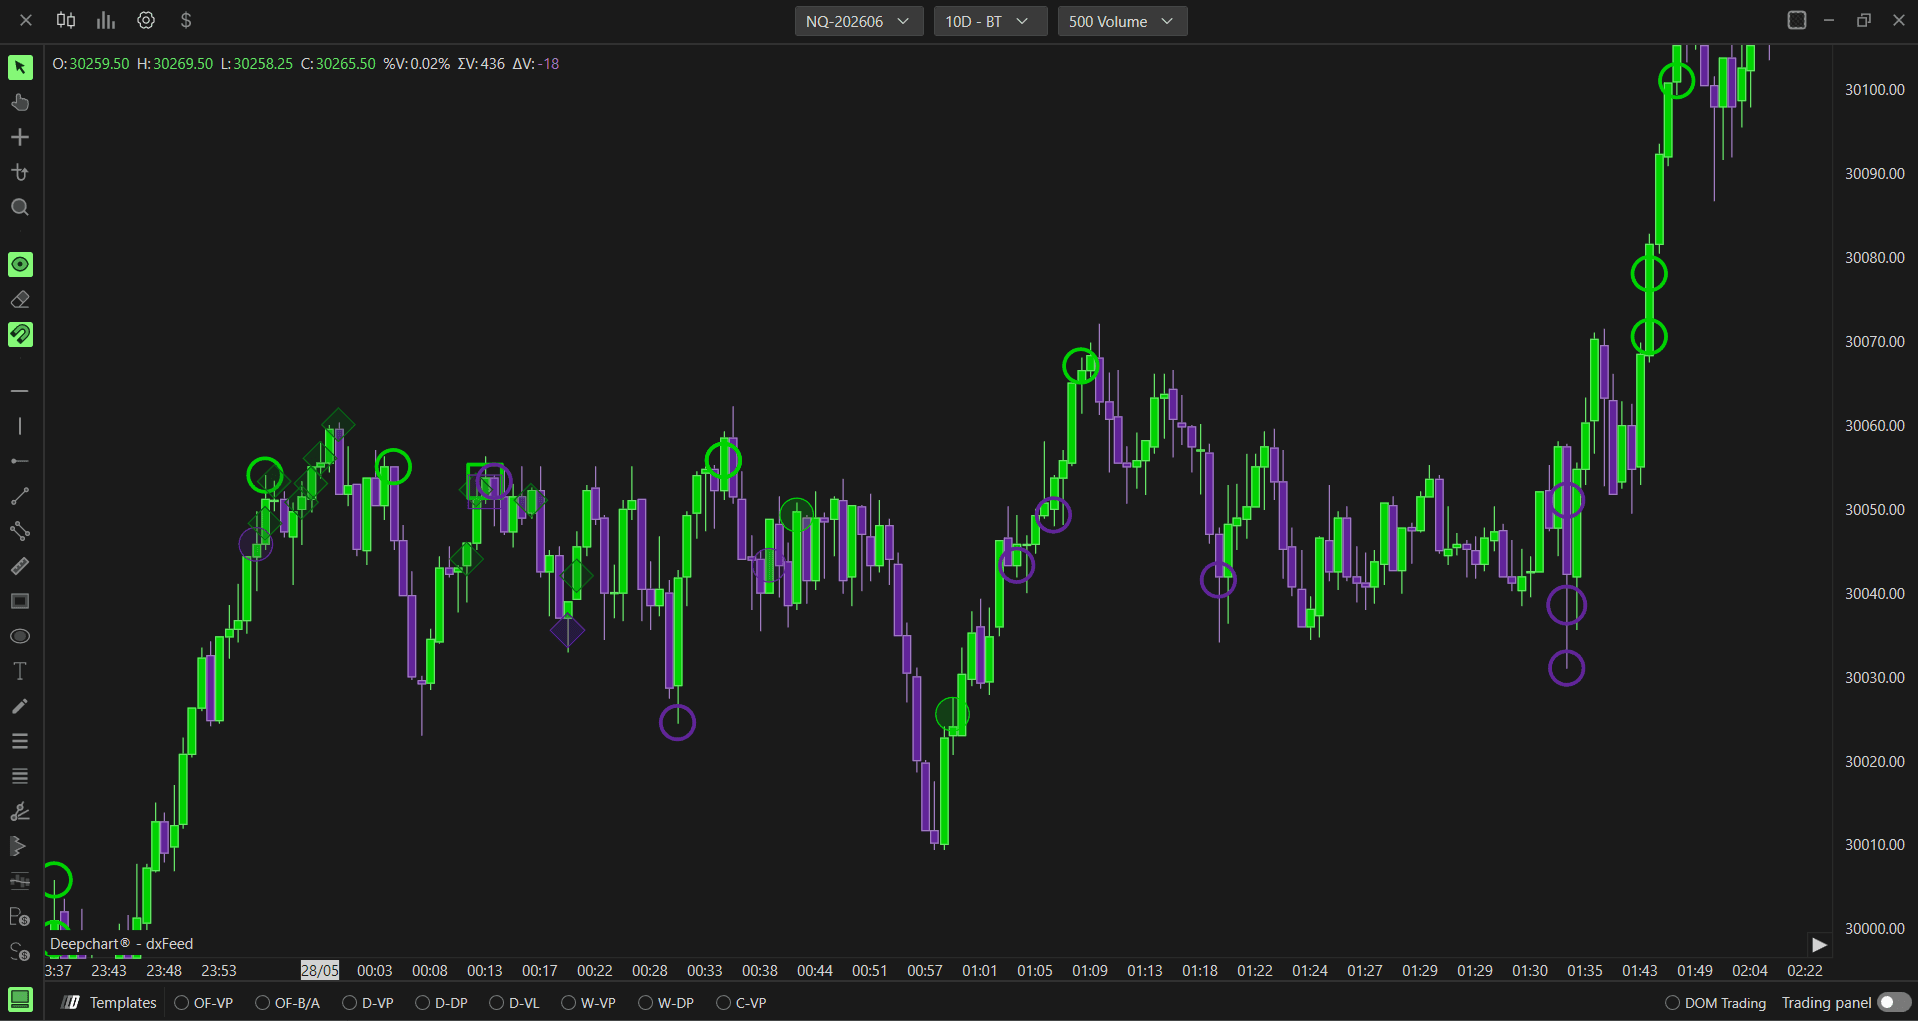
The Deep Trades indicator allows you to visualize large, aggressive market orders in real time. It highlights significant buy and sell activity directly on the chart - helping you identify institutional participation, high-impact price levels, and strong directional intent.
Note: Deep Trades requires a Level 2 data feed with MBO enabled. You also need to set the Source Type to MBO in Source Settings. For more details, refer to the Configuring MBO / MBP Data Source article.
If you want to use the previous version of this indicator, add the Big Trades indicator instead.
How Deep Trades Differs from Big Trades
The original Big Trades indicator was straightforward - it showed you where large aggressive orders were executed on the chart using bubbles, filtered by a minimum volume threshold. It answered one question: where did a big trade happen?
The new Deep Trades takes this further by answering a second, more important question: what was on the other side of that trade?
Here is what changed:
Big Trades shows bubbles wherever a large trade executed - regardless of what passive liquidity was sitting there
Deep Trades connects the aggressive order to the passive liquidity it interacted with - and uses four distinct markers (Square, Filled Circle, Hollow Circle, Diamond) to tell you exactly what kind of interaction took place
This means instead of just knowing a big trade happened here, you now know:
Was there a large passive order absorbing it?
Was it one large aggressive order or many small ones combined?
Did a large aggressive order directly clash with a large passive order?
Deep Trades also requires MBO data - which is what makes this level of detail possible. Big Trades works with standard data. Deep Trades goes deeper by using order-level information to match the two sides of each execution.
Why You Should Use Deep Trades
Most traders watch price and volume - but they only see what happened, not why. Deep Trades gives you the why.
Spot institutional activity more precisely - the Diamond marker specifically tells you when a large aggressive order met a large passive order. This is often where institutions are defending a level or accumulating a position
Understand trade quality - a Filled Circle tells you a big trade happened with significant size. A Diamond tells you it clashed directly with a large resting order. These are very different market situations
Avoid false signals - a large trade composed of many small quantities (Hollow Circle) is very different from one composed of large quantities (Filled Circle). Without Deep Trades, both would look the same on a standard volume chart
Better context at key levels - when price approaches a support or resistance level and you see Diamond markers appearing, it tells you large players are actively defending that level with passive orders - a much stronger signal than volume alone
In short - if you are serious about reading order flow, Deep Trades gives you a level of detail that Big Trades simply cannot provide.
What the Markers Mean
The Deep Trades indicator uses MBO (Market By Order) data to classify every large trade and identify exactly what it interacted with on the other side. This is why MBO data is required - without it, it is impossible to distinguish between different types of executions or know whether a large trade hit passive liquidity, was made up of small orders, or directly clashed with a resting order.
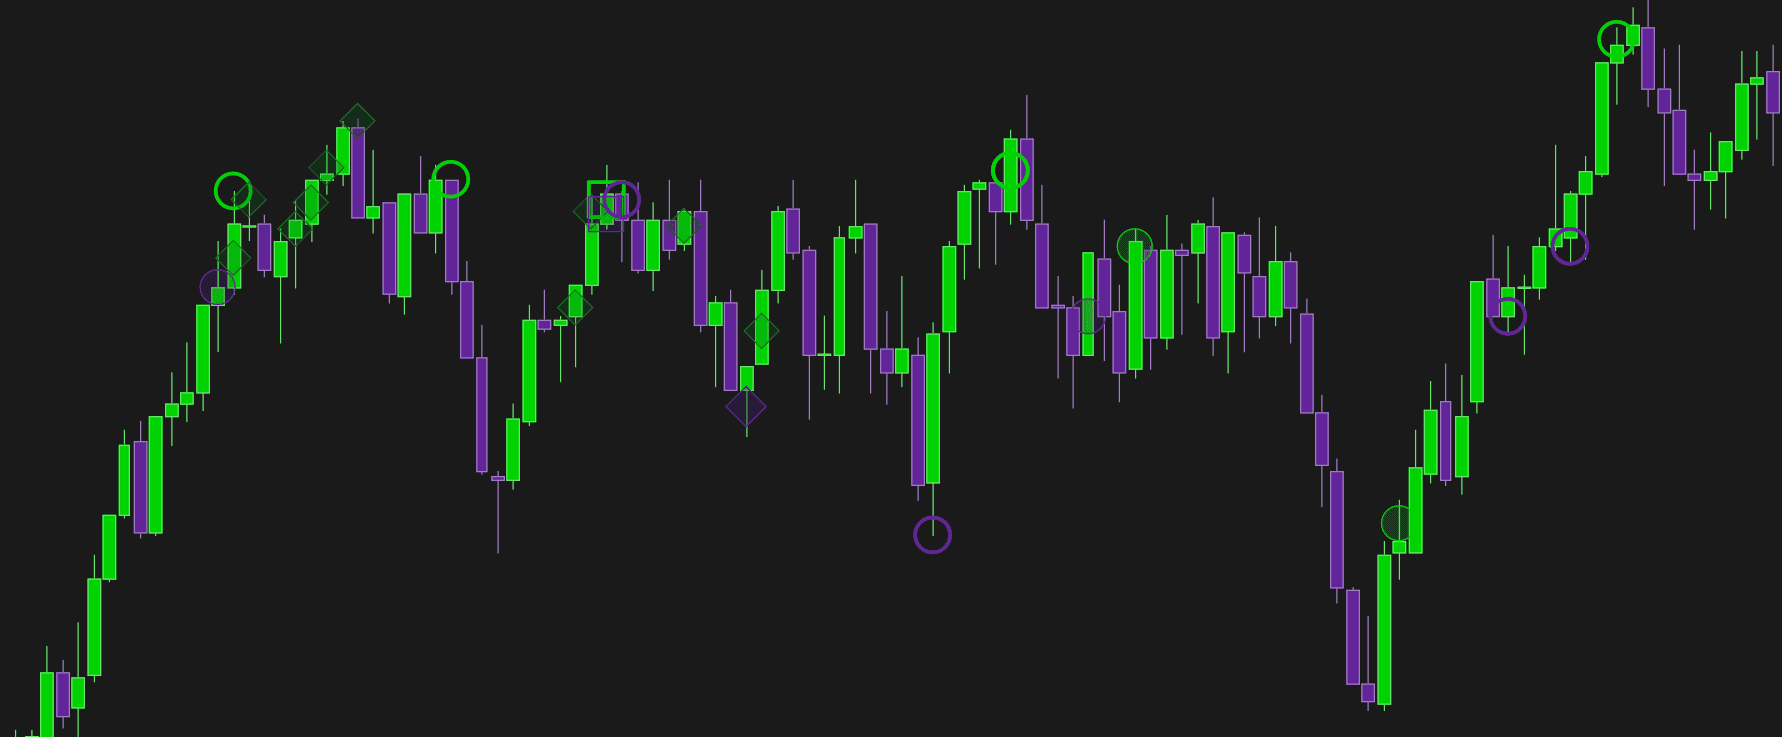
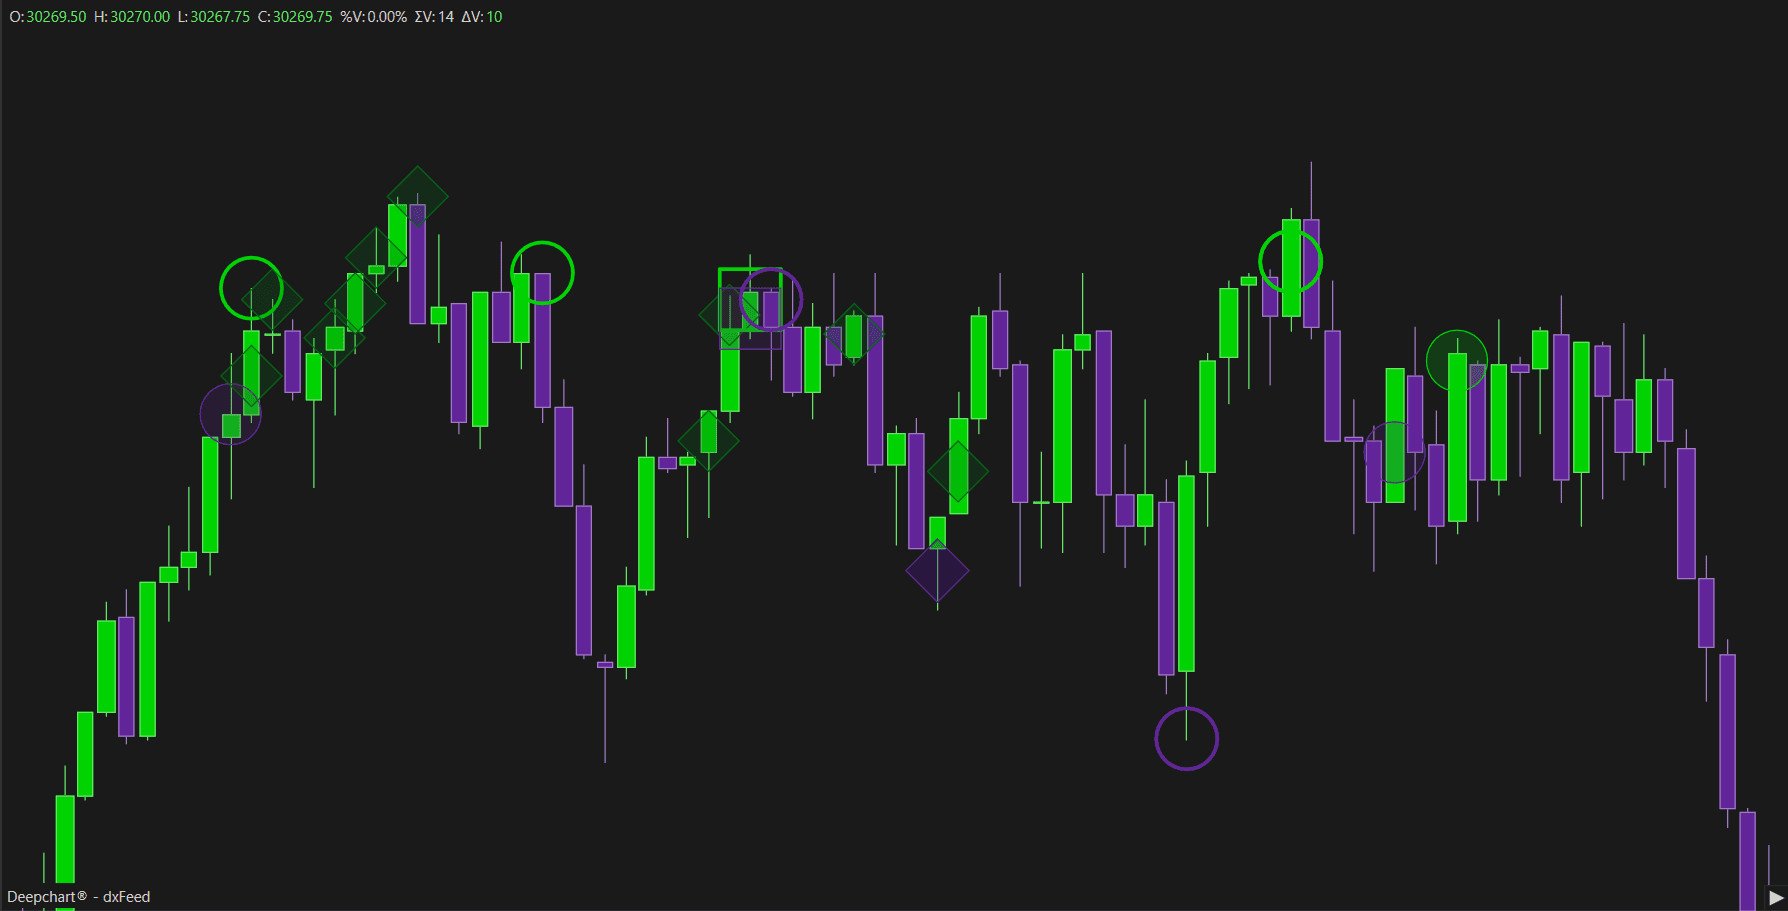
Each marker on the chart represents a different type of interaction:
Square - prints when a large order hits a big resting order on the passive side. The execution occurred directly against significant passive liquidity sitting in the book
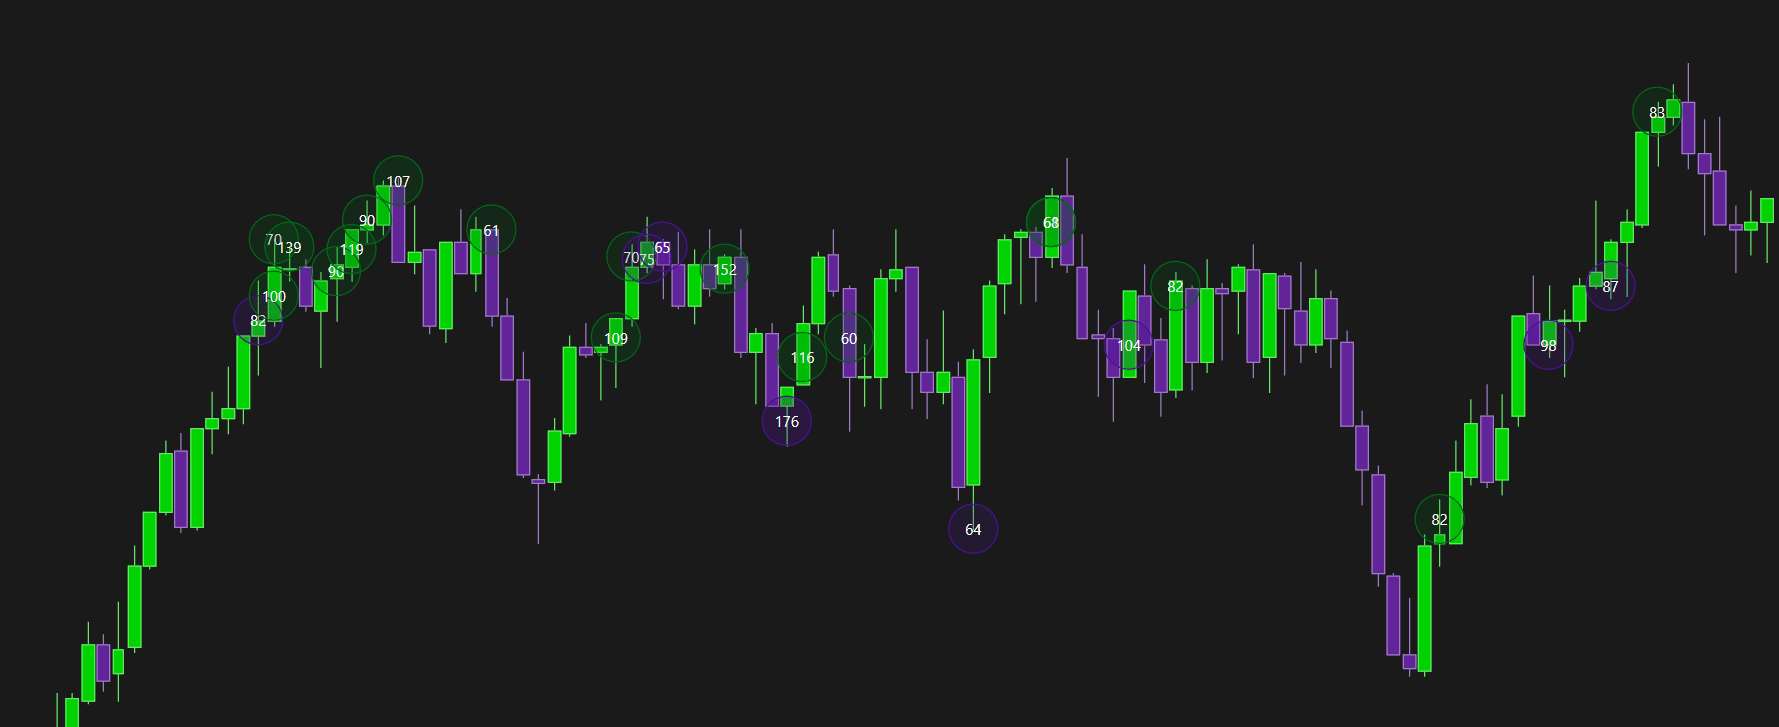
Hollow Circle - prints when a large trade is composed of smaller individual quantities combined together. The trade was large in total but built from many small orders
Filled Circle - prints when a large trade is composed of big individual quantities. The trade was large and executed with significant size in a single or few executions
Diamond - prints when a large aggressive trade hits directly on a large resting passive order. This is the most significant marker - it shows a direct confrontation between a large aggressive order and a large passive order sitting at that level
How to Set Up Deep Trades
Follow these steps to add the indicator to your chart:
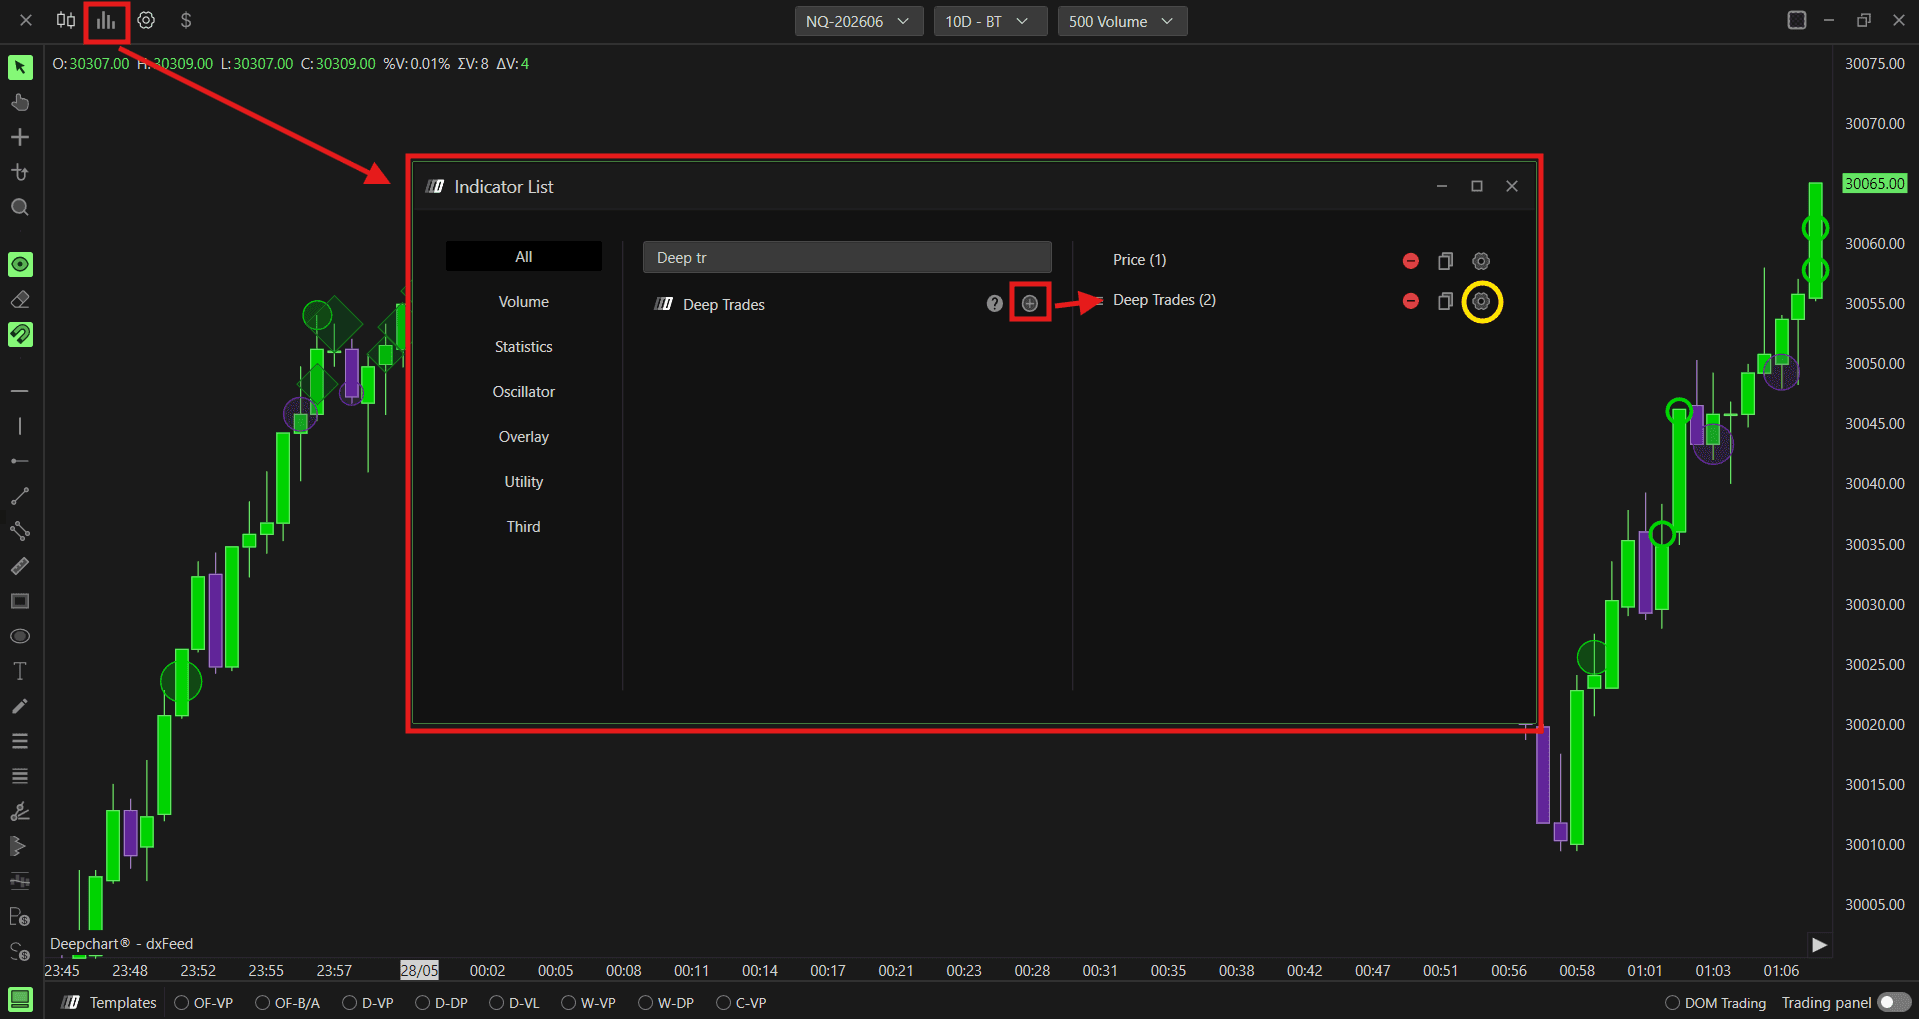
Click the Indicators icon on the chart toolbar
Find Deep Trades in the list and click + to add it
Click the settings icon on the indicator to open its configuration window
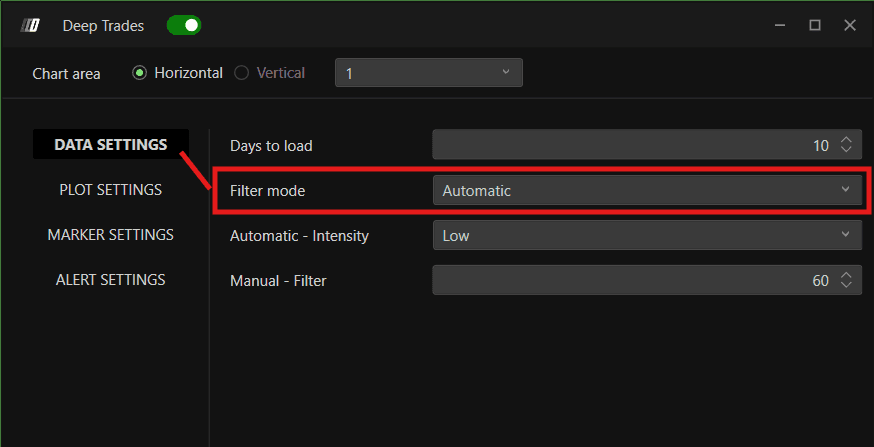
Data Settings
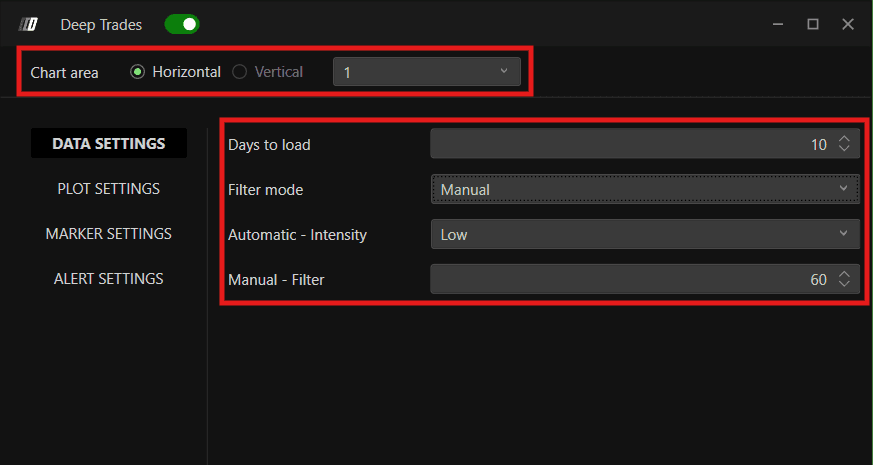
Chart Area
Defines how the indicator panel is displayed. You can choose between:
Horizontal - the panel displays horizontally
Vertical - the panel displays vertically
You can also set the panel number to organize multiple indicator panels.
Days to Load
Defines how many historical days of large trade data are loaded on the chart. For example, setting this to 10 loads the last 10 days of data.
Filter Mode
Defines how large trades are filtered and displayed. You can choose between:
Manual - you manually set the minimum trade size threshold using the Manual Filter field. For example, setting Manual Filter to 30 means only trades of 30 contracts or more will appear on the chart. This helps cut out noise and focus only on meaningful, high-volume trades
Automatic - uses the Big Trades Analysis algorithm to automatically determine the optimal thresholds for your instrument. When Automatic is selected, use the Automatic Intensity setting instead of the manual filter
Automatic - Intensity
When Filter Mode is set to Automatic, this defines the sensitivity level used by the Big Trades Analysis algorithm. You can choose between:
Low - captures a broader range of large trades, including moderately sized ones
Medium - a balanced setting that filters for trades that are meaningfully large
Strong - focuses only on the largest, most significant trades
Manual - Filter
When Filter Mode is set to Manual, this sets the minimum trade size required for a trade to appear on the chart.
Plot Settings
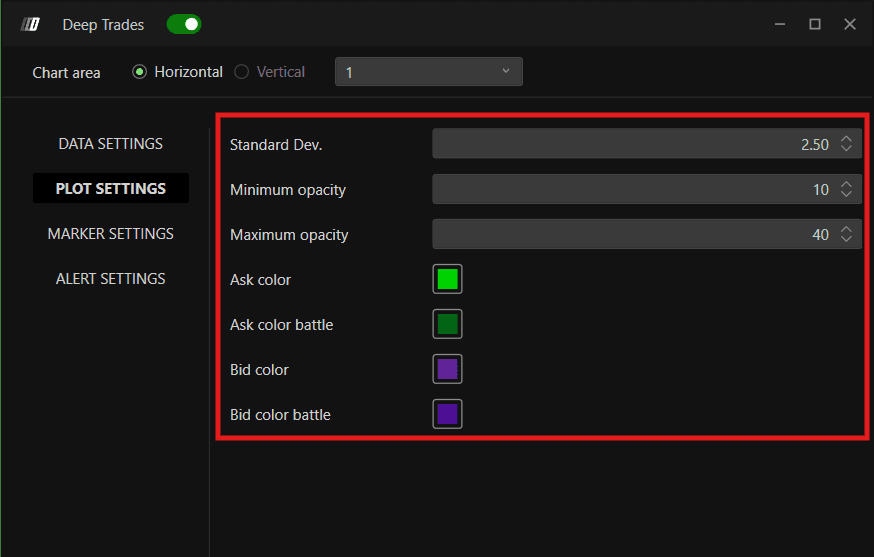
Standard Dev.
Controls how marker sizes are scaled between the minimum and maximum size range. It is recommended to keep this at the default value.
Minimum Opacity
Sets the lowest opacity level for the markers. Lower opacity makes smaller or less significant markers more transparent on the chart.
Maximum Opacity
Sets the highest opacity level for the markers. More significant trades will appear at higher opacity and stand out more clearly.
Ask Color
Sets the color for markers representing aggressive buyers - trades executed on the Ask side.
Ask Color Battle
Sets the color for Ask side markers that are paired with significant passive liquidity - the Diamond interaction type on the Ask side.
Bid Color
Sets the color for markers representing aggressive sellers - trades executed on the Bid side.
Bid Color Battle
Sets the color for Bid side markers that are paired with significant passive liquidity - the Diamond interaction type on the Bid side.
Marker Settings
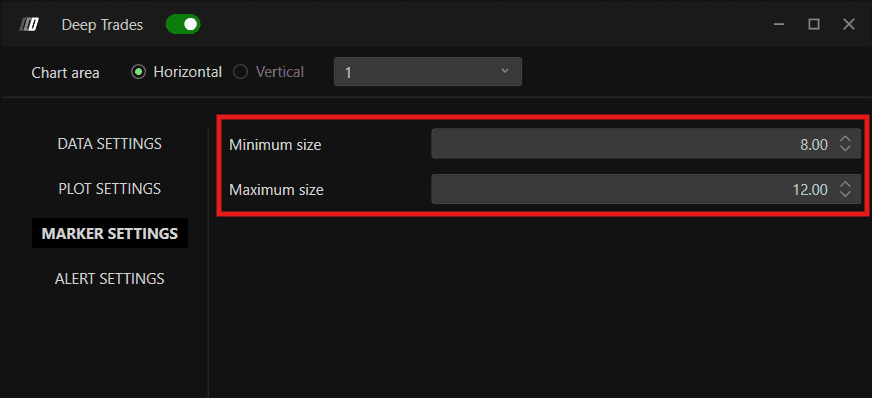
Minimum Size
Sets the smallest size a marker can appear on the chart. Trades at the lower end of the volume range will display at this size.
Maximum Size
Sets the largest size a marker can appear on the chart. The most significant trades will display at this size.
Alert Settings
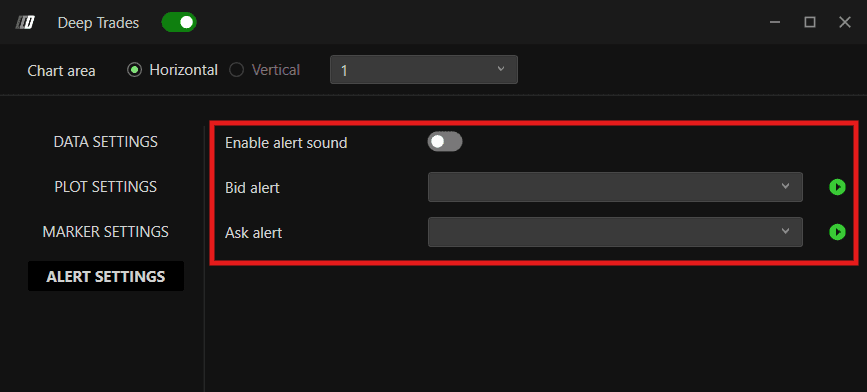
Enable Alert Sound
Turns on audio alerts when a large trade meeting your filter criteria is detected on the chart.
Bid Alert
Select the alert sound to play when a significant Bid side trade is detected - an aggressive seller hitting the market.
Ask Alert
Select the alert sound to play when a significant Ask side trade is detected - an aggressive buyer hitting the market.
Big Trades Analysis
Big Trades Analysis is a DeepCharts algorithm that automatically calculates the optimal large trade thresholds for your specific instrument - based on its price behavior and volatility. This removes the guesswork from setting filters manually.
Key Notes
The analysis only needs to be run once per week or once per month - not every time you open the platform
Results are saved automatically once the analysis is complete
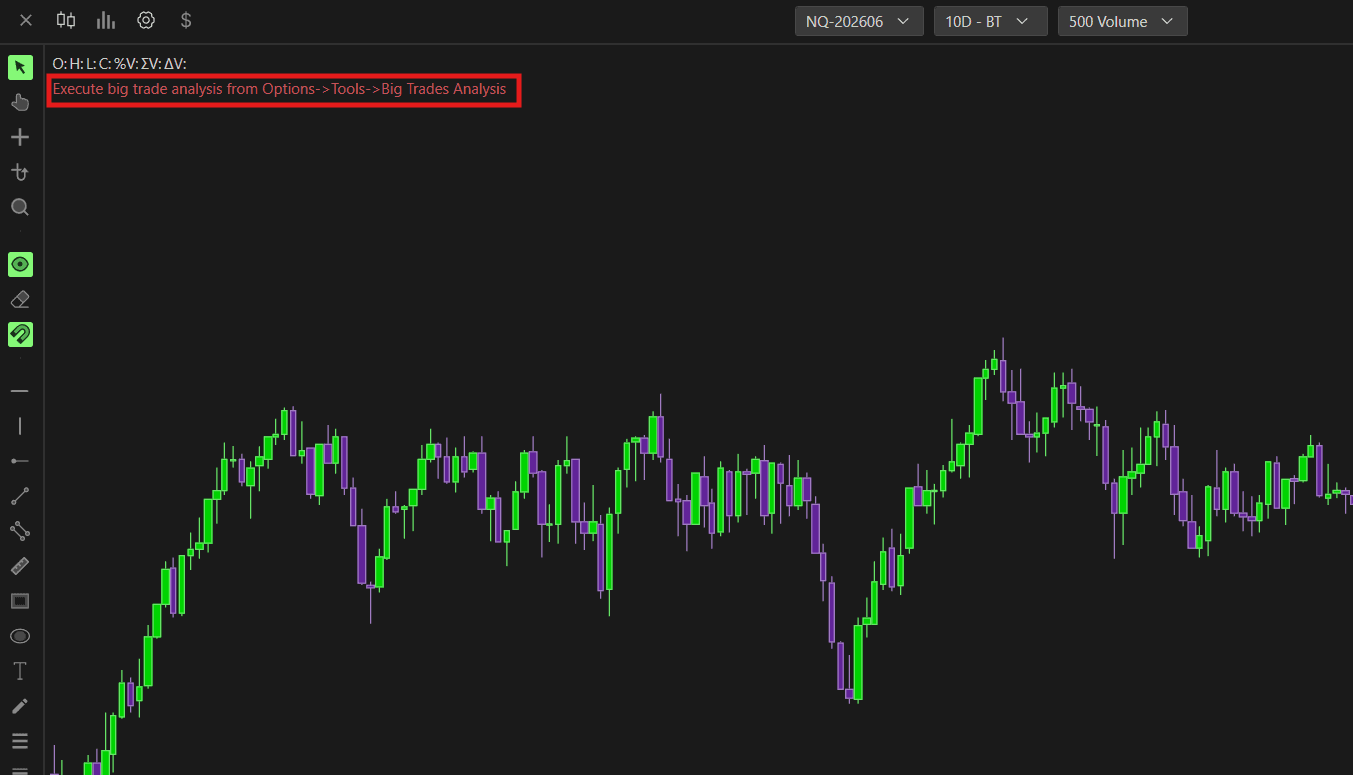
How to Run Big Trades Analysis
Apply the Deep Trades indicator to your chart
Open the indicator settings
Set Filter Mode to Automatic
Set the Automatic Intensity level - Low, Medium, or Strong - based on how selective you want the filter to be
Save the settings
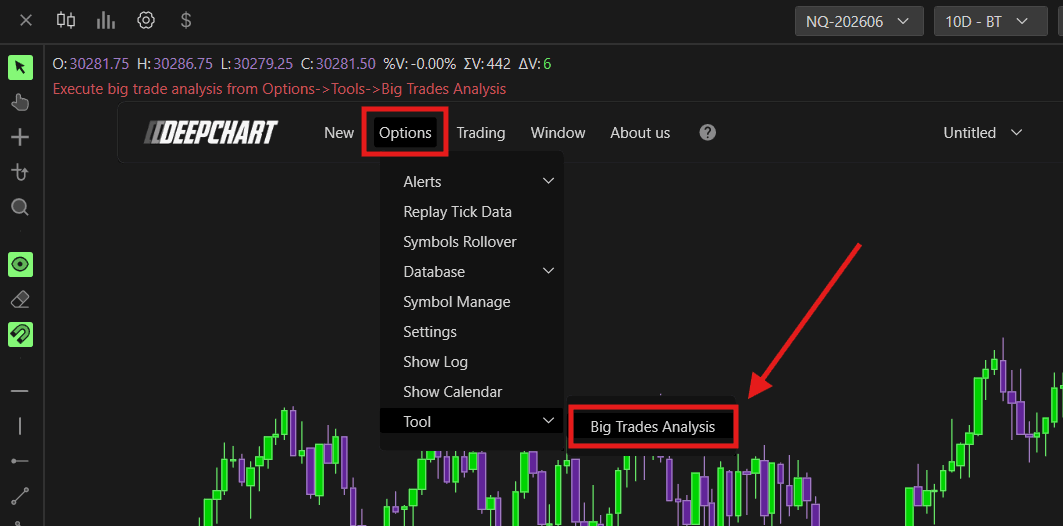
Go to Options → Tools → Big Trades Analysis
Select the instrument on which you have to run it
Run the analysis
If results do not appear immediately, reload or restart the chart
Once the analysis is complete, the indicator will automatically apply the optimized thresholds to your chart going forward.
Still Having Trouble?
Our support team is available 24/7 and ready to help you with any issue you encounter.
When reaching out, please include:
A screenshot of the issue
A brief description of what you were trying to do
Support Ticket (Fastest Response) Visit www.deepcharts.com and create a support ticket directly on our website.
Email Support Reach us at support@deepcharts.com — please note that email responses may take a little longer than a support ticket.