Updated:
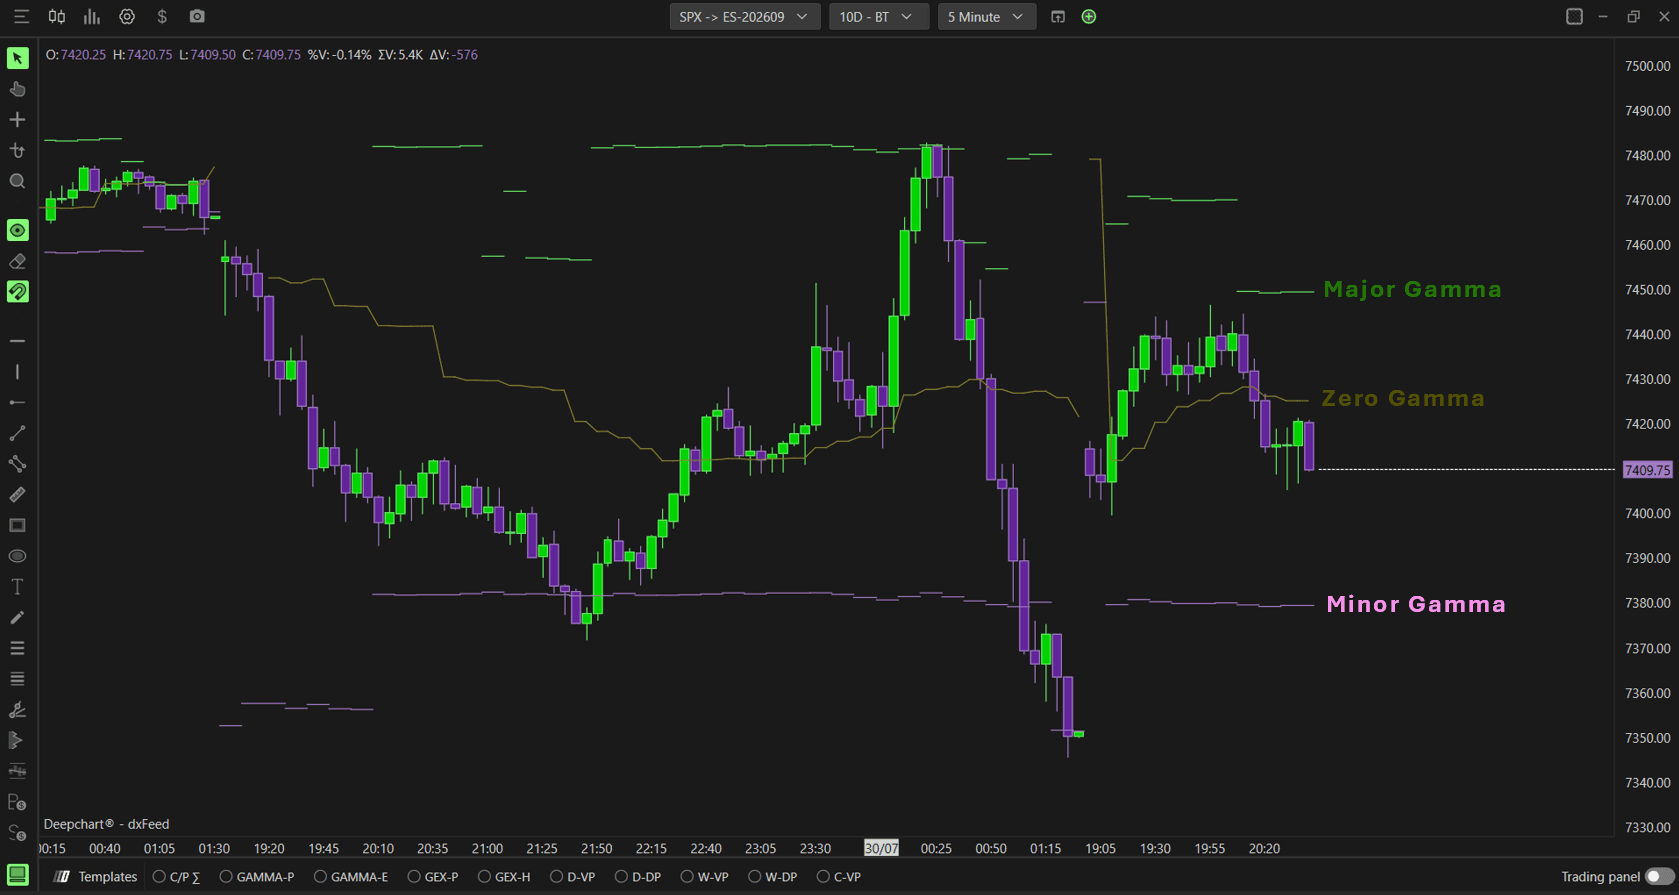
Option Envelopes plots three key gamma levels directly on your price chart as horizontal lines - Zero Gamma, Major Gamma, and Minor Gamma. These levels help you identify where dealer hedging activity is likely to be most concentrated, giving you a structural framework to understand potential support, resistance, and regime changes in the market.
Note: Option Envelopes is available on NDX, QQQ, SPY, and SPX.

How to Add Option Envelopes
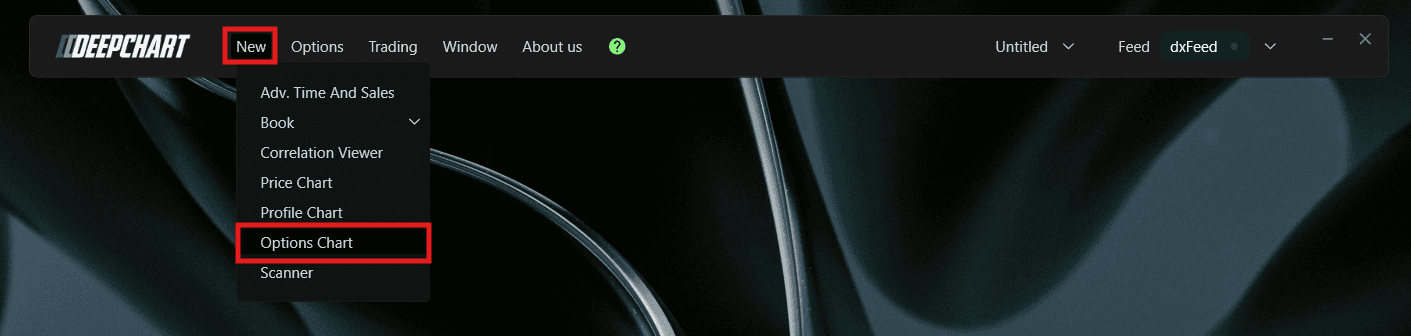
Go to New in the top menu
Click on Option Chart
A Select Instrument dialog will appear with the following options:
NDX - Symbol: NQ-CME, Exchange: CME
QQQ - Symbol: NQ-CME, Exchange: CME
SPX - Symbol: ES-CME, Exchange: CME
SPY - Symbol: ES-CME, Exchange: CME
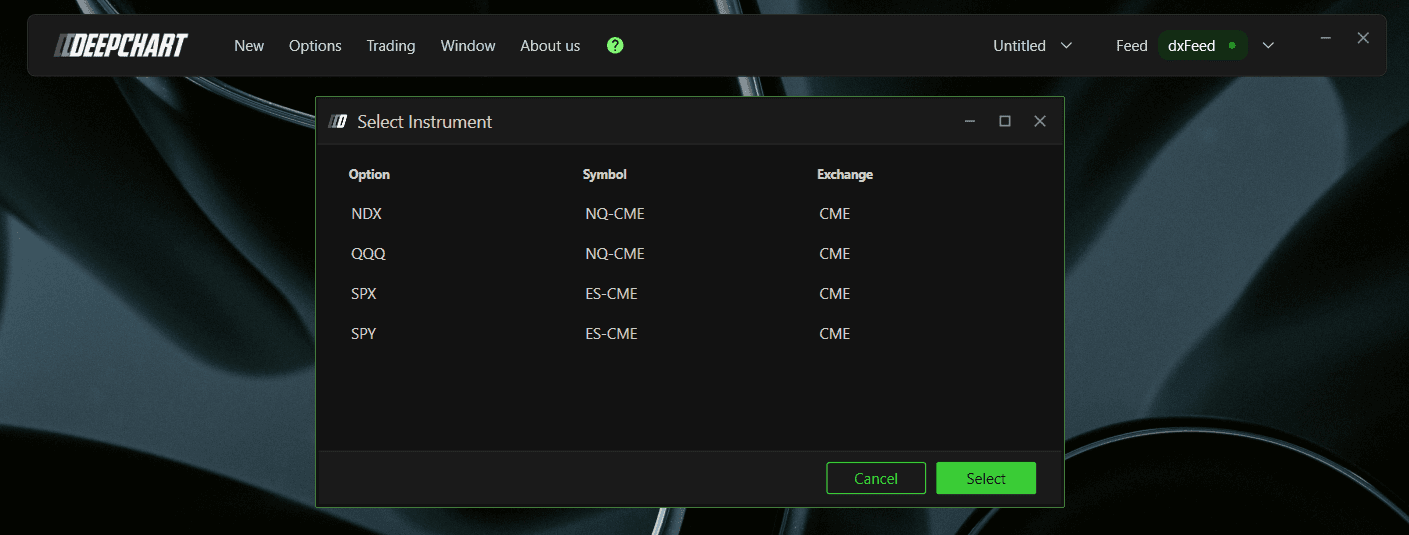
Select your preferred instrument and click to open the chart
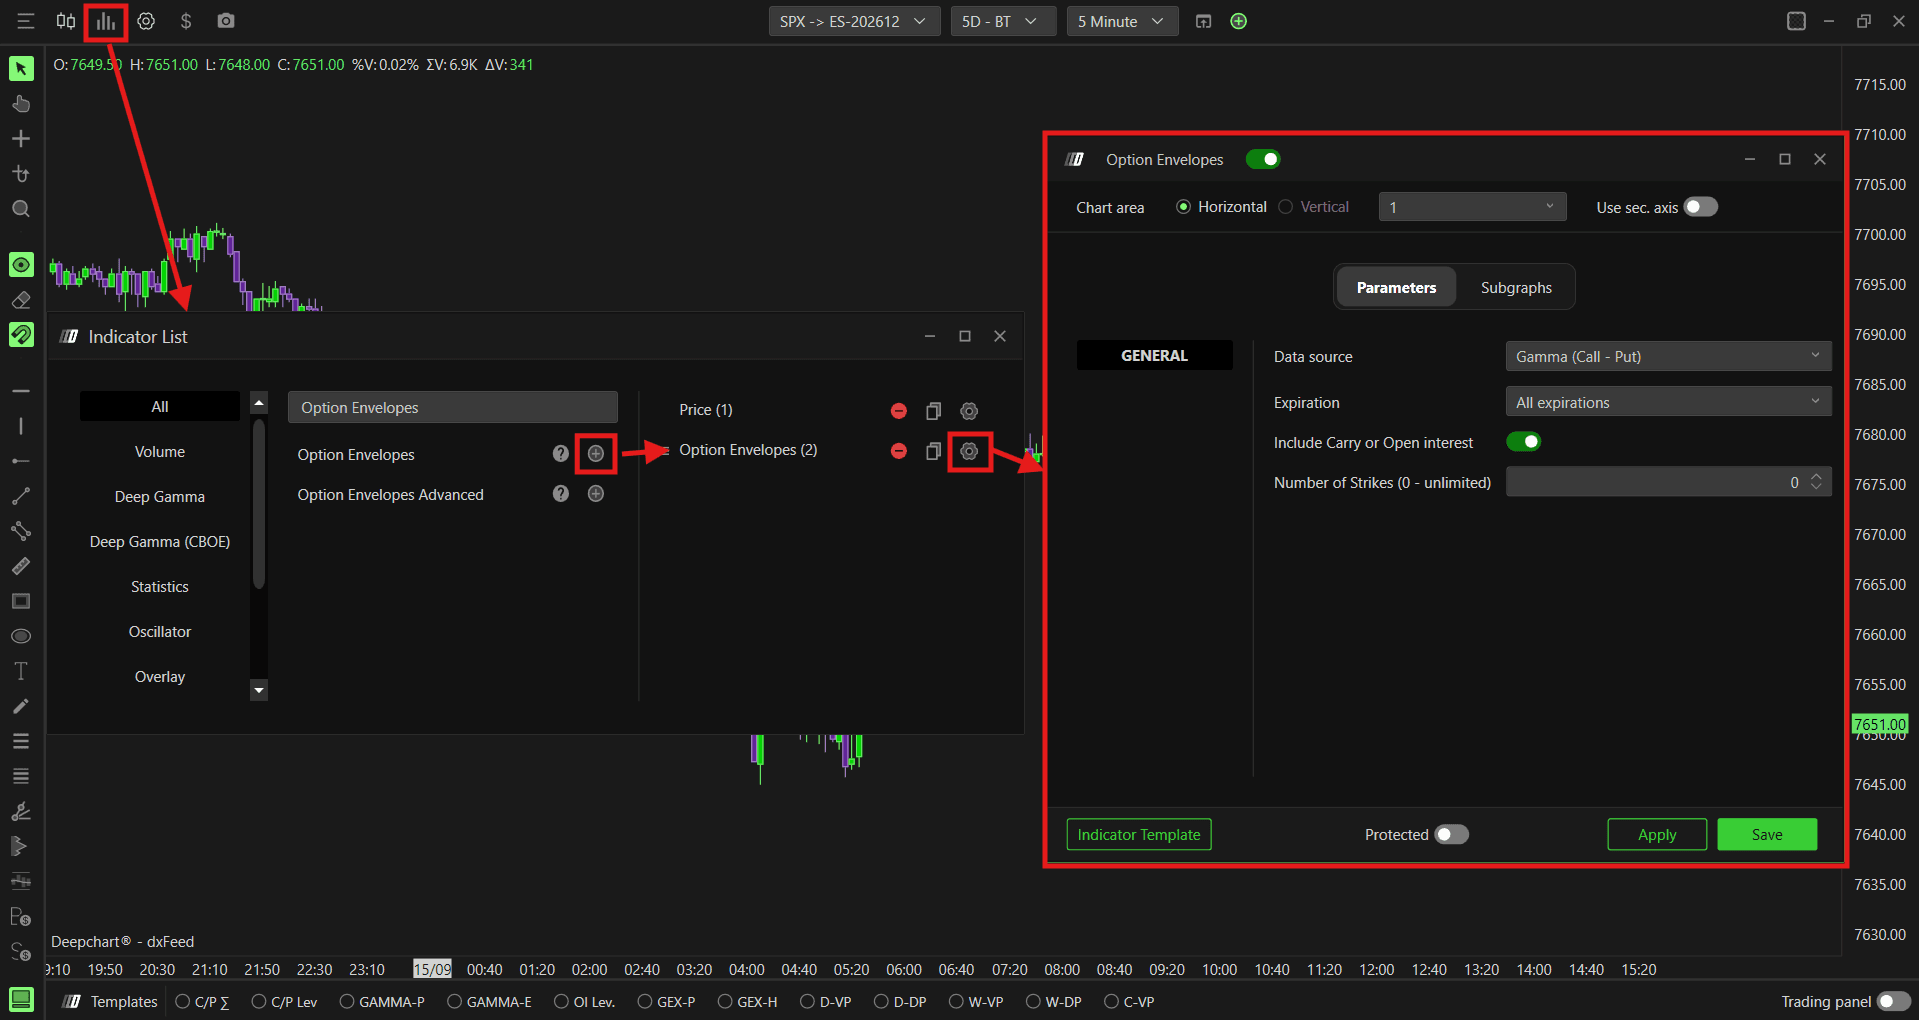
Once the Option Chart is loaded, click the Indicator Add button on the chart toolbar
Search for Option Envelopes and click + to add it
Click the settings icon to open the configuration window
Understanding Key Terms
Before choosing a data source, it helps to understand a few core options concepts:
Call - An option that gives the buyer the right to buy the underlying at a set price. Traders buy calls when they expect price to go up
Put - An option that gives the buyer the right to sell the underlying at a set price. Traders buy puts when they expect price to go down
OI (Open Interest) - The total number of option contracts currently open and not yet closed or expired
Gamma volume - Options volume multiplied by the gamma greek at each strike, giving a more accurate picture of actual dealer exposure than raw volume alone
Call put - Raw call and put options volume at each strike, with no gamma weighting
Open interest eod - Open interest data from the previous session's end of day close, rather than live intraday activity
Settings
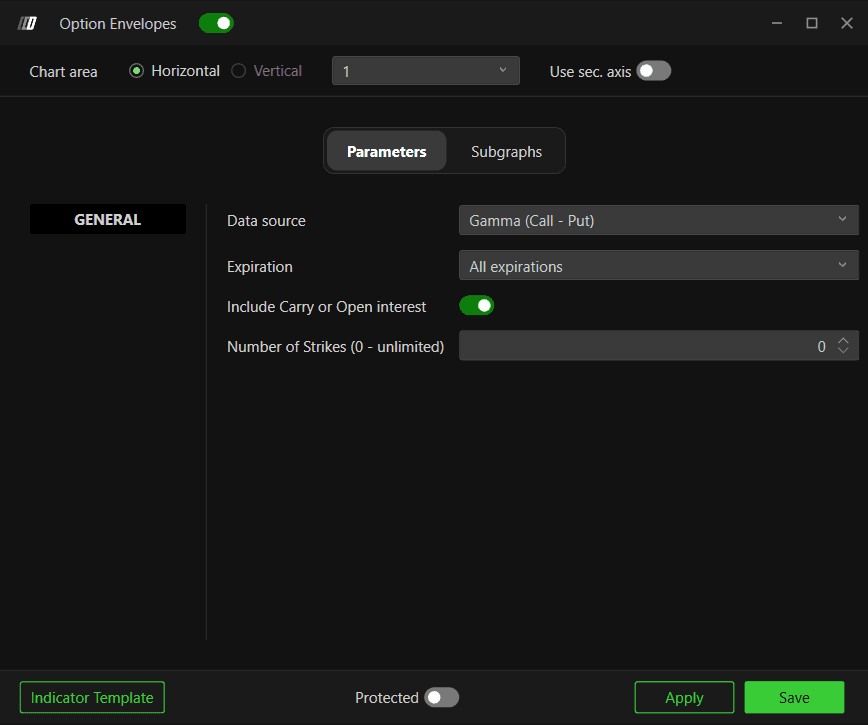
Parameters
General
Data source - Choose how the gamma levels are calculated. Options available:
Gamma (Call - Put) (default) - calculates levels based on volume multiplied by the gamma greek, giving you a more accurate picture of actual dealer exposure.
Use this when: you want a gamma-weighted read on dealer positioning and market regime
Call Σ - Put Σ - calculates levels based on the difference between raw call and put options volume, showing where the most contracts are concentrated regardless of gamma weighting.
Use this when: you want a simple read on where the most contracts are trading, regardless of gamma weighting
Call/Put Σ - calculates levels based on the ratio of call to put options volume rather than the difference, showing relative call versus put activity at each strike.
Use this when: you want to see the balance between call and put volume rather than the net difference
Call/Put OI (Eod) - calculates levels using the prior session's end of day open interest data, showing structural levels based on standing positions rather than the current session's live trading activity.
Use this when: you want a structural view based on standing positions from the previous session's close, rather than live intraday trading activity
Gamma (Call OI-E - Put OI-E) - calculates levels based on the difference between call and put end of day open interest multiplied by the gamma greek, giving a gamma-weighted read on standing positions rather than live volume.
Use this when: you want a gamma-weighted view of dealer exposure based on standing open interest instead of current session trading activity
Expiration - Filter levels by expiration. Options available: 0 DTE, <= 1d, <= 7d, <= 31d, <= 91d, All expirations. Default is All expirations
Include Carry or Open Interest - When enabled, includes open interest carried over from previous sessions into the calculation, giving you a broader view of total positioning. When disabled, only the current session data is considered. Default is disabled
Number of Strikes (0 - unlimited) - Sets how many strikes out from the current price to include in the calculation. A value of 0 includes an unlimited number of strikes. Default is 0
Subgraphs
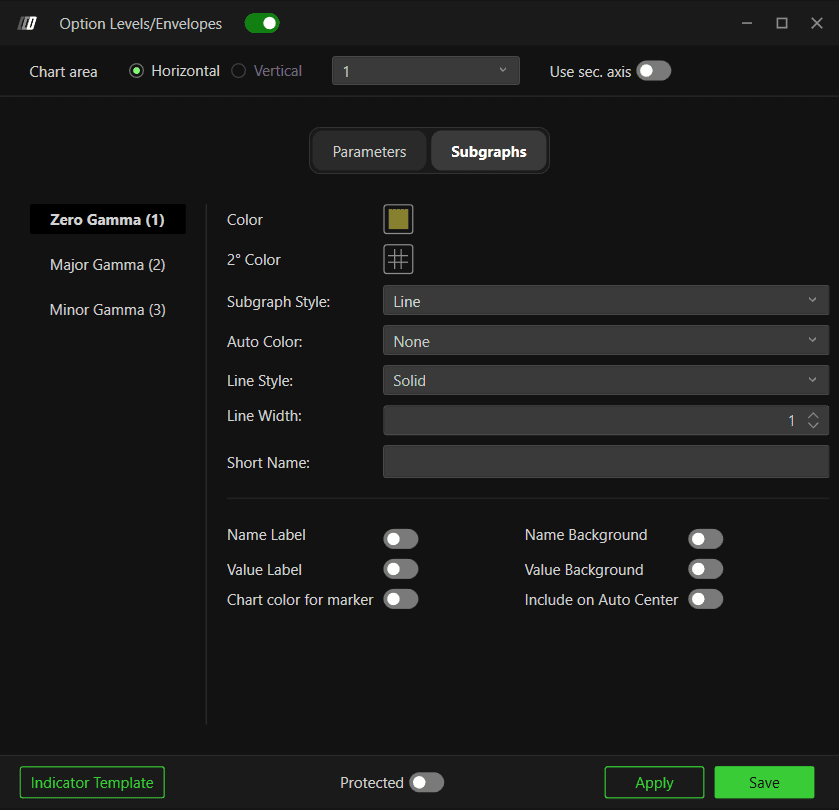
Zero Gamma (1)
Zero Gamma is the most important level. It represents the price point where dealer gamma exposure flips from positive to negative. Above this level dealers are long gamma and will dampen price moves. Below it dealers are short gamma and will amplify price moves.
Color - Default is yellow/gold
2° Color - Set a secondary color
Subgraph Style - Choose between Line or Hidden. Default is Line
Auto Color - Options: None, Slope, +/-. Default is None
Line Style - Choose between Solid or Dash. Default is Solid
Line Width - Default is 1
Short Name - Set a custom label for this series
Name Label - Toggle visibility of the name label
Value Label - Toggle visibility of the value label
Name Background - Toggle the name label background
Value Background - Toggle the value label background
Chart color for marker - Enable to use chart color for markers
Include on Auto Center - Enable to include this series in auto centering. Default is disabled
Major Gamma (2)
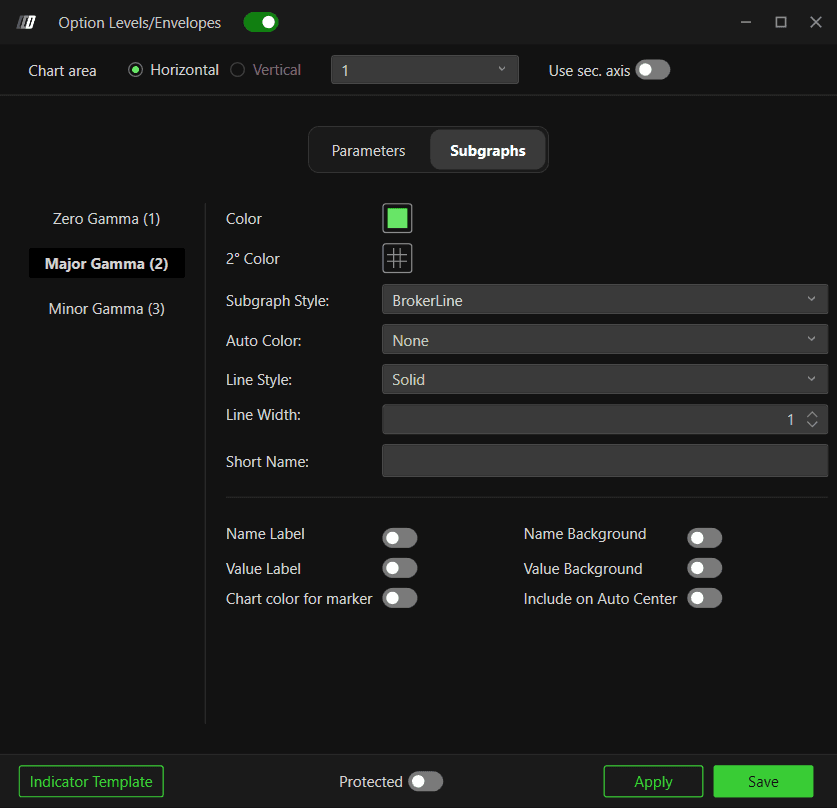
Major Gamma represents the highest concentration of dealer gamma exposure above the current price. This is where the most significant resistance or support from dealer hedging is likely to appear.
Color - Default is green
2° Color - Set a secondary color
Subgraph Style - Choose between Line, Hidden, or BrokerLine. Default is BrokerLine
Auto Color - Options: None, Slope, +/-. Default is None
Line Style - Choose between Solid or Dash. Default is Solid
Line Width - Default is 1
Short Name - Set a custom label for this series
Name Label - Toggle visibility of the name label
Value Label - Toggle visibility of the value label
Name Background - Toggle the name label background
Value Background - Toggle the value label background
Chart color for marker - Enable to use chart color for markers
Include on Auto Center - Enable to include this series in auto centering. Default is disabled
Minor Gamma (3)
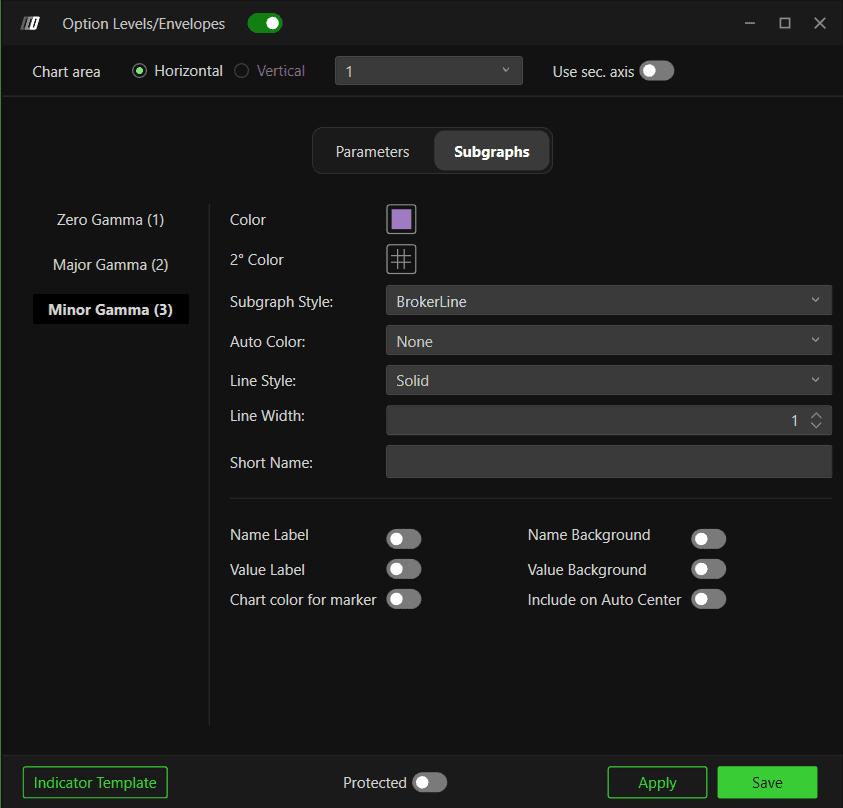
Minor Gamma represents the secondary concentration of dealer gamma exposure. It acts as a softer level compared to Major Gamma and can be useful for identifying intermediate reaction zones.
Color - Default is purple
2° Color - Set a secondary color
Subgraph Style - Choose between Line, Hidden, or BrokerLine. Default is BrokerLine
Auto Color - Options: None, Slope, +/-. Default is None
Line Style - Choose between Solid or Dash. Default is Solid
Line Width - Default is 1
Short Name - Set a custom label for this series
Name Label - Toggle visibility of the name label
Value Label - Toggle visibility of the value label
Name Background - Toggle the name label background
Value Background - Toggle the value label background
Chart color for marker - Enable to use chart color for markers
Include on Auto Center - Enable to include this series in auto centering. Default is disabled
Example - How to Use Option Envelopes
Once added to your chart, you will see three types of lines plotted directly on your price chart:
The yellow line is the Zero Gamma level, the most important level on the chart. Think of it as the dividing line between two different market regimes. When price is trading above it, dealers tend to be long gamma and the market tends to be calmer, with moves more likely to fade. When price breaks below it, dealers tend to be short gamma and the market can become more volatile, with moves extending further
The green lines are the Major Gamma levels, zones where dealer gamma exposure is most concentrated. How price reacts here depends on the direction it is approaching from and the current gamma regime, it may slow down, reverse, or accelerate through the level rather than reacting the same way every time
The purple line is the Minor Gamma level, a softer secondary reference zone. It carries the same kind of significance as Major Gamma, just to a lesser degree, useful for identifying intermediate reaction points
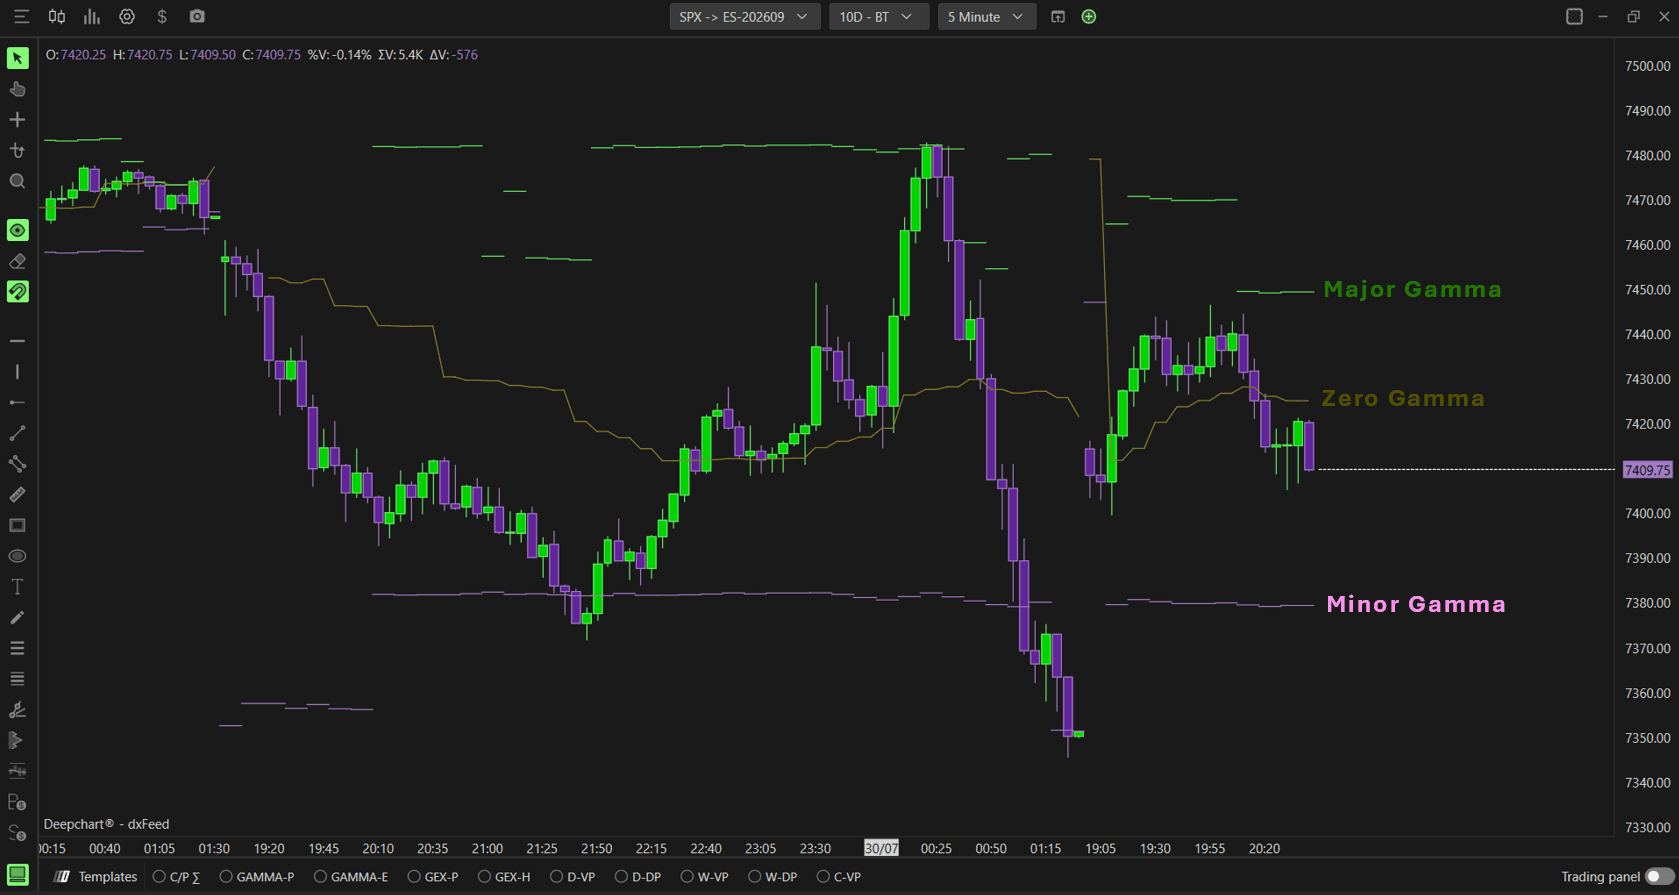
A simple way to use this indicator is to note where price is relative to the Zero Gamma level at the start of your session. If price is above it, expect a more compressed market where breakouts may fail. If price is below it, expect more directional moves and be cautious about fading strong moves.
Any Questions?
Our support team is available 24/7 and ready to help you with any question.
When reaching out, please include:
Screenshot (if any)
Briefly describe the assistance or support you require
DeepCharts Live Support - Chat with our agents directly using the live chat box on www.deepcharts.com, or click here for 24/7 Live Chat for immediate access.
Email Support - Reach us at support@deepcharts.com - please note that email responses may take a little longer than a live support chat.
