Indicators
Updated:
The Aroon Oscillator measures trend strength and direction by calculating the difference between Aroon Up and Aroon Down.
It helps traders identify:
Emerging trends
Trend strength
Potential reversals
Overbought and oversold conditions
The oscillator fluctuates around a zero line.

Settings

Parameters
Length
Number of bars used in the Aroon calculation.
Default: 14
Lower values = more sensitive
Higher values = smoother signals
Level Settings
Middle Level
Default: 0
Represents neutral trend.
Lower Level
Default: 80
High Level
Default: -80
These levels help identify strong trend conditions and potential exhaustion zones.
Middle / Lower / Higher Level Color
Customize the color of each reference level.
Level Width
Adjusts the thickness of level lines.
Subgraphs
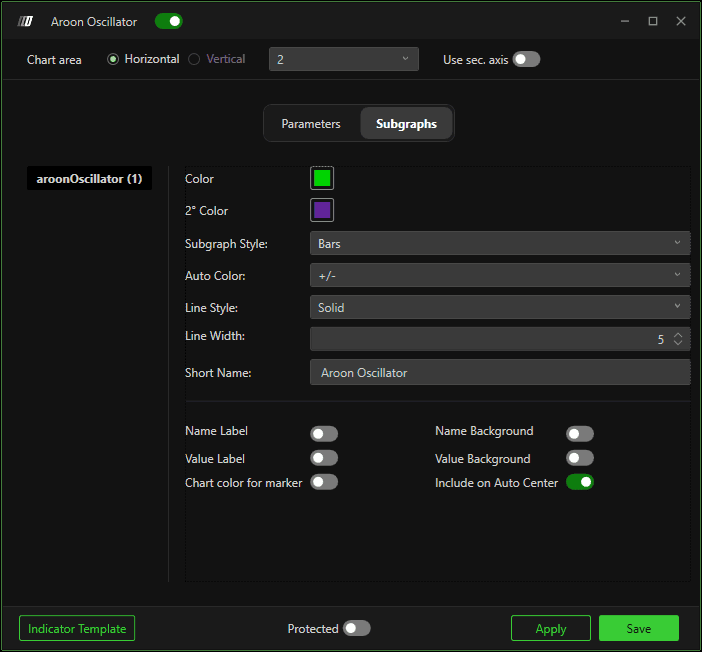
Aroon Oscillator
Color – Primary bar color.
2° Color – Secondary color (used with auto-color logic).
Subgraph Style – Default: Bars
Auto Color (+/-) – Automatically changes color based on positive or negative values.
Line Style – Solid / other styles.
Line Width – Thickness of bars/lines.
Short Name – Custom display name.
Additional display options:
Name Label
Value Label
Chart color for marker
Name Background
Value Background
Include on Auto Center