Indicators
Updated:
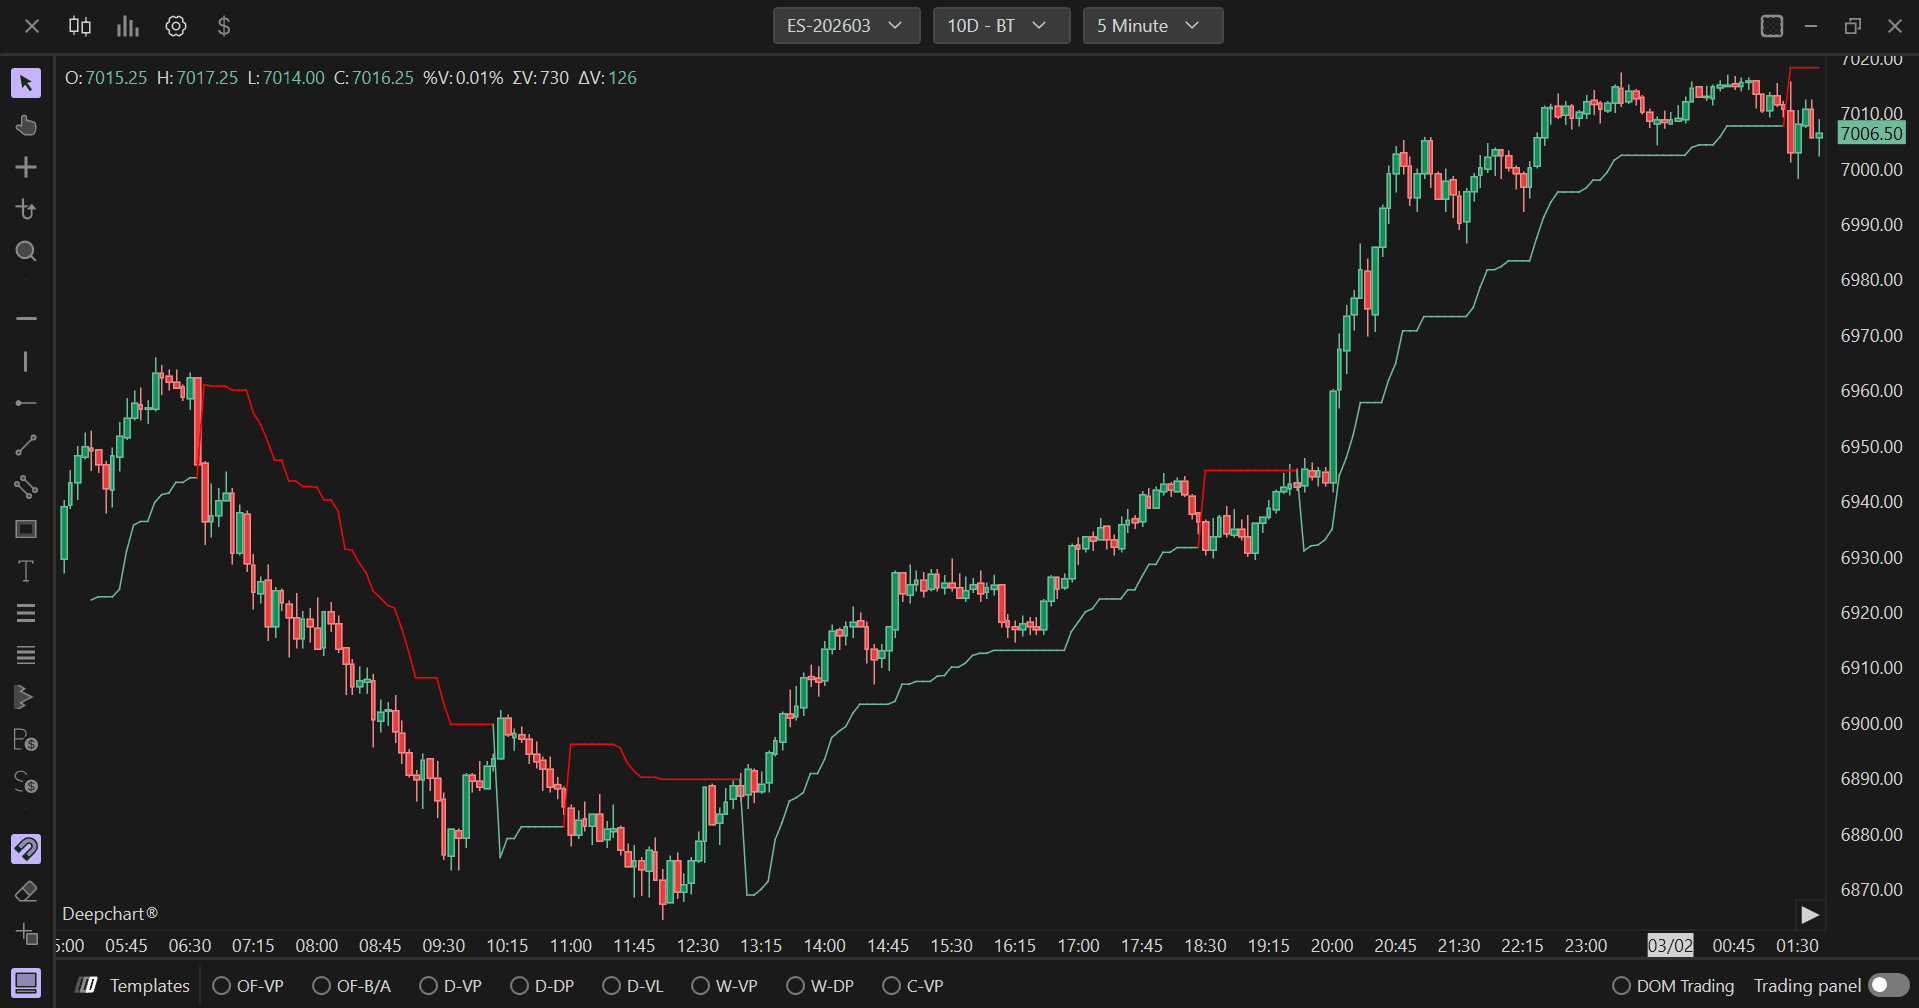
The Super Trend indicator is a powerful trend-following tool that helps traders identify the direction of the market trend. It plots dynamic support and resistance levels on the chart, providing indication for the uptrend or the downtrend based on price movement and volatility.
Settings of Use
Clicking on the indicator's settings icon will open its configuration window, within which it will be possible to make several choices regarding the functionality of the indicator itself.
General Parameters

Length
Defines the period length for calculating the Average True Range (ATR), which is used to determine the indicator's sensitivity to price movements. The default value is 10. A higher length value makes the indicator less sensitive to short-term price fluctuations, while a lower value increases sensitivity.
Multiplier
Sets the multiplier for the ATR value, which determines the distance of the Super Trend line from the price. The default value is 3.00. Increasing the multiplier creates wider bands, reducing false signals but potentially delaying entry and exit points. Decreasing it creates tighter bands, providing earlier signals but with more noise.
Chart Settings
Chart Area
Allows you to select whether to display the indicator in a horizontal or vertical layout. You can choose:
Horizontal: Displays the Super Trend line horizontally across the main price chart.
Vertical: Displays the indicator in a separate vertical panel.
Use Sec. Axis
When enabled, the indicator will use a secondary axis for plotting. This is useful when overlaying multiple indicators with different price scales, allowing for better visualization and comparison.
Alert Settings
Enable Alert Sound
When enabled, the platform will play an audible alert whenever the Super Trend indicator generates a signal (trend change). This helps traders stay informed of important market movements without constantly monitoring the chart.
Alert Name
Allows you to set a custom name for the alert. This is useful for identifying specific alerts when multiple indicators are active, making it easier to organize and manage notifications.
Enable Message
When enabled, the platform will display a message notification when the Super Trend indicator generates a signal. This provides a visual confirmation of the alert in addition to or instead of the sound notification.
Subgraphs
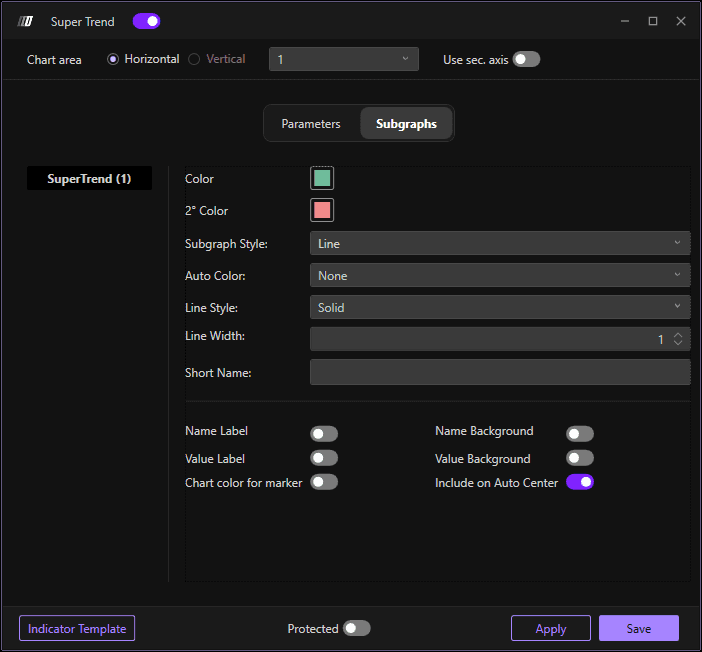
Color
Sets the primary color for the Super Trend line when the trend is bullish (uptrend). This color will be displayed when the indicator suggests buying pressure is dominant.
2° Color
Sets the secondary color for the Super Trend line when the trend is bearish (downtrend). This color will be displayed when the indicator suggests selling pressure is dominant.
Subgraph Style
Allows you to select the visual style of the Super Trend line on the chart. The default option is "Line," which displays the indicator as a continuous line following the trend.
Auto Color
When set to "None," the indicator uses the manually defined colors (Color and 2° Color). If enabled, this option can automatically adjust the indicator's color based on specific conditions or trend strength.
Line Style
Defines the style of the Super Trend line. The default is "Solid" for a continuous line.
Line Width
Adjusts the thickness of the Super Trend line. The default value is 1. Increasing this value makes the line more prominent and easier to see on the chart, while decreasing it creates a thinner, more subtle line.
Short Name
Allows you to set a custom short name or label for the indicator that will appear on the chart legend. This is useful for quickly identifying the indicator when multiple tools are displayed simultaneously.
Name Label
When enabled, displays the indicator's name label on the chart. This helps identify which indicator is which when multiple indicators are active.
Name Background
When enabled, adds a background color behind the name label, making it more visible and easier to read against the chart background.
Value Label
When enabled, displays the current value of the Super Trend indicator on the chart. This provides real-time numerical data alongside the visual line representation.
Value Background
When enabled, adds a background color behind the value label, improving visibility and readability of the numerical values displayed on the chart.
Chart Color for Marker
When enabled, the indicator can change the color of candles or chart elements based on the trend direction identified by the Super Trend. This provides an additional visual cue for trend confirmation.
Include on Auto Center
When enabled, the indicator will be included in the chart's auto-centering calculation. This ensures that the entire indicator remains visible when the chart automatically adjusts its scale to fit all displayed data.