Indicators
Updated:
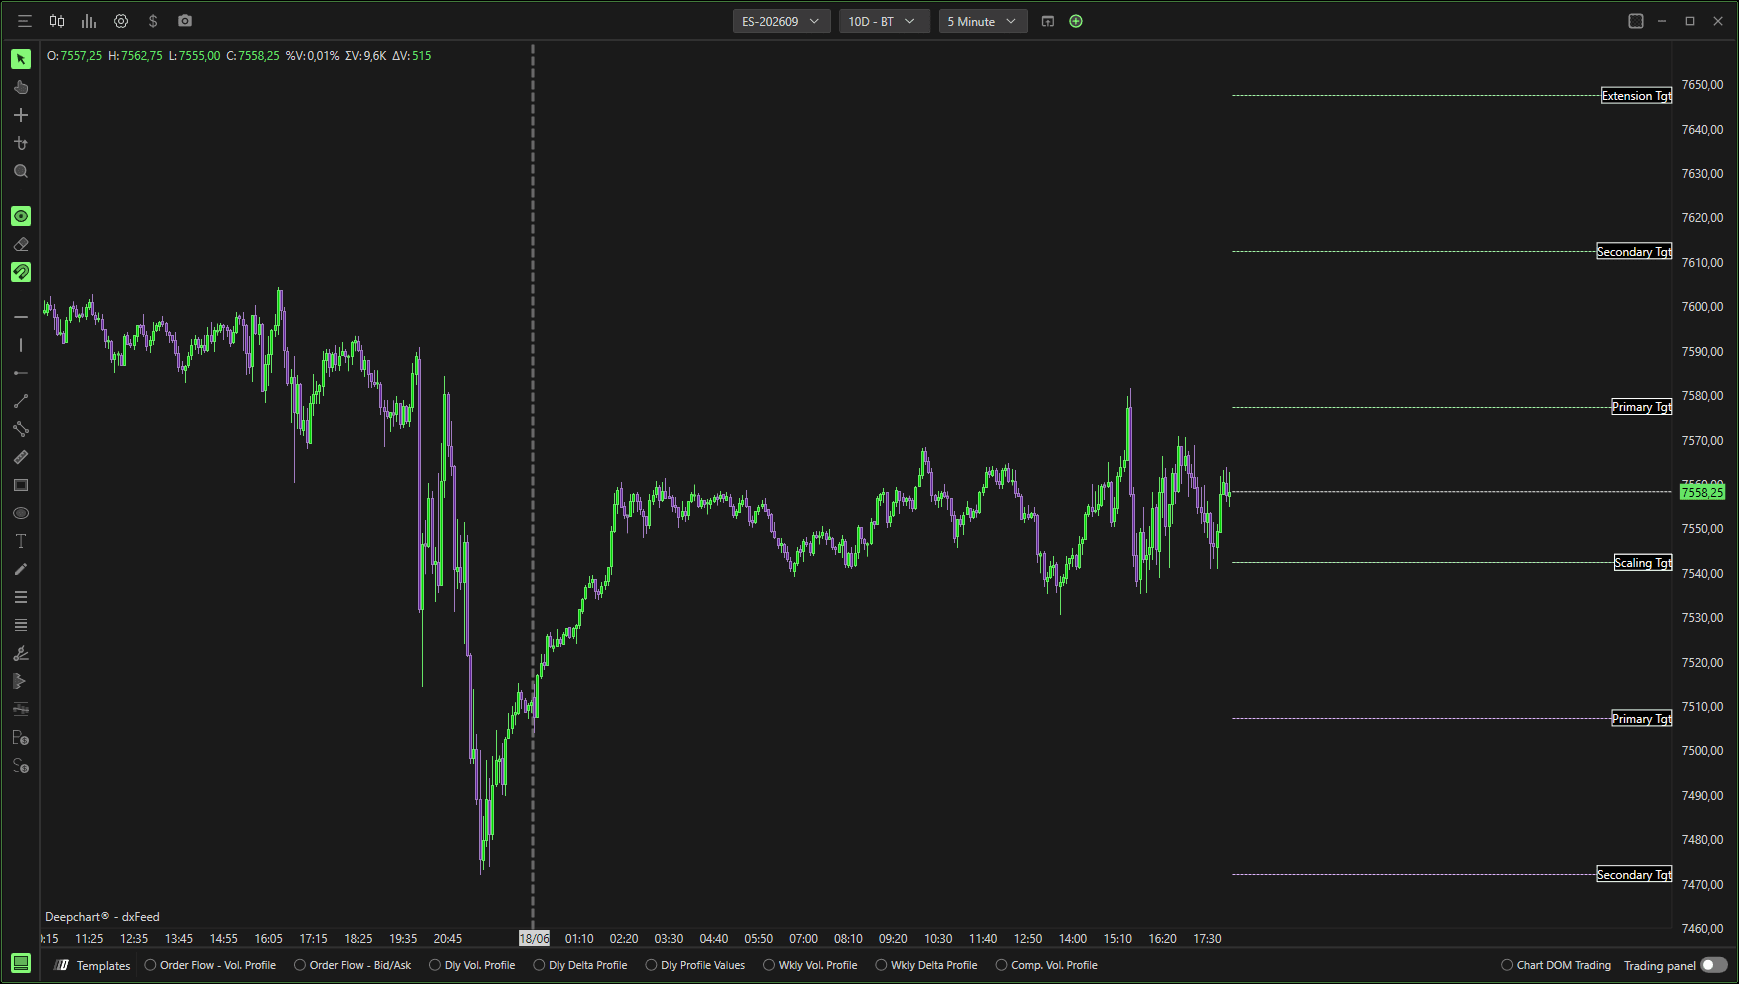
The Average Daily Range (ADR) target indicator calculates the average price movement (high to low) of an asset over a set number of days to project potential intraday price targets. It helps traders set realistic take-profit and stop-loss levels based on current.
It helps traders:
Identify realistic daily expansion targets
Estimate potential intraday exhaustion zones
Manage profit targets based on statistical range
Avoid overtrading beyond average volatility
Settings
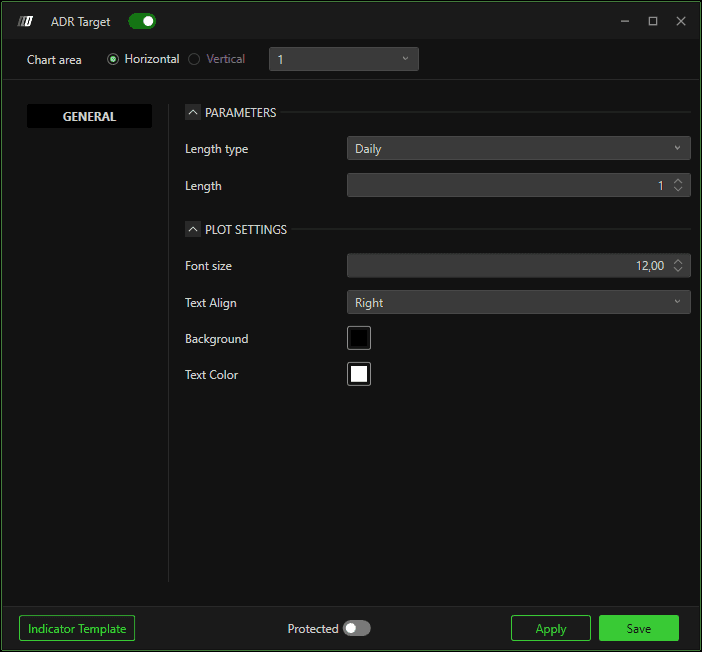
Parameters
Length Type
Daily – Calculates ADR using daily bars.
Weekly
Monthly
Length
Number of previous days used to calculate the Average Daily Range.
Example: Length = 10 → Uses the last 10 trading days.General
Plot Settings
Font Size – Adjusts ADR label text size.
Text Align – Left / Right alignment of label text.
Background – Label background color.
Text Color – Label text color.