Indicators
Updated:
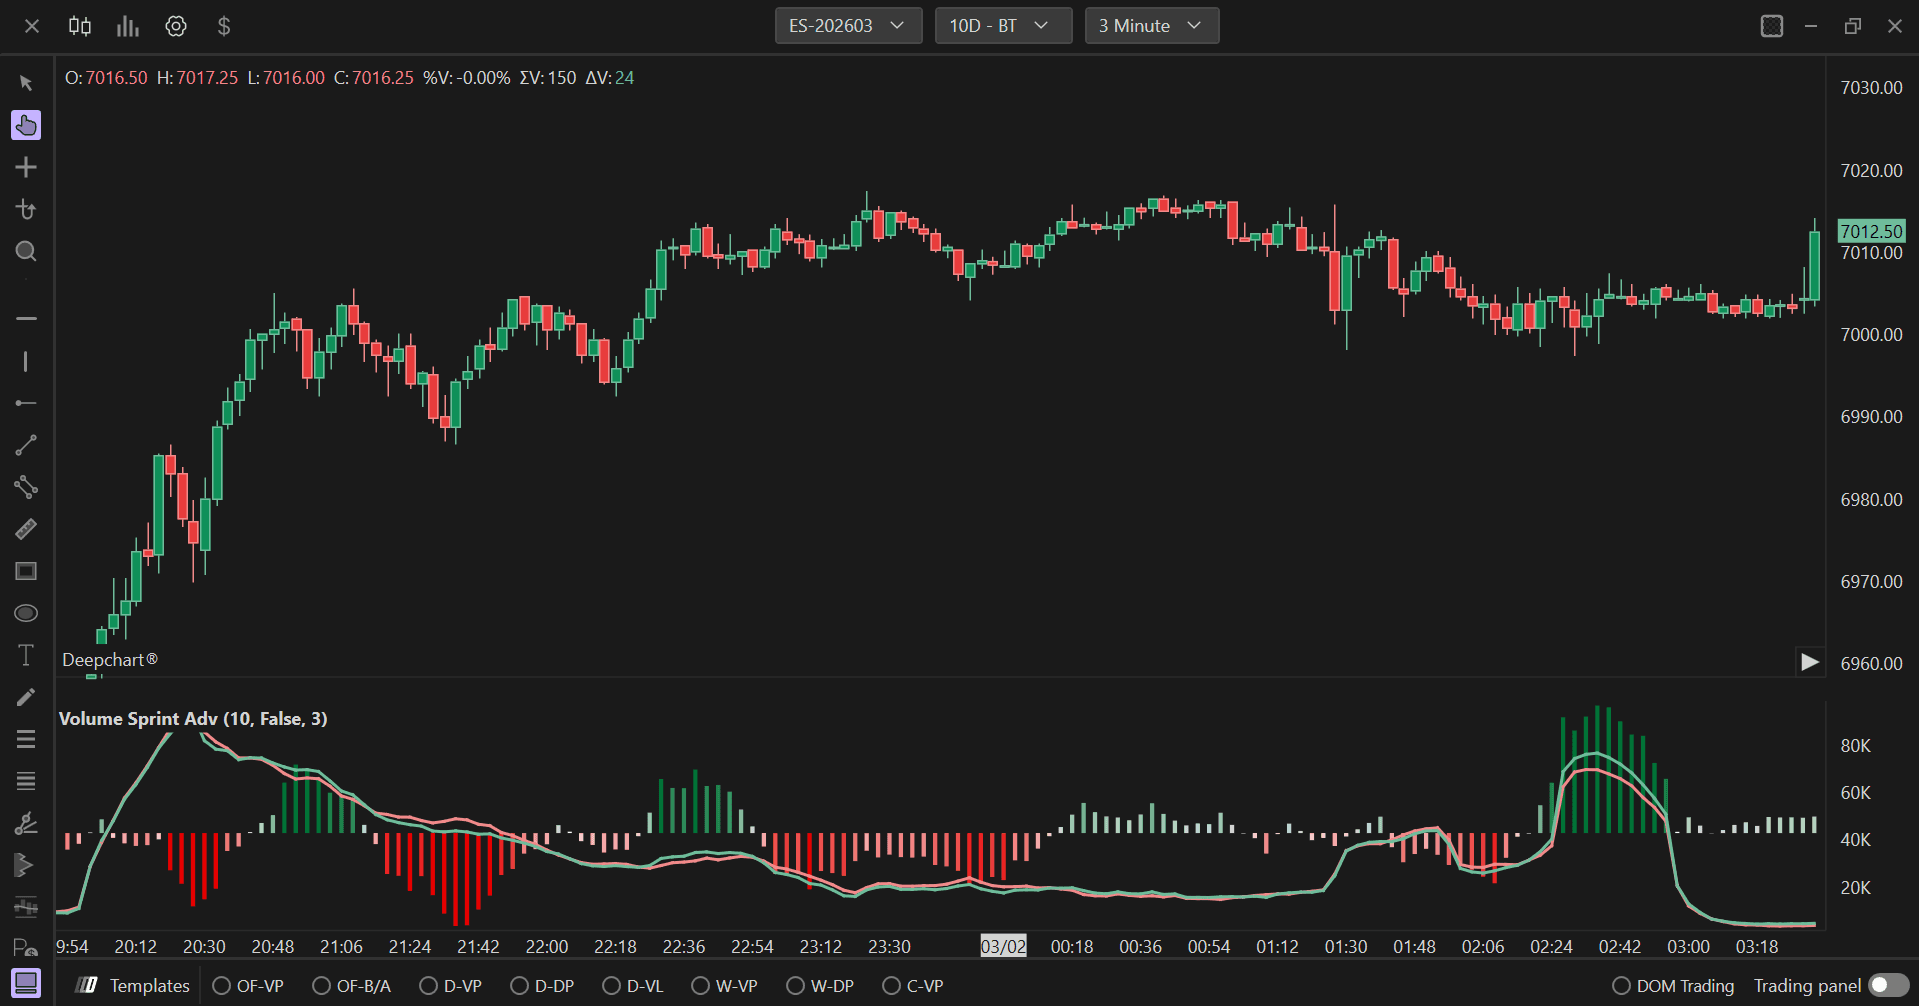
The Volume/Delta Sprint indicator displays cumulative volume and delta values over specified time periods as a histogram in a separate panel. It helps traders analyze volume accumulation patterns, identify periods of buying or selling pressure, and assess the strength behind price movements. The indicator features advanced smoothing options and multiple data input types for comprehensive volume analysis.
Settings of Use
Clicking on the indicator's settings icon will open its configuration window, within which it will be possible to make several choices regarding the functionality of the indicator itself.
General Parameters
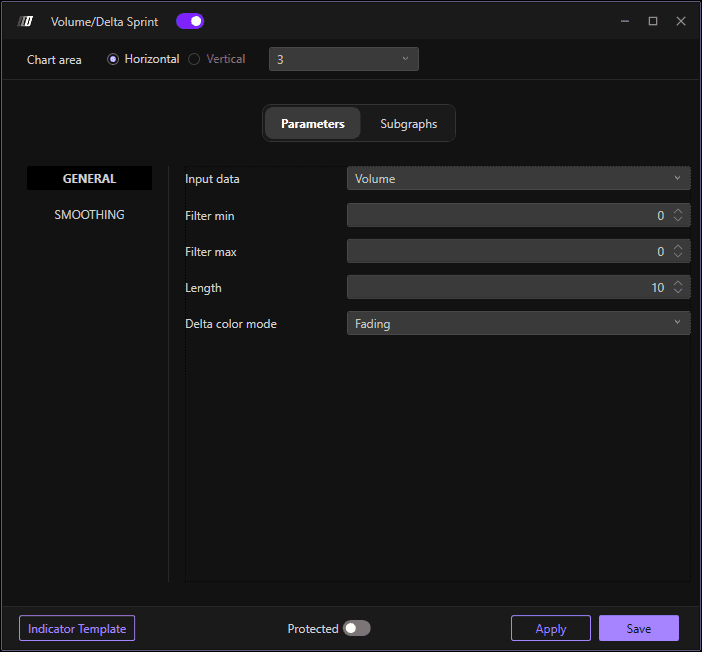
Input Data
Defines the type of data used for the sprint calculation. The available options are:
Volume: Uses total traded volume, showing overall trading activity regardless of direction.
Order: Uses order flow data, tracking actual orders placed in the market.
Trade: Uses executed trades data, focusing on completed transactions.
Filter Min
Sets the minimum threshold value for filtering the data. Values below this threshold will be excluded from the calculation, helping to remove noise and focus on significant volume or delta movements.
Filter Max
Sets the maximum threshold value for filtering the data. Values above this threshold will be excluded from the calculation, helping to remove outliers or abnormal spikes that could distort the analysis.
Length
Defines the time period or number of bars over which the volume/delta sprint is calculated. The default value is 10. This parameter determines how far back the indicator looks to accumulate volume or delta values. Shorter lengths provide more responsive, real-time sprint values, while longer lengths smooth out the data and show broader accumulation patterns.
Delta Color Mode
Determines how the histogram bars are colored based on delta values. The available options are:
Fading: Colors gradually fade or transition based on the magnitude of delta values, providing a visual gradient that shows the intensity of buying or selling pressure.
Fixed: Uses fixed colors for positive and negative delta values without gradual transitions, providing clear binary distinction between buying and selling pressure.
Smoothing Settings
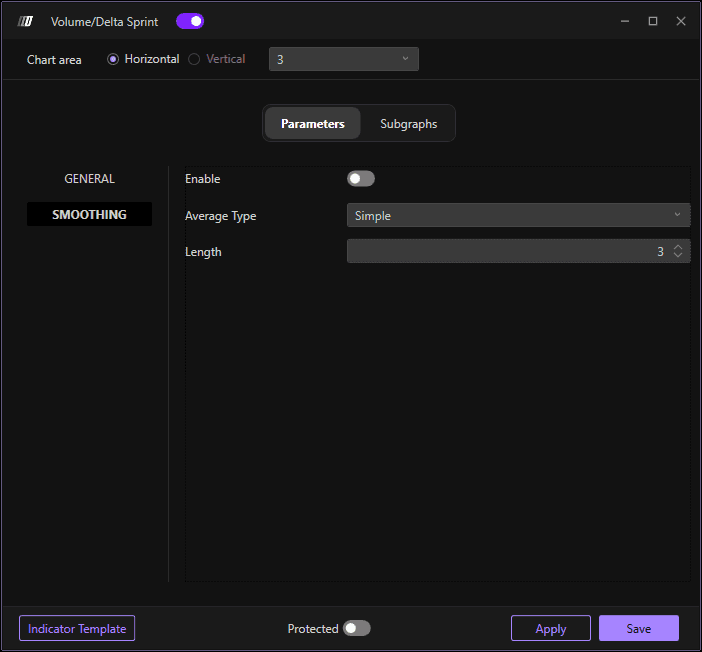
Enable
When enabled, applies smoothing to the volume/delta sprint data to reduce noise and make trends more apparent. Smoothing helps filter out short-term fluctuations and provides a clearer picture of underlying volume accumulation patterns.
Average Type
Defines the type of moving average used for smoothing. The available options are:
Simple: Simple Moving Average (SMA), giving equal weight to all values in the period.
Exponential: Exponential Moving Average (EMA), giving more weight to recent values for faster response to changes.
Triangular: Triangular Moving Average, which applies double smoothing for even smoother results.
Weighted: Weighted Moving Average (WMA), giving progressively more weight to recent values.
Length
Sets the period length for the smoothing calculation. This determines how many bars are included in the moving average calculation. Higher values create smoother lines with less sensitivity to recent changes, while lower values maintain more responsiveness to current data.
Subgraphs
Color
Sets the primary color for the histogram bars when delta values are positive or when using the primary color scheme. This represents buying pressure or positive volume accumulation.
2° Color
Sets the secondary color for the histogram bars when delta values are negative. This represents selling pressure or negative volume accumulation.
Subgraph Style
Defines how the volume/delta sprint data is displayed. The default is "Bars" which shows the data as a histogram with vertical bars, making it easy to compare volume accumulation across different time periods.
Auto Color
Determines the automatic coloring logic for the histogram bars. Set to "+/-" to automatically color bars based on whether values are positive or negative, providing instant visual feedback on buying vs. selling pressure.
Line Style
Sets the style of the histogram bars. The default is "Solid" for filled bars, which clearly shows the volume magnitude for each period.
Line Width
Adjusts the width of the histogram bars. The default value is 3. Wider bars make the volume data more prominent and easier to read, while narrower bars allow for more compact display when analyzing multiple time periods.
Short Name
Allows you to set a custom short name or label for the indicator that will appear on the chart legend. This is useful for distinguishing between multiple volume indicators or when running the same indicator with different parameters.