Deep Indicators
Updated:
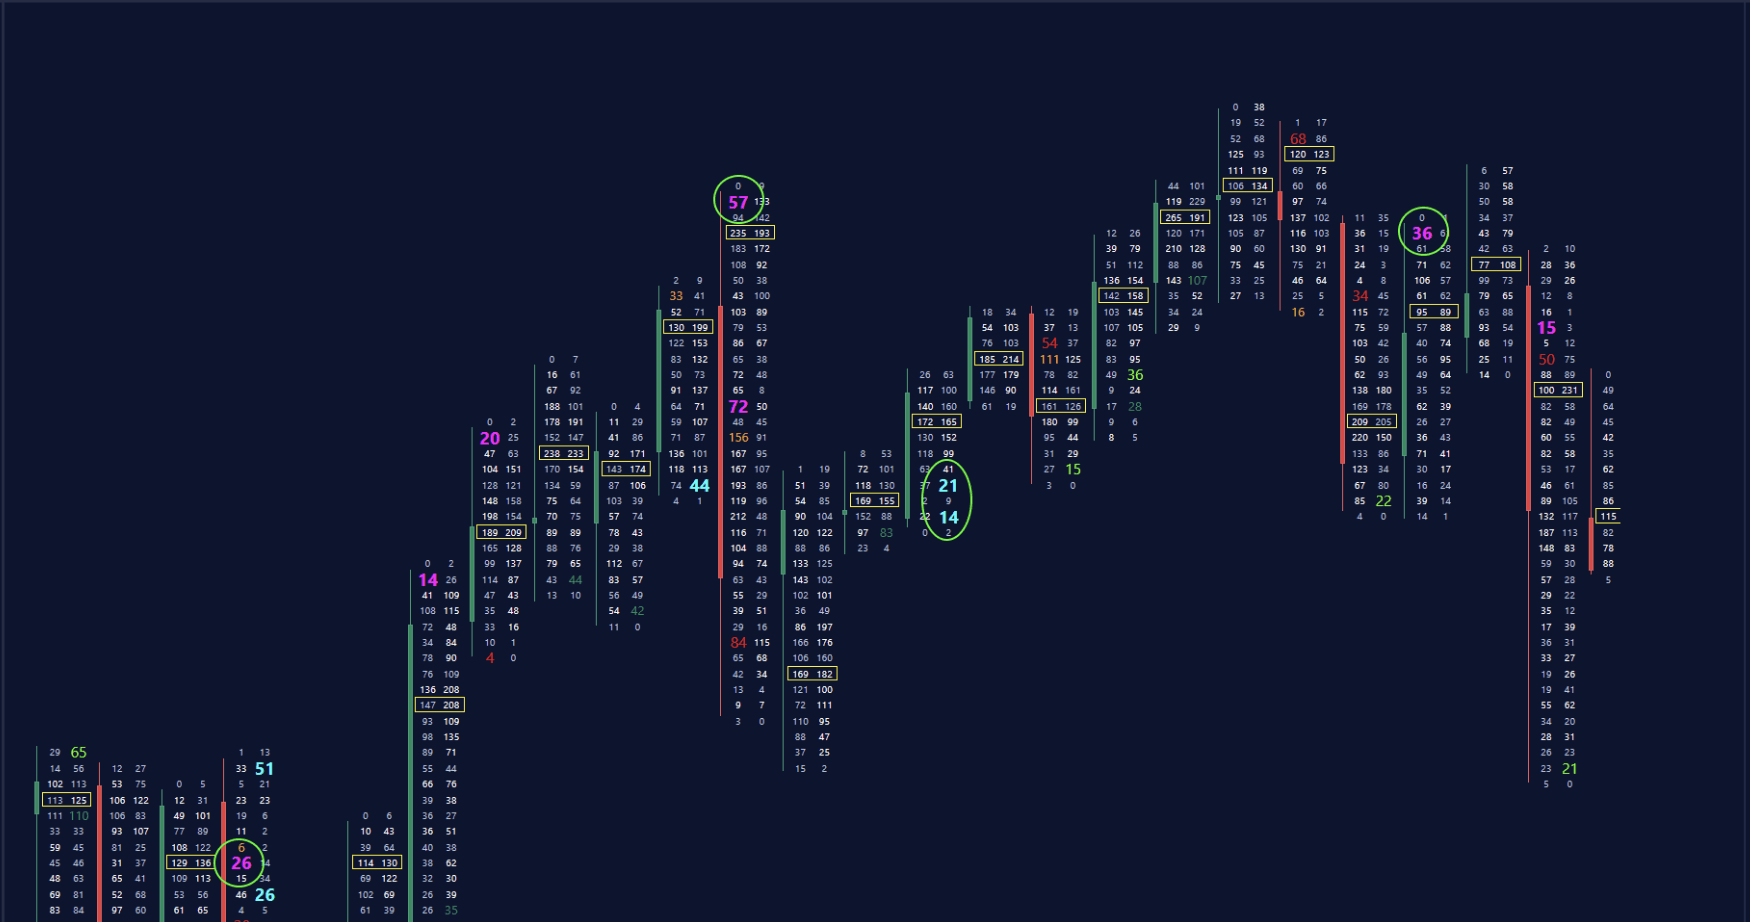
The Deep Print indicator from DeepChart, also known as Footprint®, is a core tool for volumetric and order flow analysis.
It combines price, volume, and order flow into a single candle, enabling the identification of:
Buyer and seller acceleration
Absorption and depletion
Bid/Ask dominance at each price tick
The indicator is fully customizable, allowing you to display:
Total Volume
Delta
Bid/Ask volume
Dynamic background and text coloring based on Delta or Imbalance
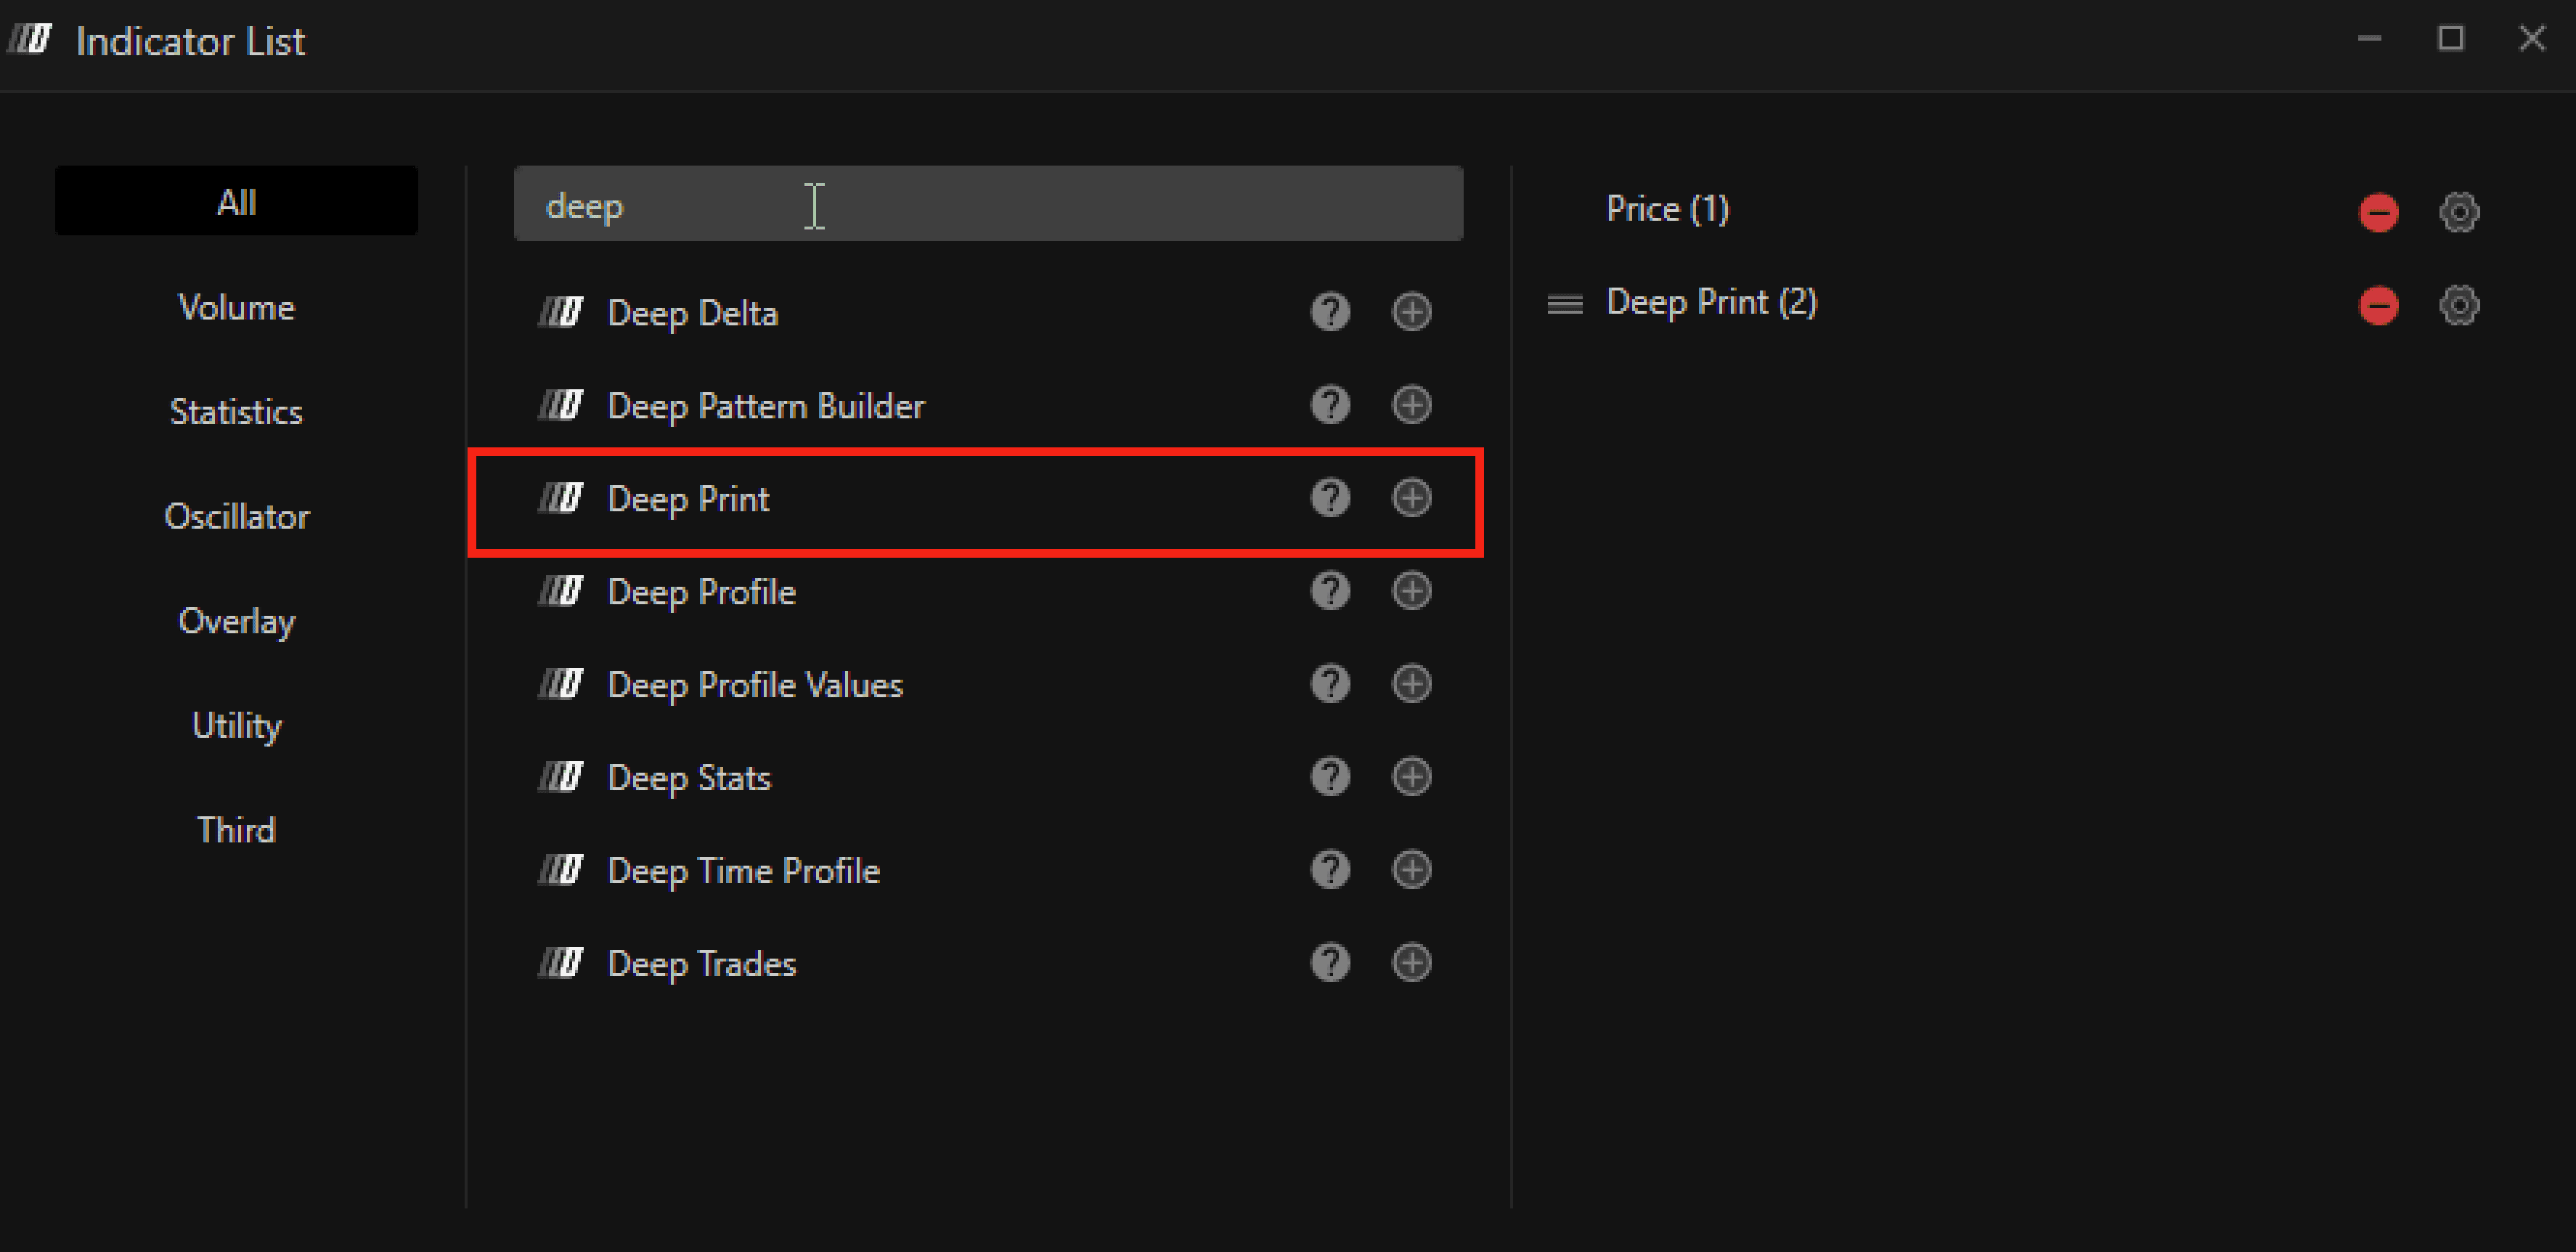
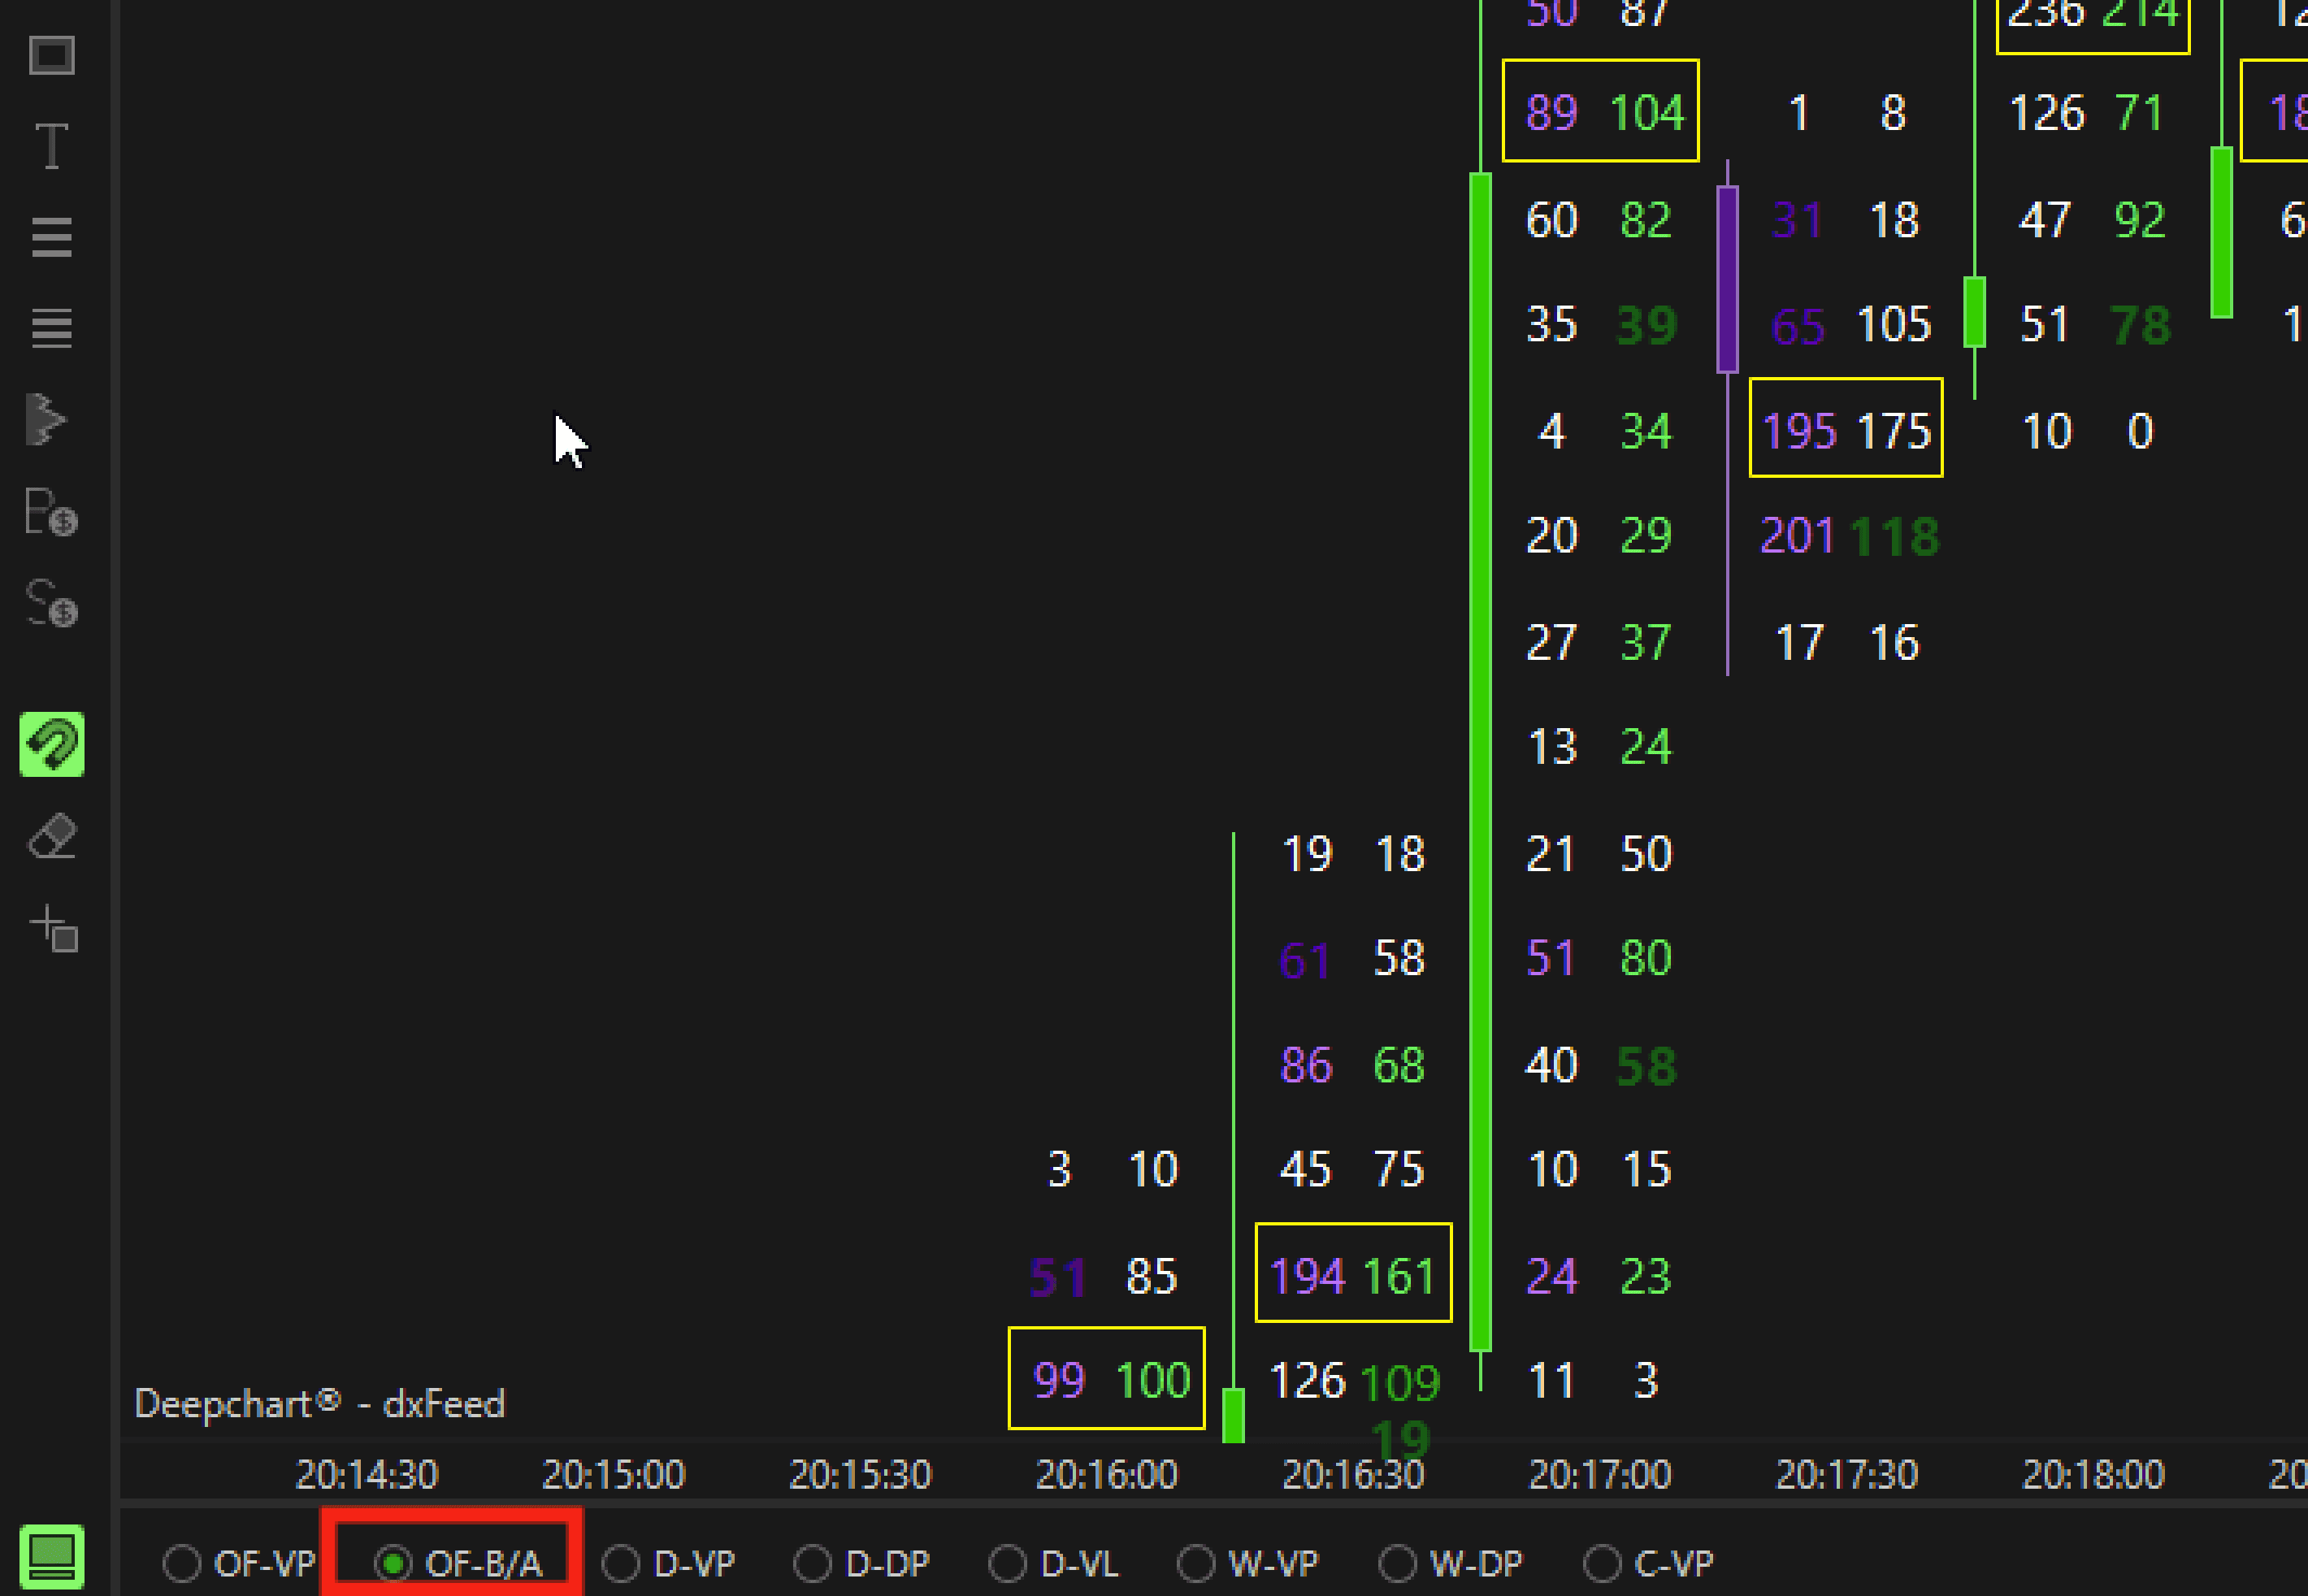
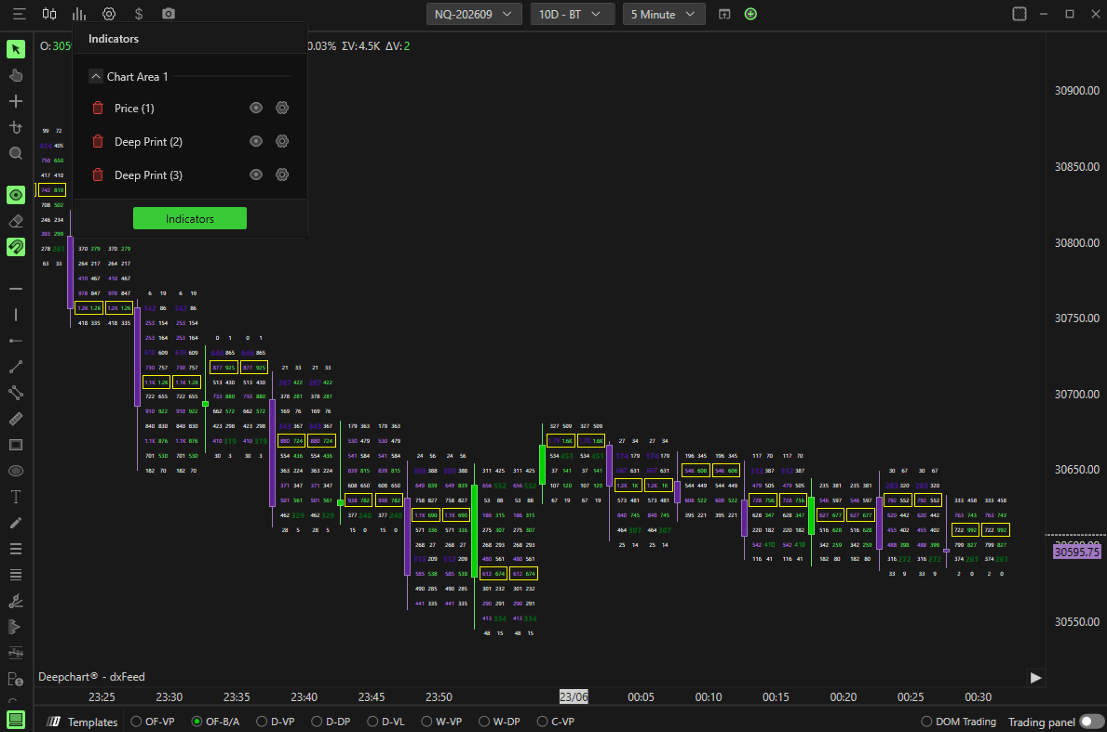
You can plot the indicator from the indicator list or from the bottom navigation bar button as showing in images below
Settings
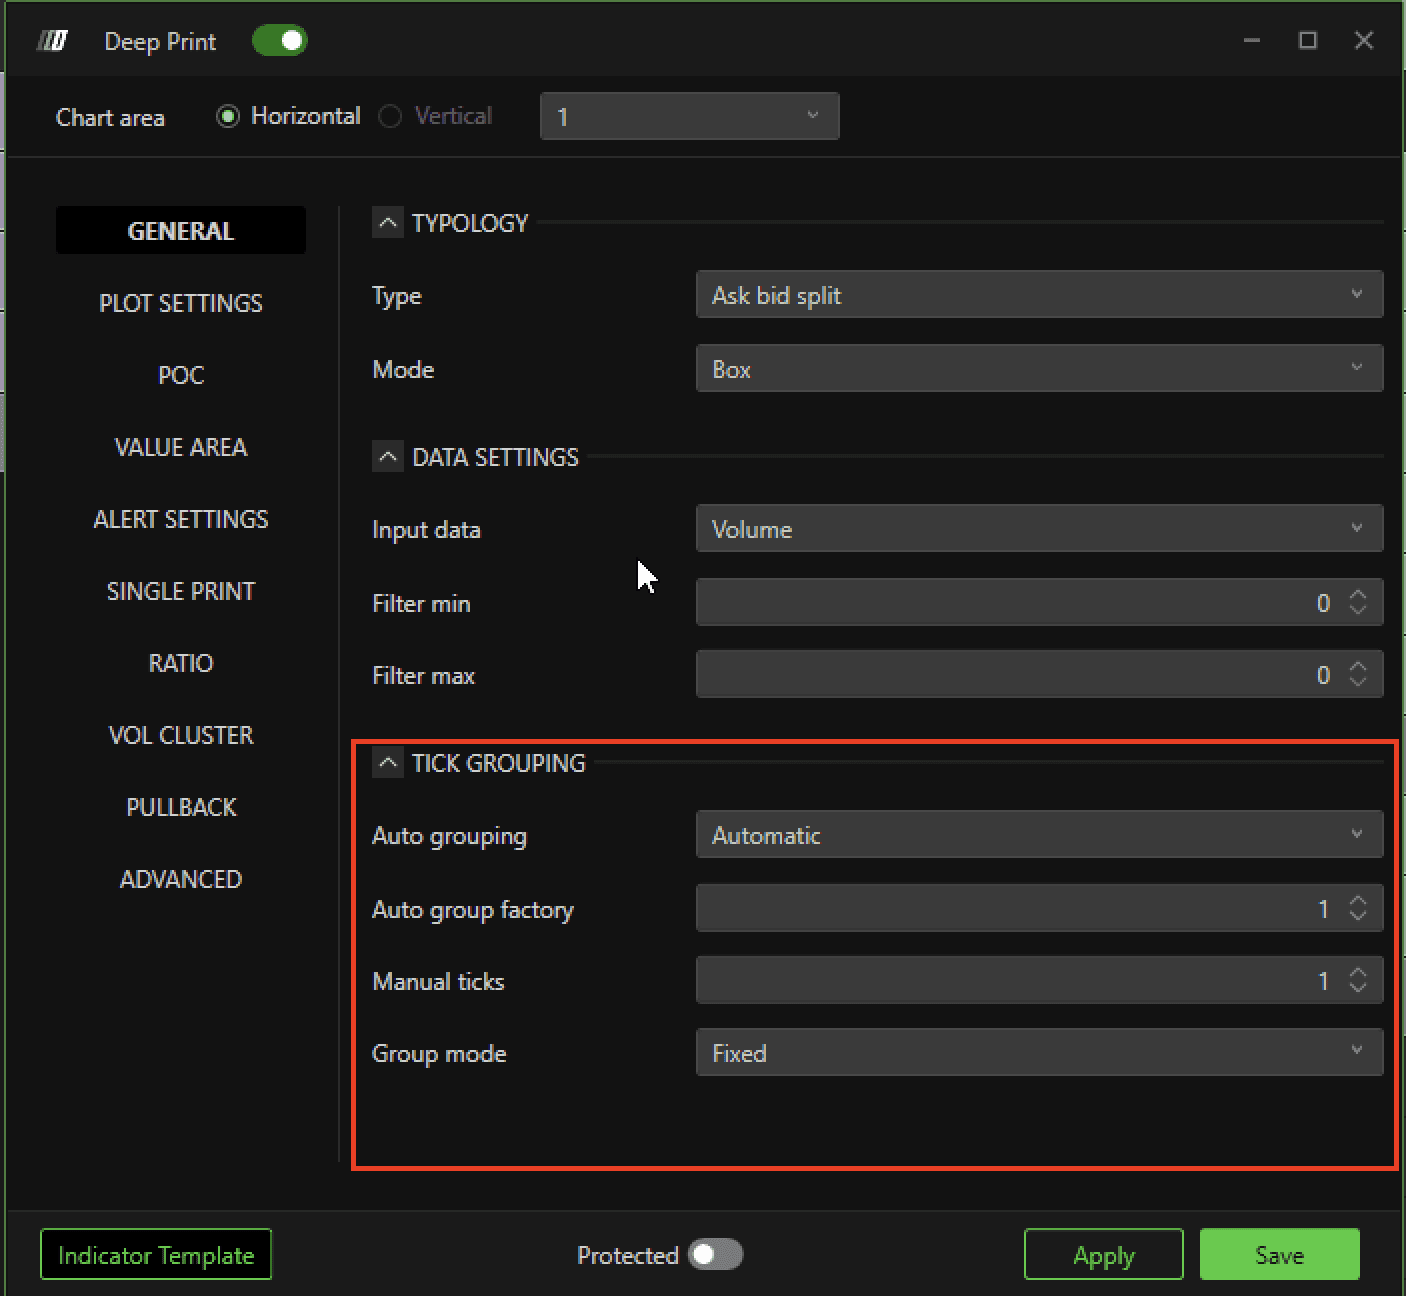
General
Typology
Type:
Defines the data shown inside each footprint cell:
Volume – Total traded volume
Ask/Bid Split – Buy vs Sell volume
Delta – Difference between Ask and Bid
Delta + Total Volume – Combined view
Mode:
Defines how data is rendered:
Profile – Histogram-style representation
Box – Compact boxed values
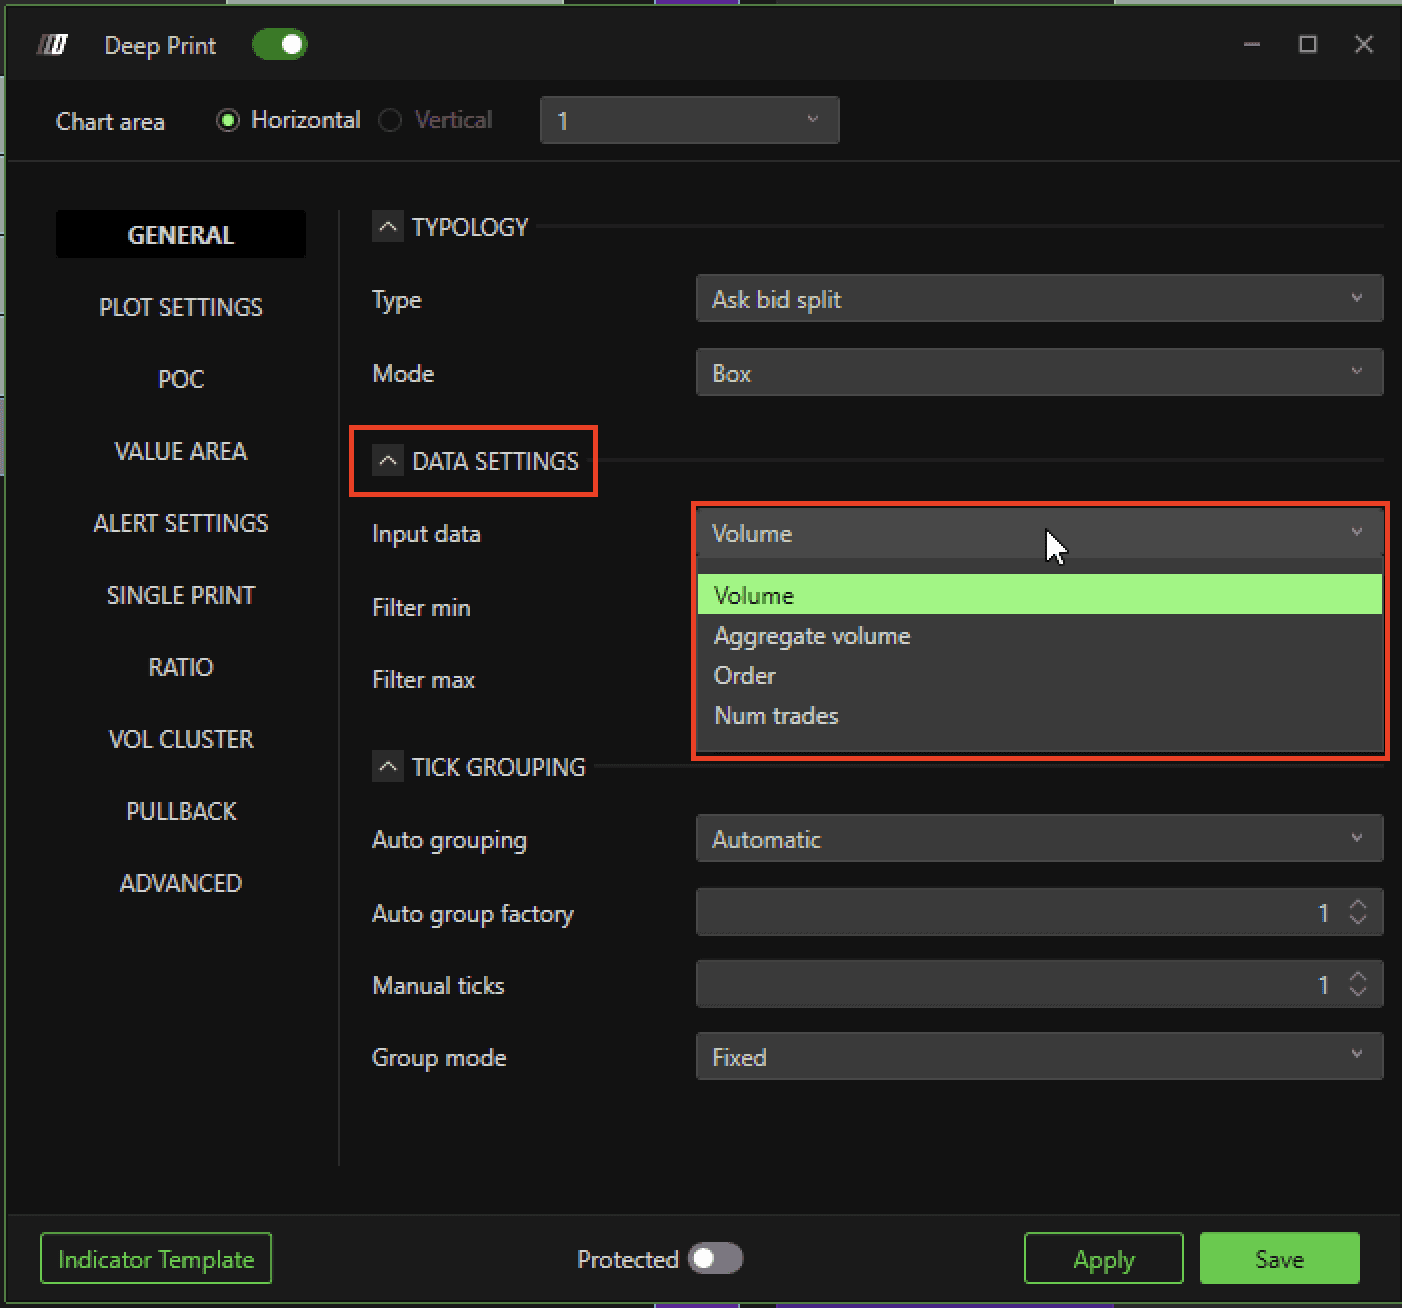
Data Settings
Input Type (Data Source)
Defines the data used for calculations:
Volume – Total traded volume per price
Aggregate Volume – Aggregated trades
Order – Order book volume
Num Trades – Number of executions per price
Min / Max Filter
Filters out values outside a defined range to reduce noise and highlight significant activity.
Tick Grouping
Auto Grouping
Automatic – Platform optimizes grouping
Manual – User defines grouping
Auto Group Factor
Controls the level of tick aggregation.
Manual Ticks
Defines how many ticks are grouped manually.
Group Mode
Fixed – Constant grouping
Based on Open/Close – Dynamic grouping based on candle behavior
Plot Setting
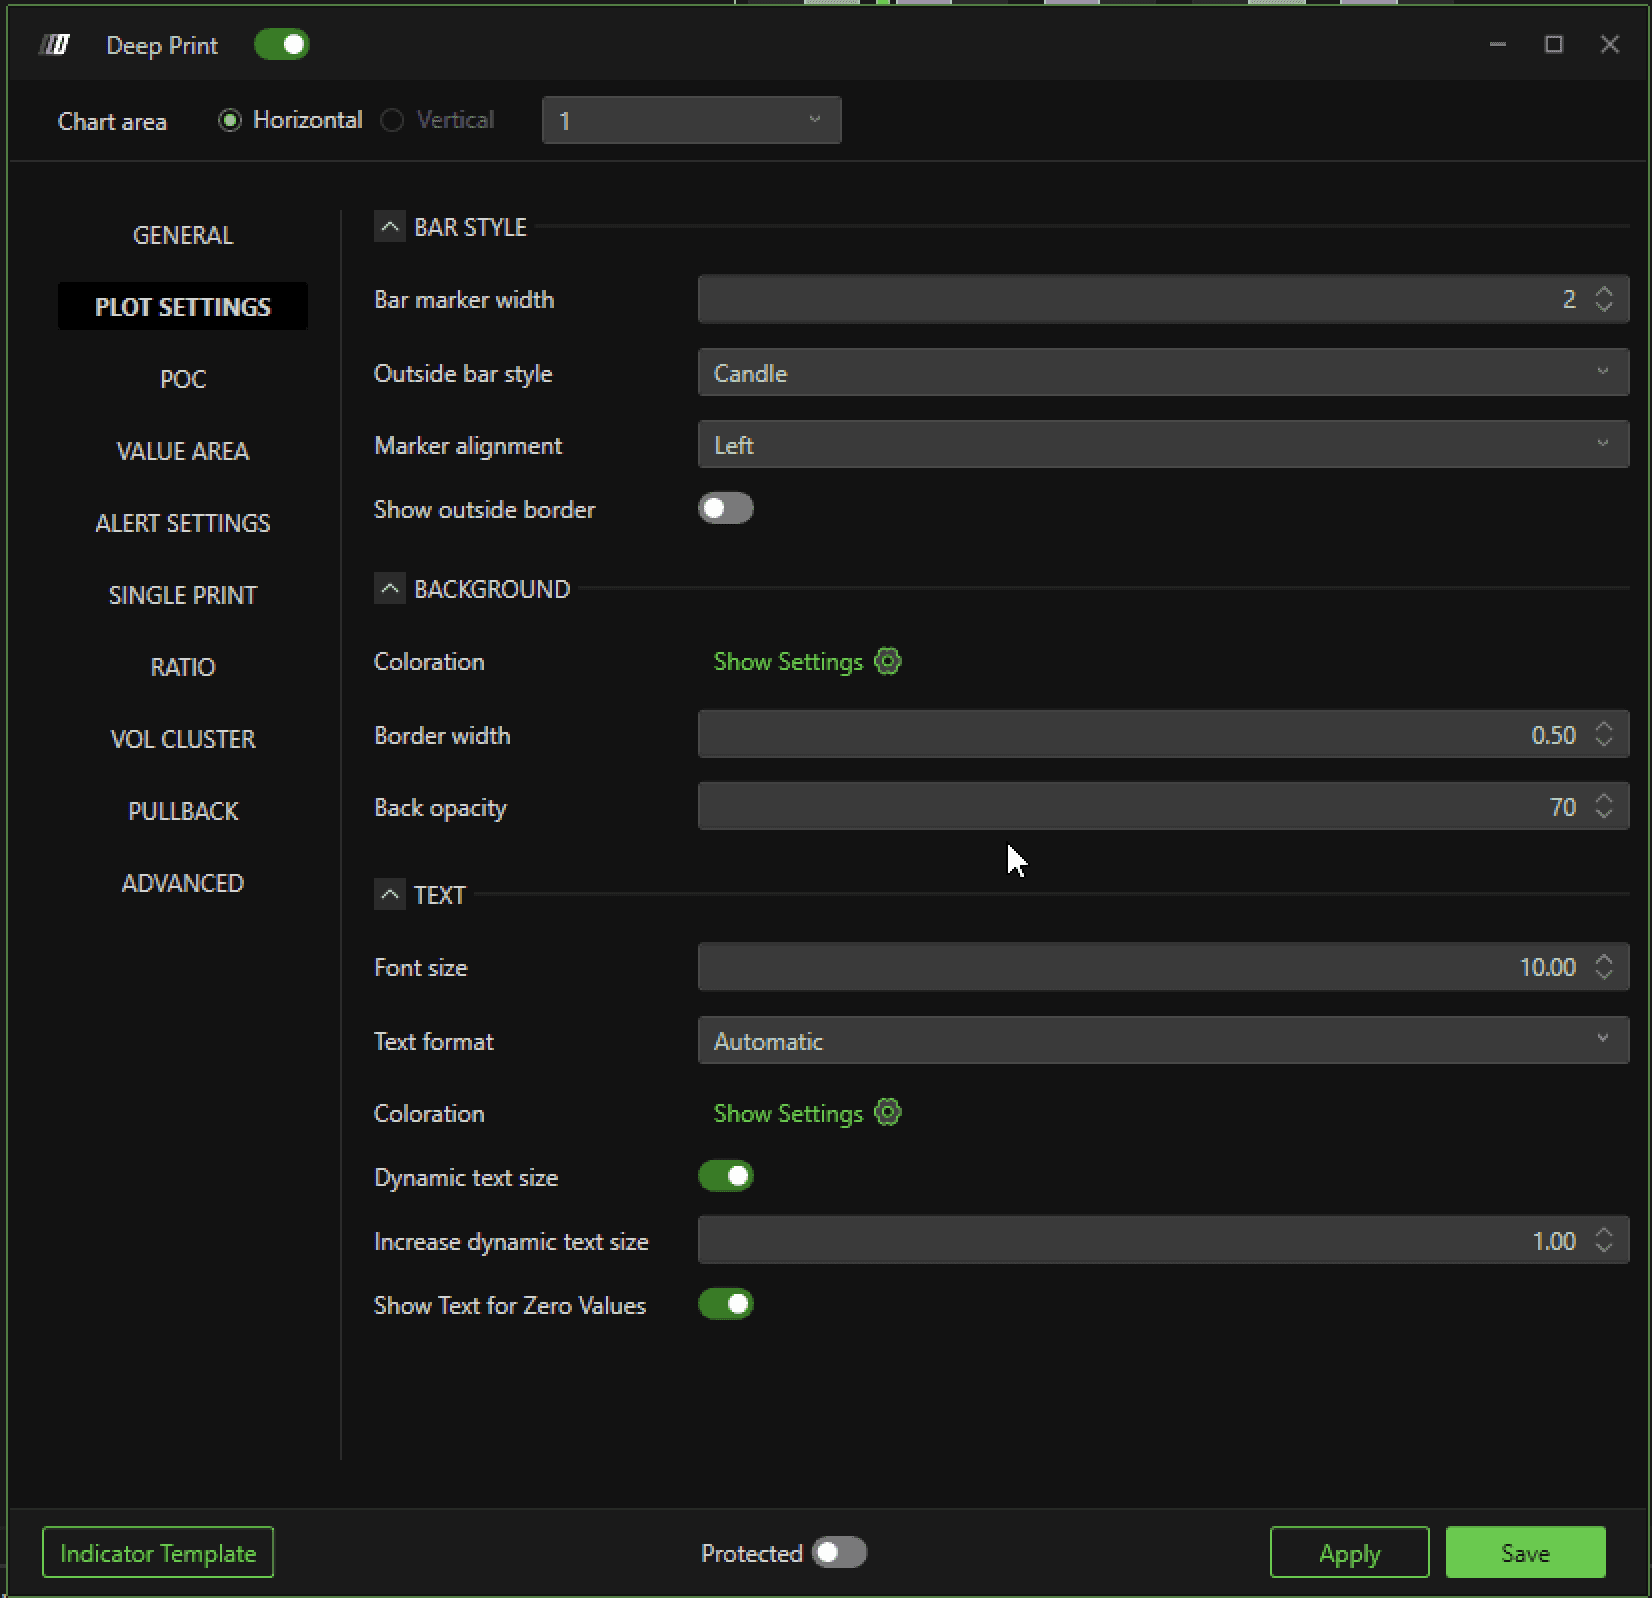
Bar Style
Bar Marker Width – Indicates the thickness of the candle.
OutSide Bar Style – Ability to choose between the Bar or Body style. In Bar Style the candle is shown with its shadow, in Body Style the candle is shown with just the body.
Marker Alignment –Defines the position of the Marker in the right or center position of the bar.
Outer Edge Mode –Traces a border on the outside creating an outline of the candle body.
Background
Coloration :
This section allows you to customize the coloration and visual representation of the footprint data for better interpretation of the volume delta, and market imbalances. Through different coloring modes and adjustment options, you can tailor the visualization to your preferences to facilitate orderflow analysis and quickly identify key areas of activity.
2.Border Width –The edge thicknesses of the volume profile or box, per pixel.
3.Opacity –The level of transparency of the background of the profile or box.
Text
Font Size:
Size of text within the footprint cell.Text Format:
Lets you choose how to display numerical values within the graph to improve readability and tailor the format to your preferences. The available options are
Automatic: The text format is automatically adapted according to the context and amount of data displayed, making it easier to read without requiring further intervention.
Normal: Values are displayed in their full format, without abbreviations. This is useful for those who prefer to have a more detailed view of numbers without any form of compression.
K (thousands): Numeric values are abbreviated using "K" to represent thousands (e.g., 1K for 1,000). This mode is useful to reduce the visual clutter and make the graph more readable when there is a lot of data.
Coloration: This section allows the user to customize the coloring and numerical representation of the footprint data for better interpretation of volume, delta, and market imbalances. Through different coloring modes and adjustment options, you can tailor the visualization to your preferences to facilitate orderflow analysis and quickly identify key areas of activity.
Dynamic Text Size: Automatically adjusts the size of the text within the chart, adapting it based on the amount of volume, delta, or imbalance displayed. When large amounts are detected, the text size increases proportionally to visually highlight these significant areas. This dynamic behavior allows you to quickly recognize the points of greatest activity on the chart, improving readability and making critical information easier to spot during order flow analysis.
Increase Dynamic Text Size: Increase Dynamic Text Size parameter.
Show Texts-by-Zeros: Show the Zero Value within the footprint/profile.
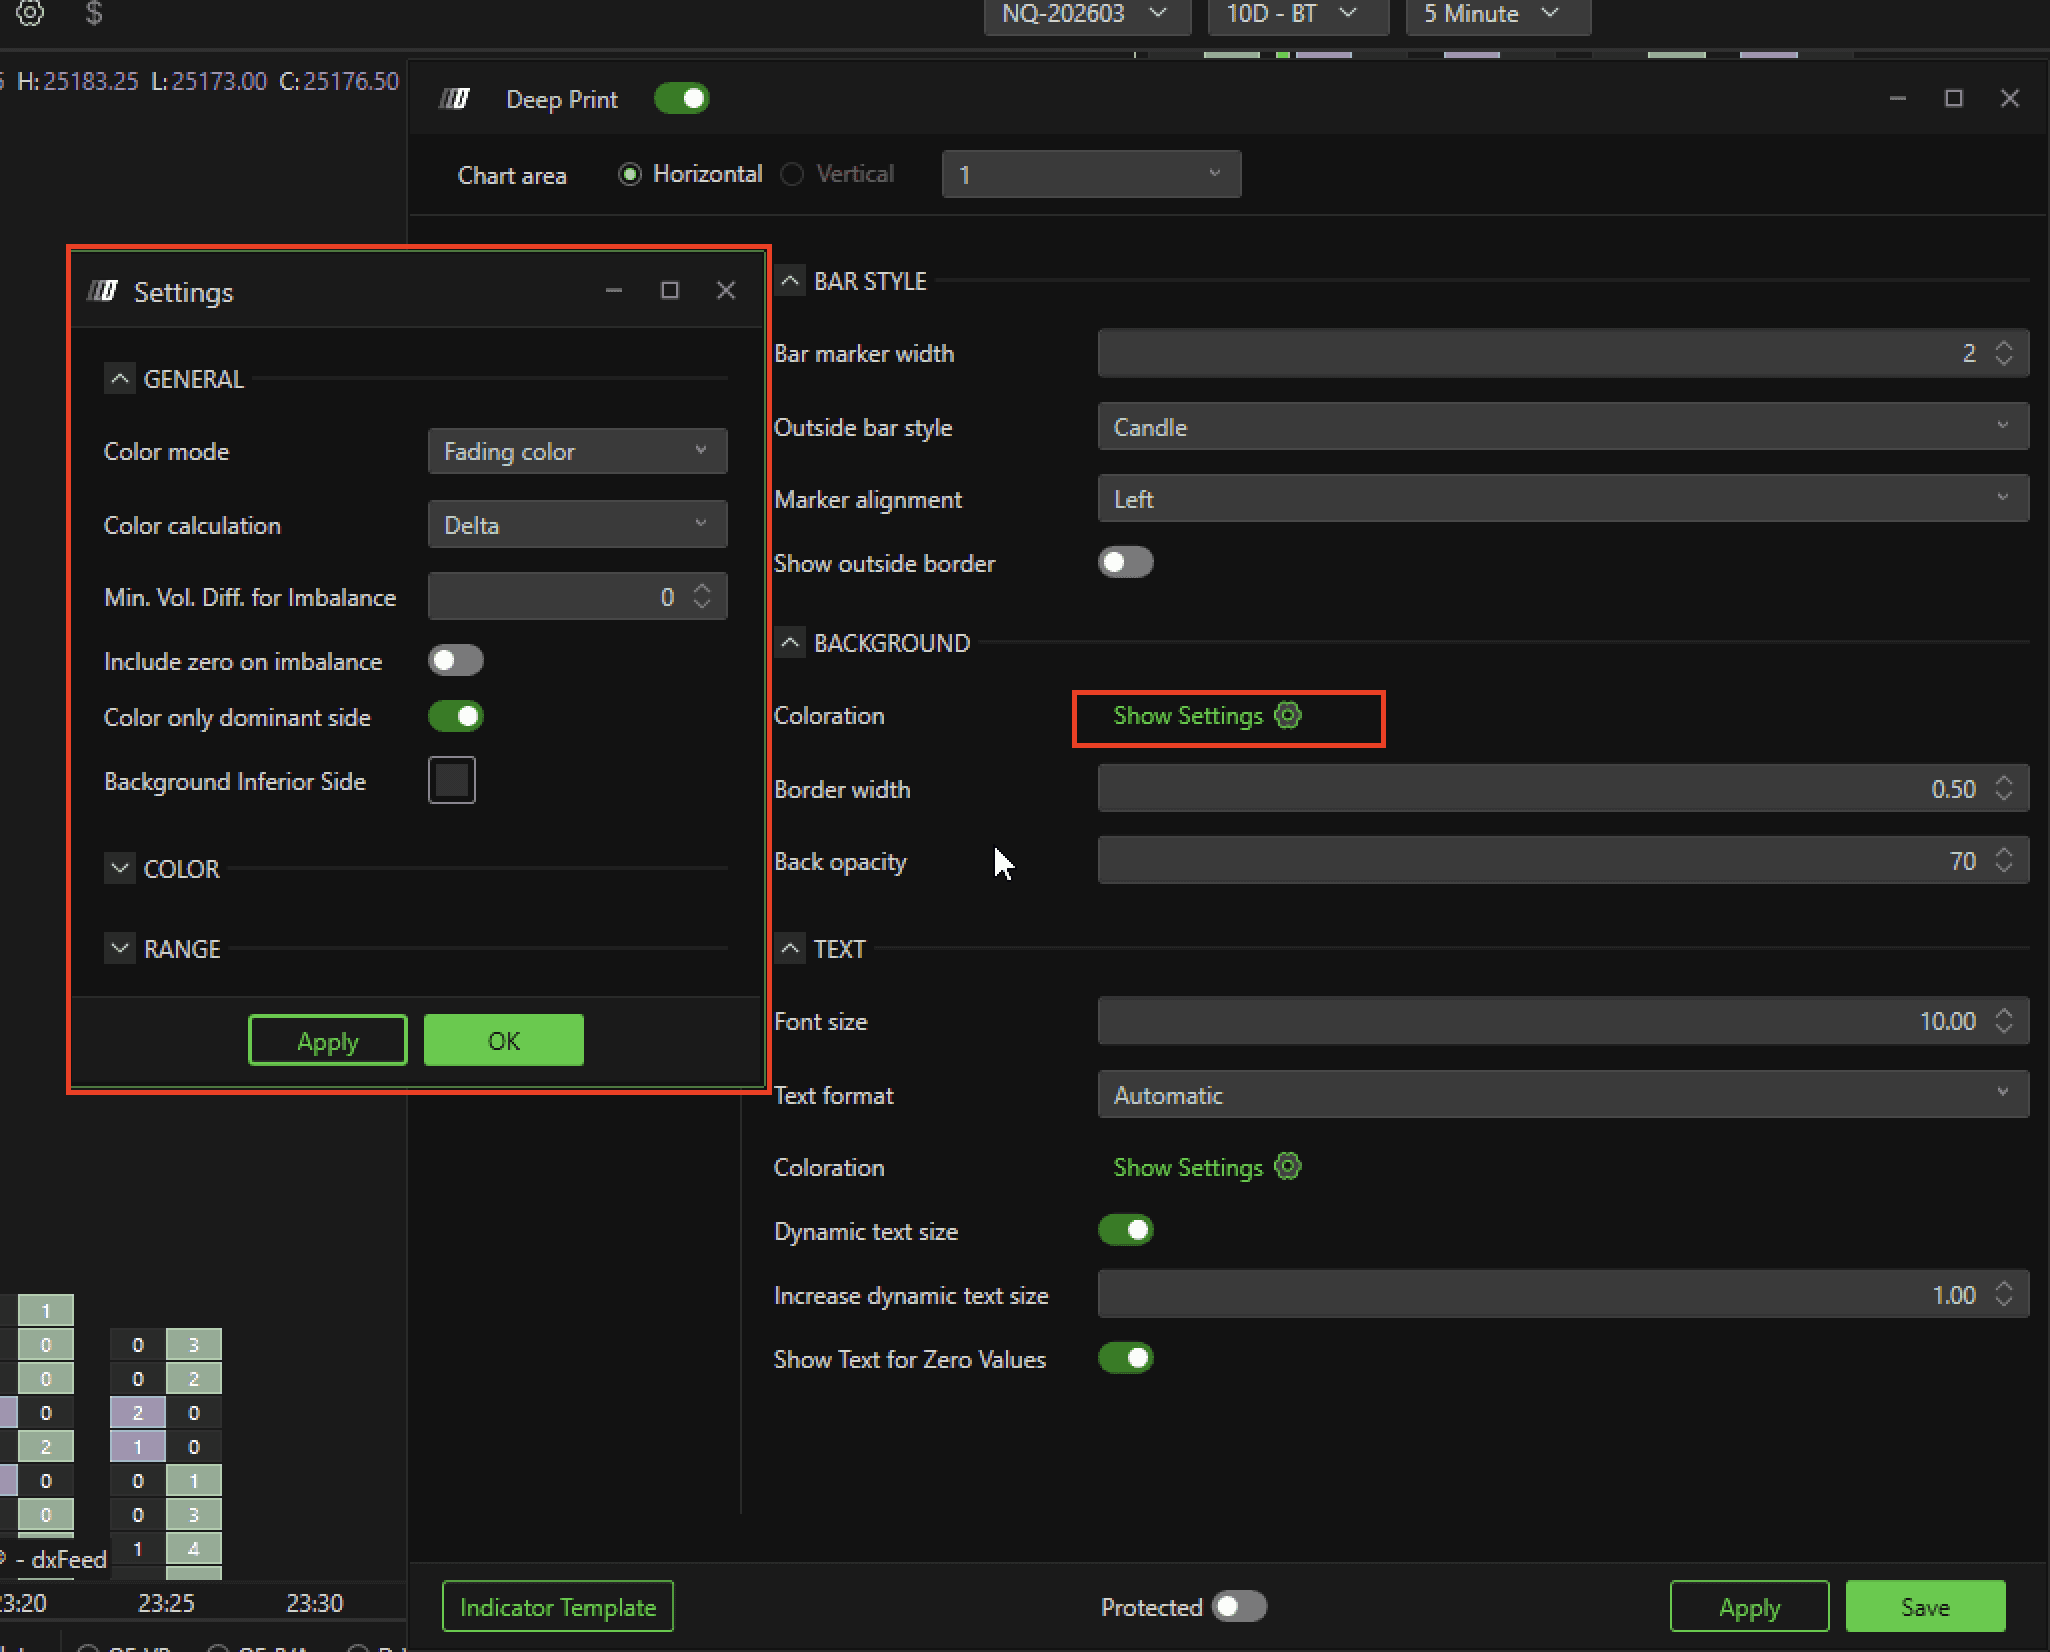
Set Background Coloration
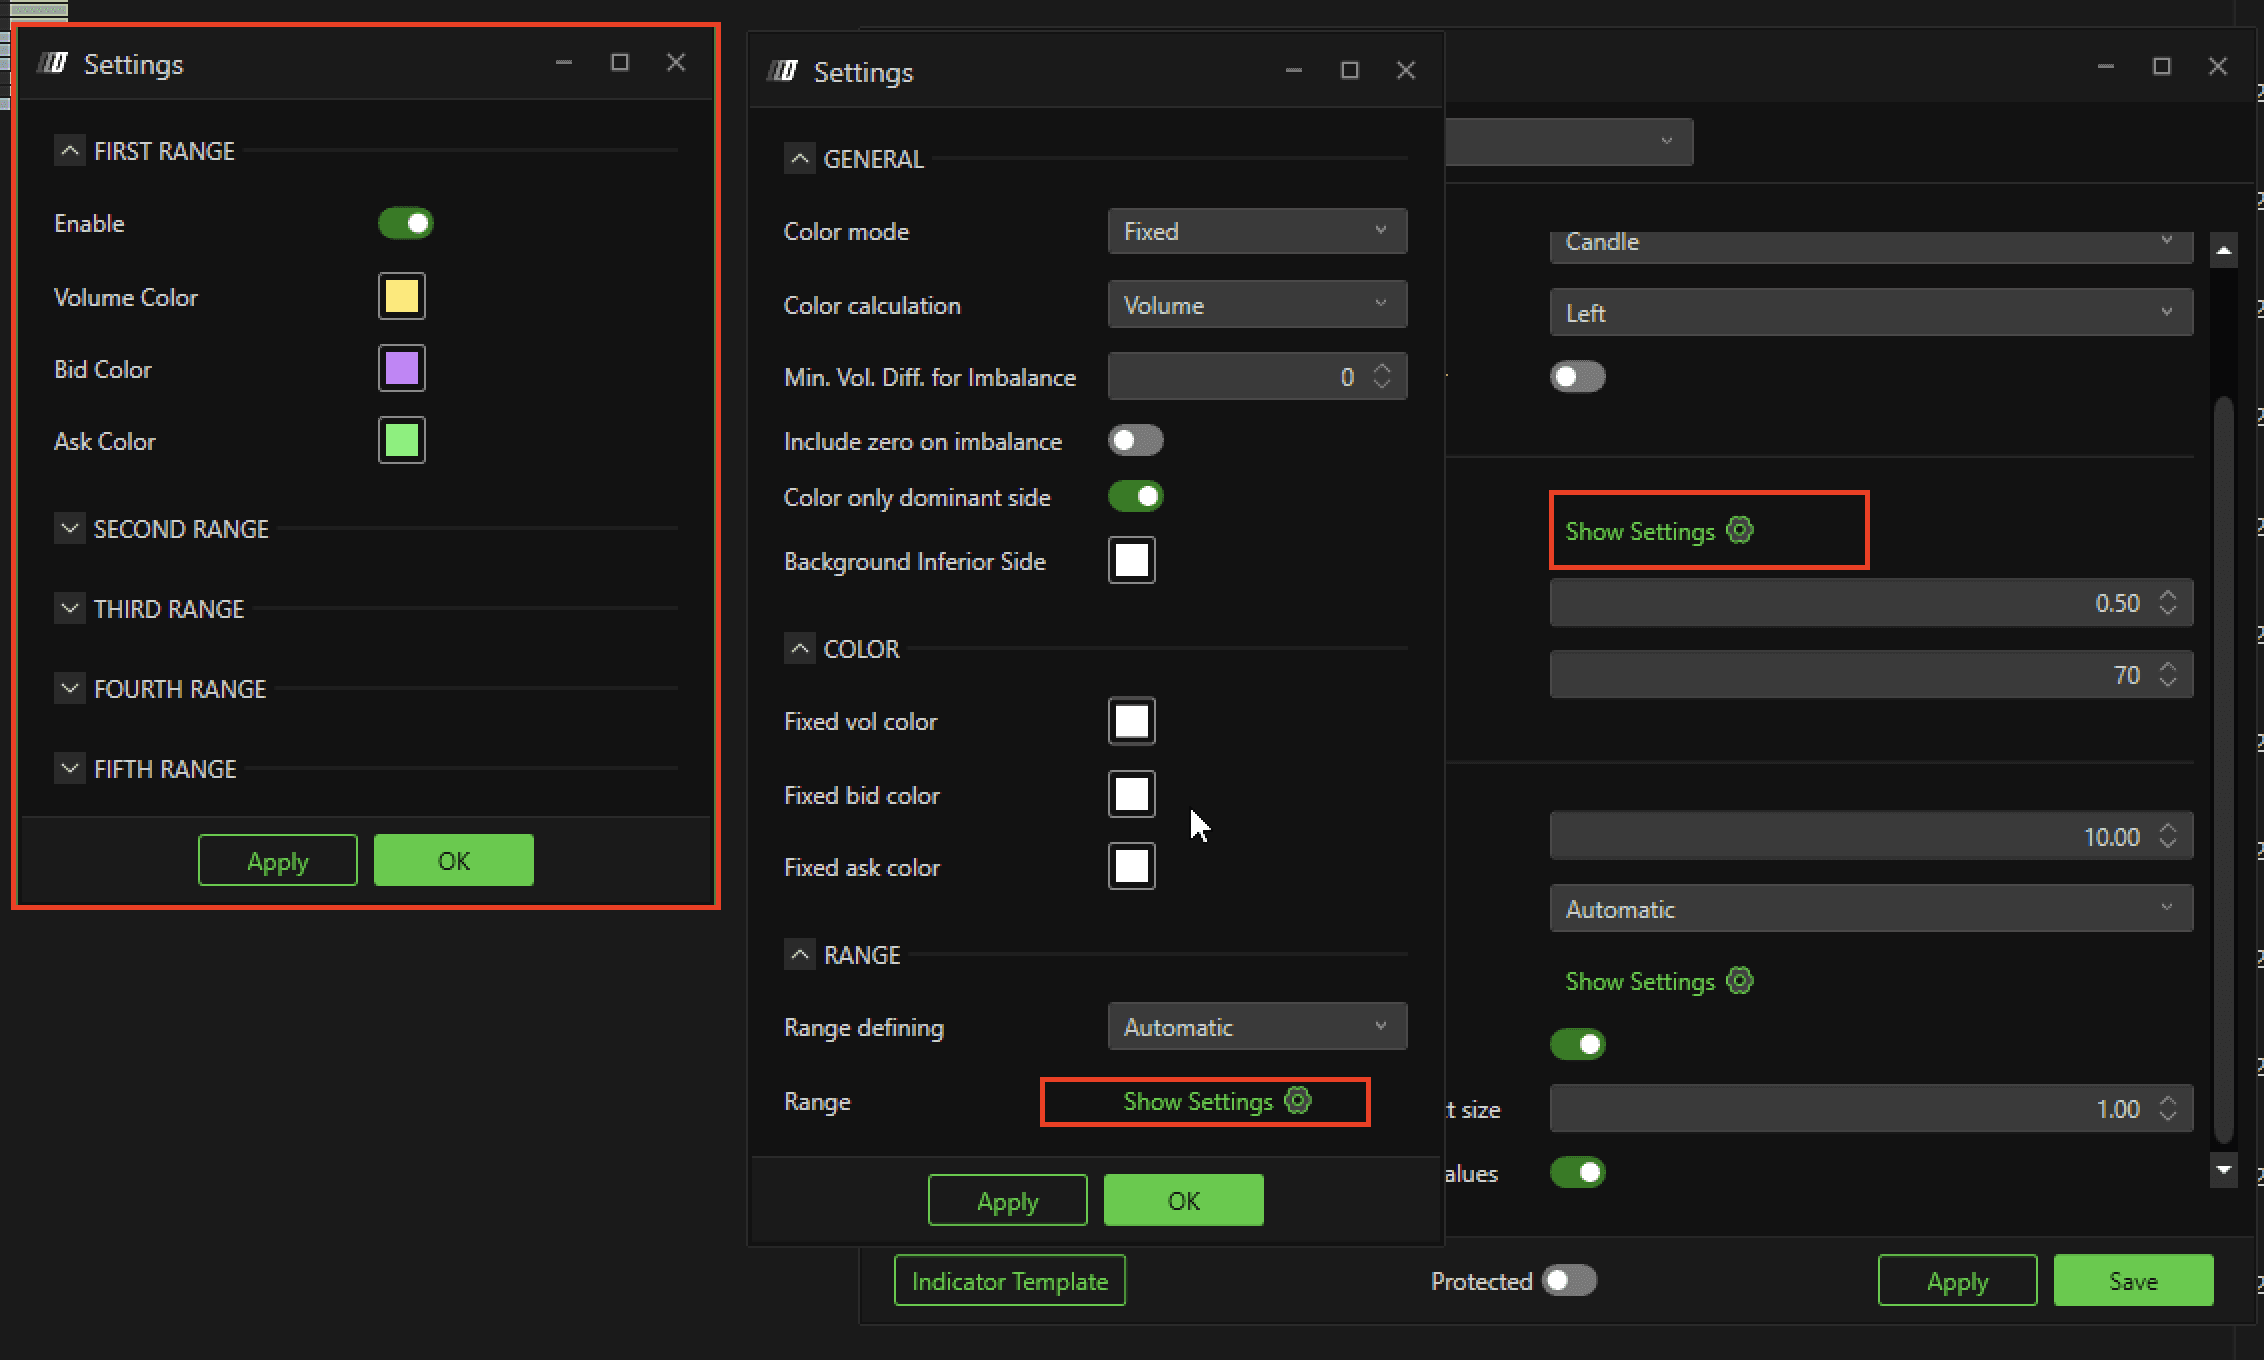
Color Mode
None
No coloring is applied. The entire footprint appears without highlighting any particular areas.Fixed
Predefined colors are used to represent the data, without gradients or variations, e.g. green bid, red ask.Fading
A fading effect is applied to represent changes in volume, delta or imbalance, allowing a more intuitive view of differences.More Colors
This mode allows you to customize a variety of colors to distinguish volumes and orderflow in more detail, which is useful for those who wish to highlight multiple types of data. You can do this by setting the Range Definition to USER, and then clicking on "Open Settings."
Color Calculation
Volume
Colors the footprint based on the total volume of trades for each level.Delta
Use the value of delta (difference between buying and selling volumes) for coloring. The higher the delta, the greater the intensity of the coloring.Imbalance
Shows an imbalance between the bid and ask side, highlighting areas where there is a significant imbalance between buy and sell orders.Dominant Volume
Highlights the largest volume (bid or ask) present at each price level.Dominant Volume Delta
A combination of the dominant volume with the delta, to highlight areas with greater difference between buy and sell volumes.
MIn. Vol. Diff. For Imbalance
This parameter defines the minimum volume threshold required to consider a significant difference between bid and ask as "imbalance." The higher the value, the more obvious the difference between the two sides must be in order to be highlighted.
Include Zero on Imbalance
If enabled, it also includes price levels where there is no volume on either side (bid or ask) in the imbalance analysis, providing a clearer indication of imbalances where there is no trading.
Color Only Dominant Side
When activated, it colors only the side that has the dominant volume (e.g., if the bids are greater than the asks, only the bids will be colored). This helps to focus only on the most significant part of the order flow.
Background Inferior Side
It allows you to set the background color of the non-dominant part of the footprint.
Color
Fixed-Volume Color:
Lets you define a fixed color for the entire volume shown.
Fixed-Bid Color:
Specifies the color for the volume of bids (purchases).
Fixed-Ask Color:
Specifies the color for the volume of asks (sales).
This section is useful for customizing the display to suit your taste or to make the data easier to read.
Section Range
Range
Range Definition
It allows you to define how to determine the ranges of values that will be represented through colors. It can be set to "Automatic" defined by the platform, or in a custom range in the user mode.
Range (Show Settings)
This option opens additional settings to define the range of custom values.
POC (Point of Control)
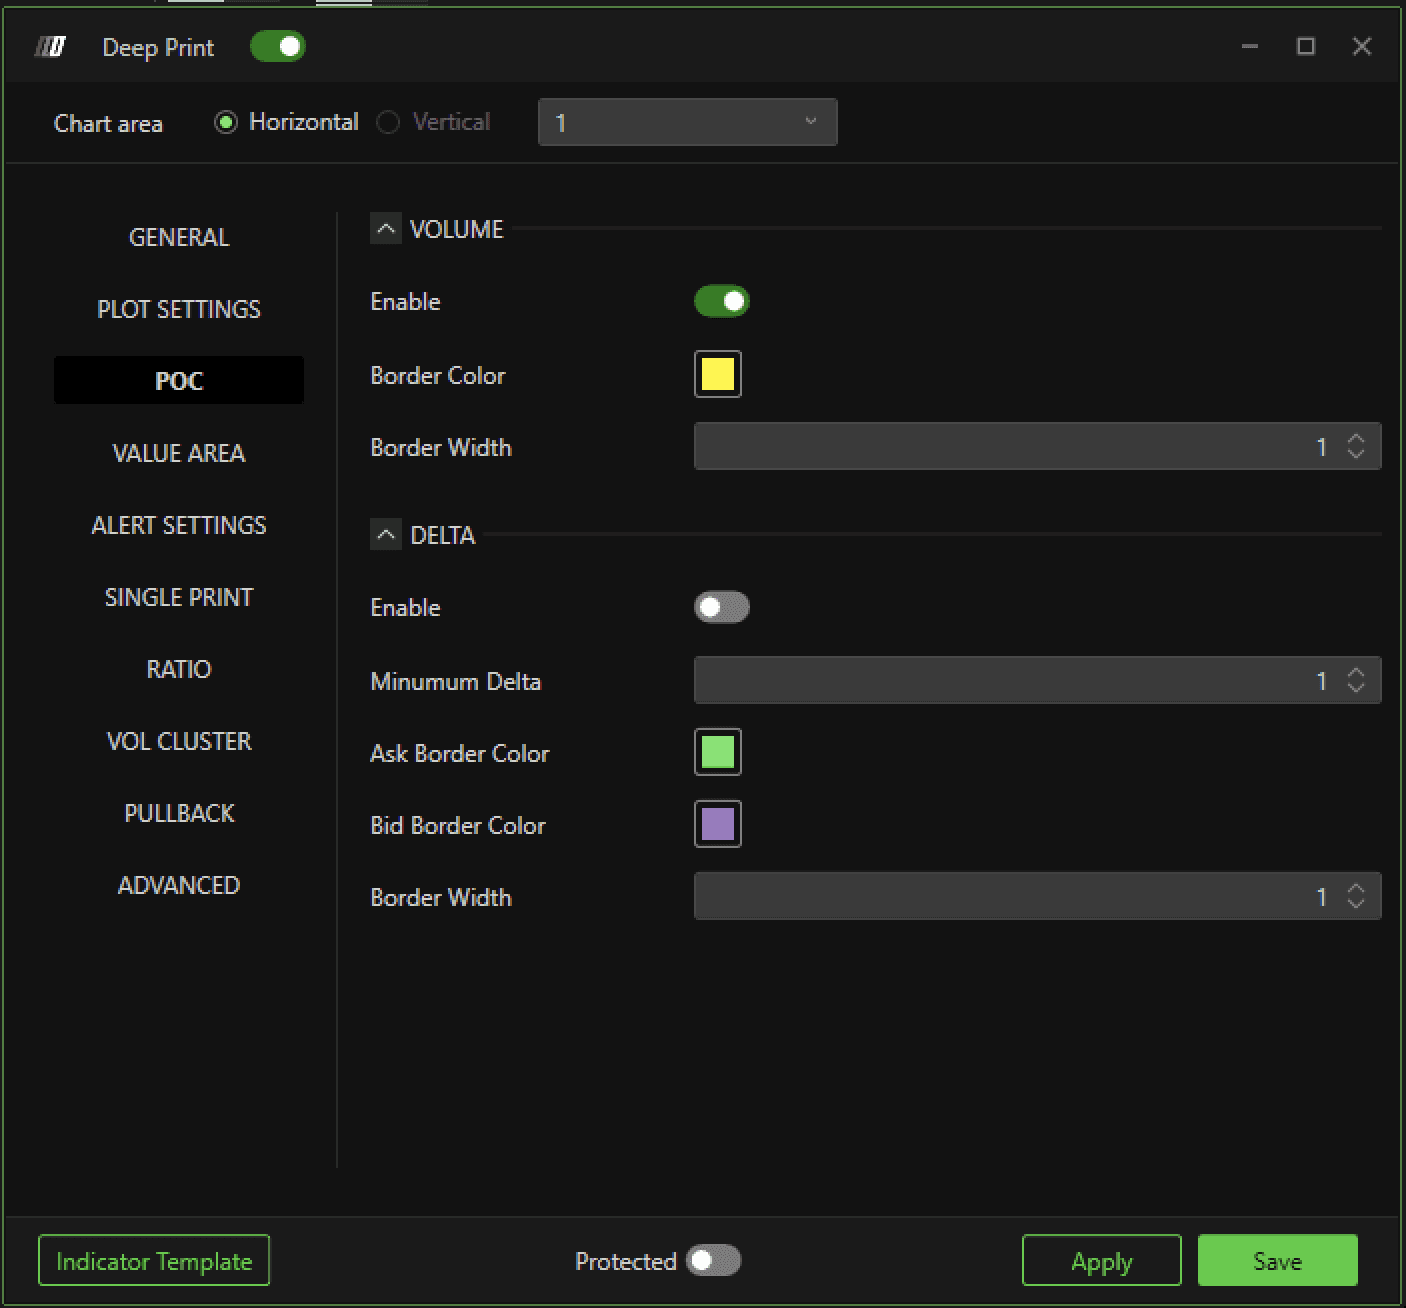
Enable (Volume POC)
Enable or disable the Point of Control (POC) display for volume. The POC represents the price level with the highest volume within the bar.
Border Color (Volume POC)
Allows you to select the border color to highlight the volume POC. A custom color helps to easily distinguish the POC from other price levels in the Order Flow Analyzer.
Border Width (Volume POC)
Defines the edge thickness for displaying the volume POC. A greater thickness can make the POC more prominent.
Enable (Delta POC)
Enables or disables the display of the delta POC. The delta POC identifies the price level with the largest net difference between buy and sell orders.
Minimum Delta (Delta POC)
Sets the minimum delta value required for the delta POC to be displayed.
Ask Border Color (Delta POC)
Defines the border color for the "Ask" side of the Delta POC.
Bid Border Color (Delta POC)
Defines the border color for the "Bid" side of the Delta POC delta.
Border Width (Delta POC)
Defines the border thickness for the delta POC display. Increasing the edge thickness makes the delta POC more prominent.
Value Area
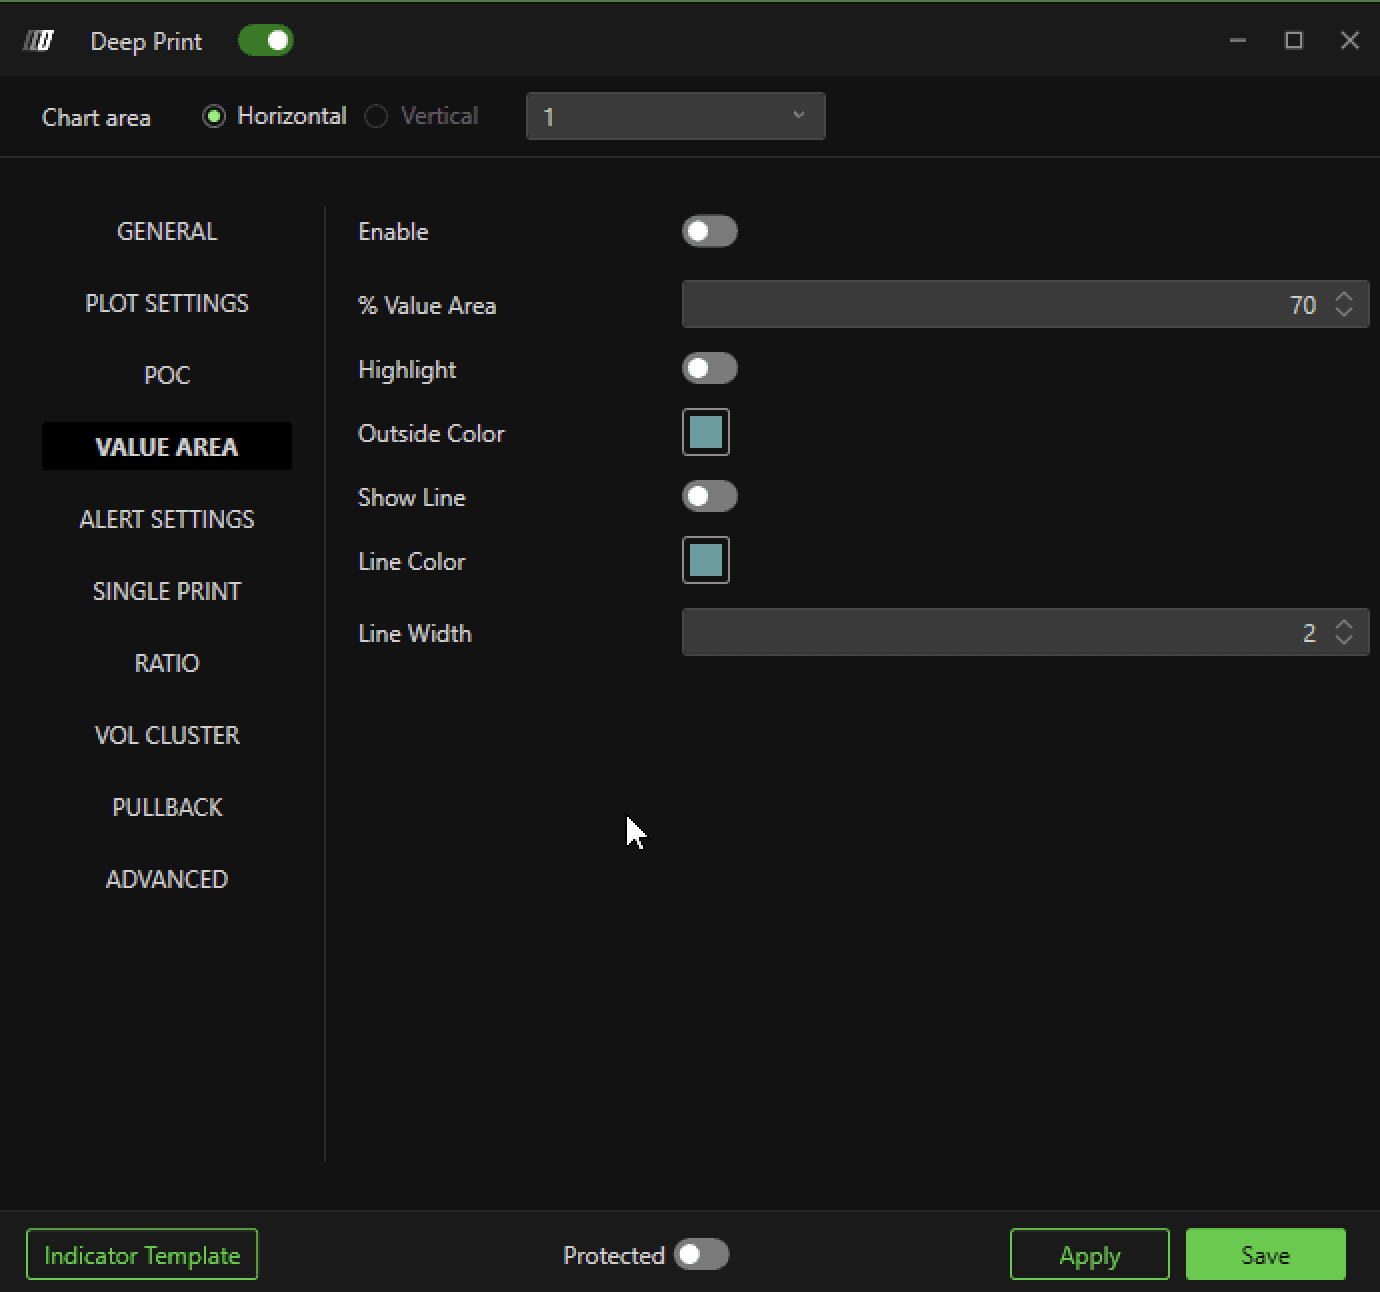
Enable (Value Area)
Toggles the display of the Value Area on or off. The Value Area represents the price range within which a certain percentage volume of total trades occurred.
% Value Area
Defines the percentage of total volume that is used to calculate the Value Area. For example, setting a value of 70% will show the price range within which 70% of the total volume occurred.
Highlight
Enable the option to visually highlight the Value Area on the candle. This allows the area of greatest volumetric activity to be highlighted.
OutSide Color
Select the color used to highlight the area outside the Value Area. This helps to clearly differentiate the area inside from the area outside the selected Value Area.
Show Line
Enables or disables the display of the line delimiting the Value Area.
Line Color
Allows you to select the color for the Value Area's delimiting line.
Line Width
Defines the thickness of the Value Area bounding line.
Alert Settings
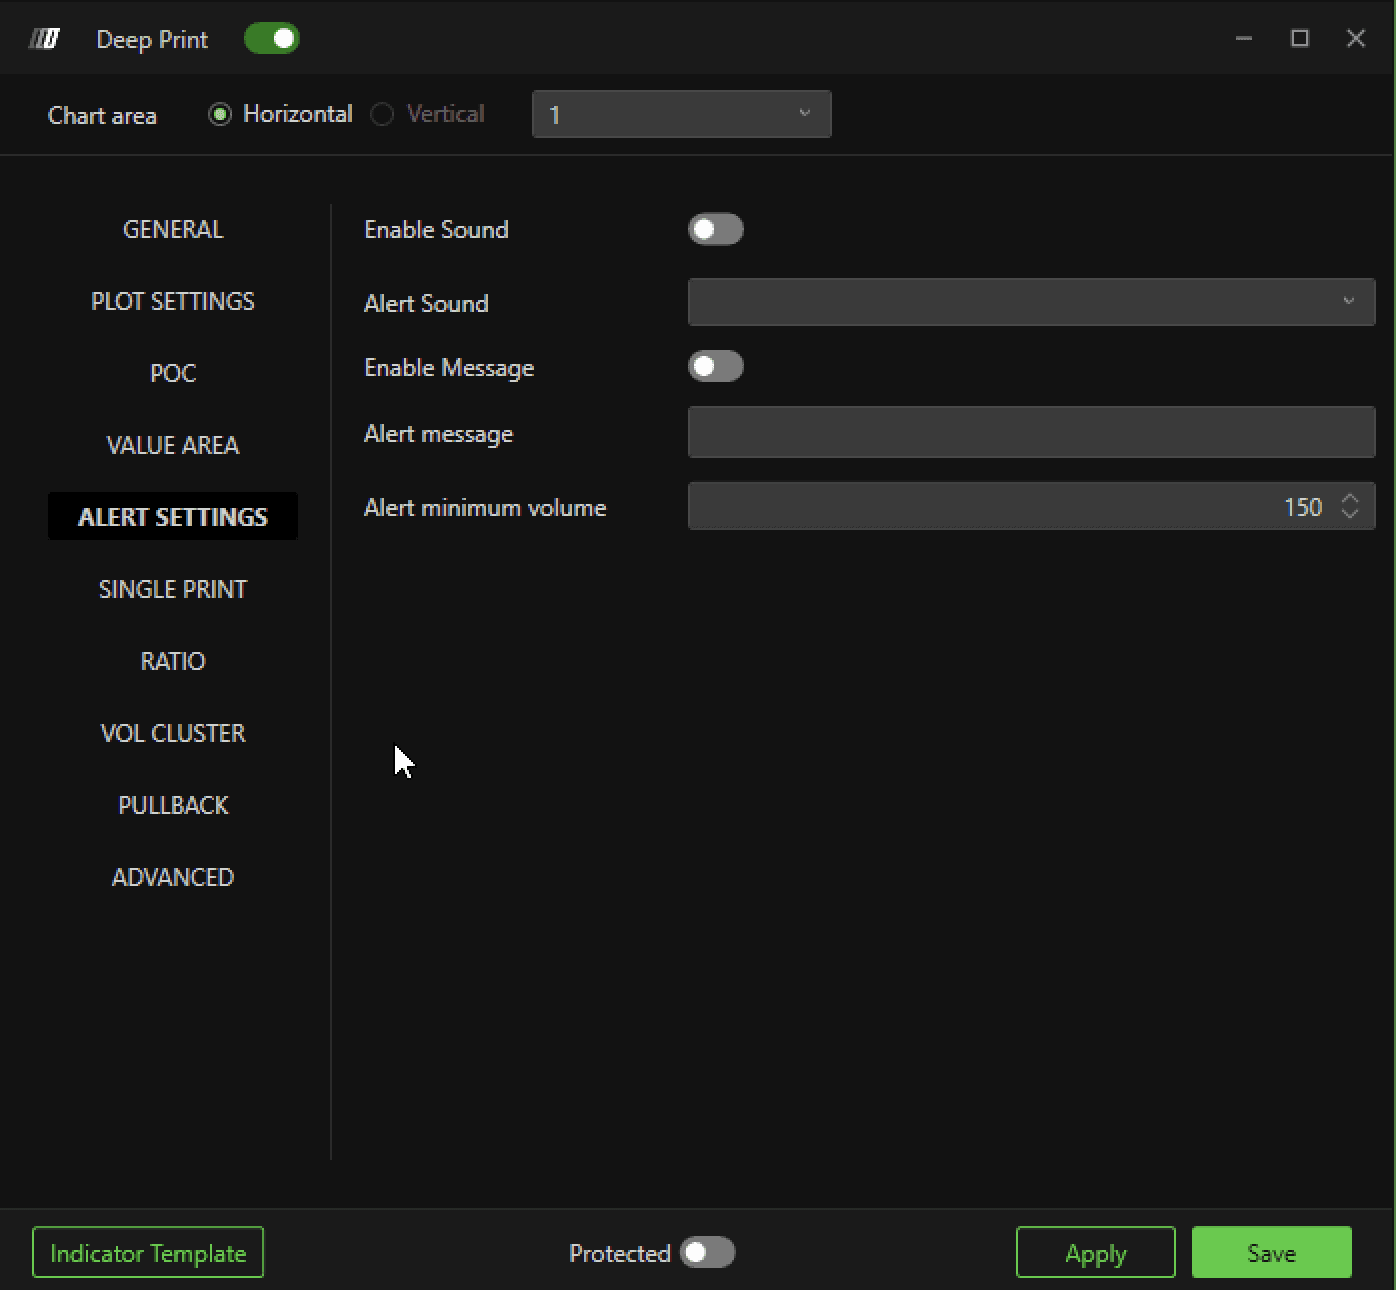
Enable Sound
Enable or disable the sending of a sound notification when a specific event is detected in the Order Flow Analyzer. This feature helps to draw attention to significant market conditions without having to constantly watch the chart.
Alert Sound
Allows the user to select the type of sound that will be played as an alert notification. The user can choose from several options to tailor the sound alert to his or her preferences.
Enable Message
Enables or disables the display of a popup window when an alert is generated. This option provides a visual reminder of the alerts.
Alert Message
Allows you to enter a custom message that will be displayed along with the alert. This message can be used to specify the type of event detected.
Alert Minimum Volume
Sets the minimum volume required to generate an alert. This feature allows you to filter out alerts and focus only on volumes that exceed a certain user-defined threshold.
Single Print
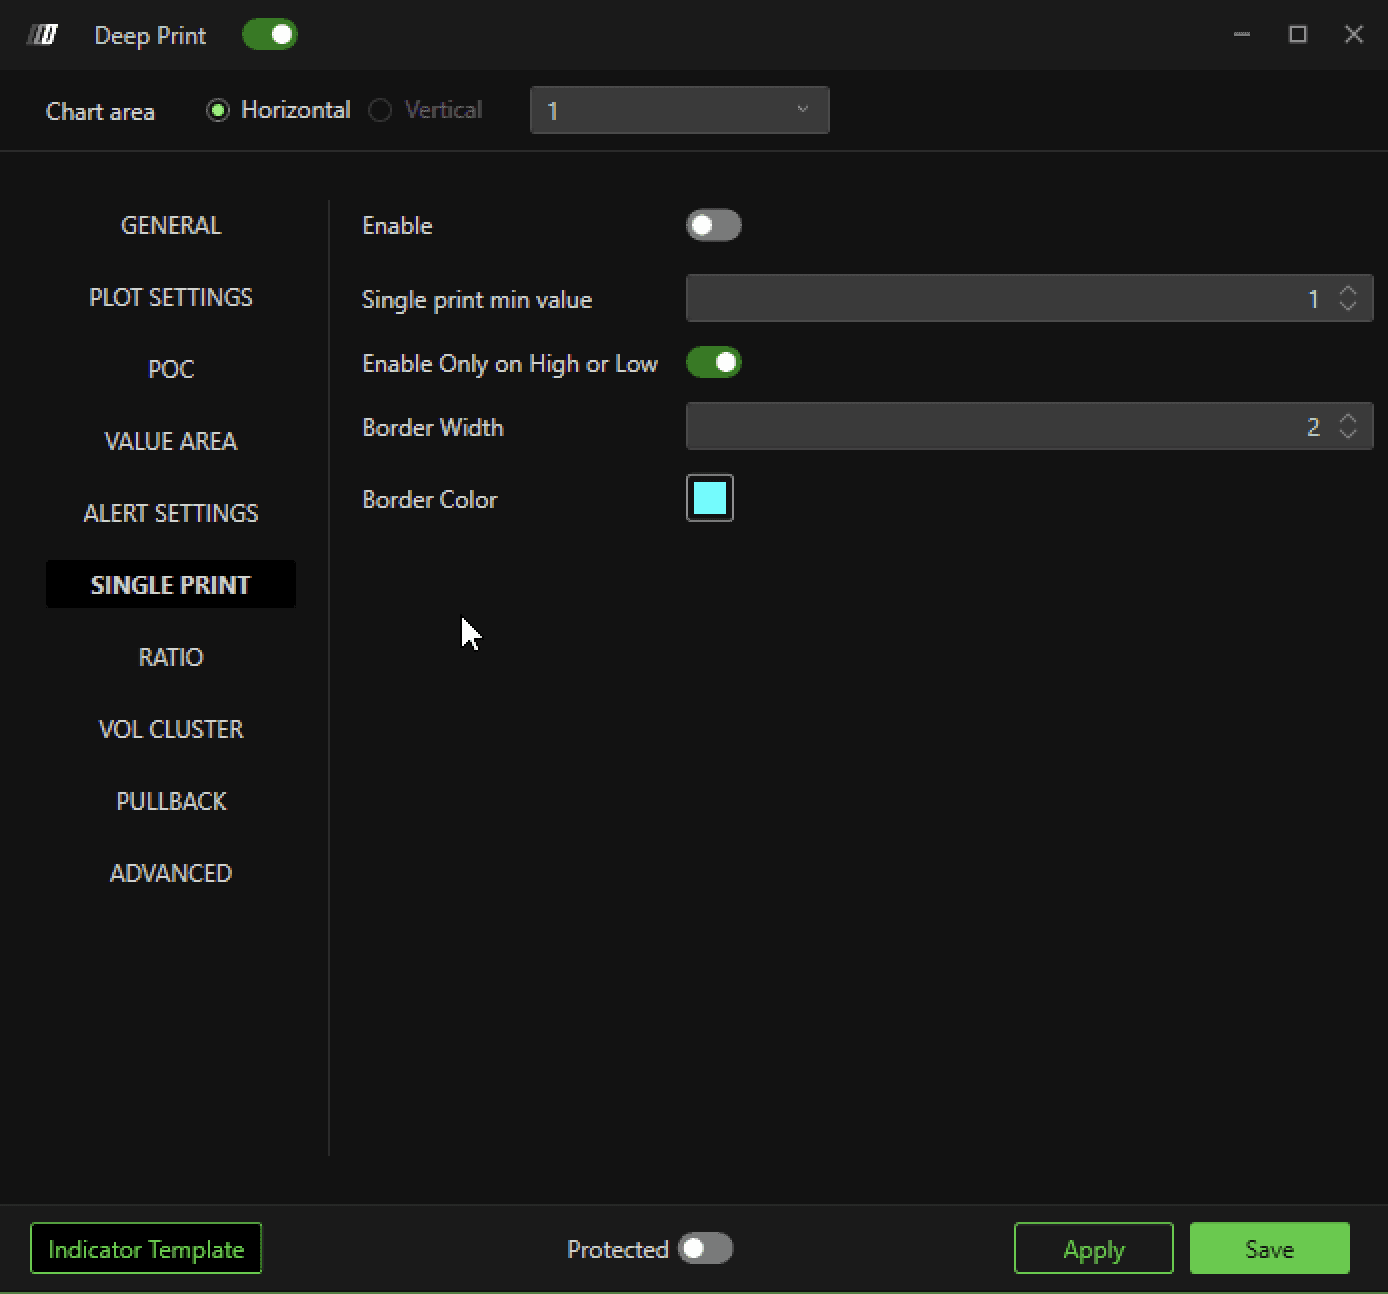
Enable
Enable or disable the display of single prints on the footprint. When enabled, this feature allows specific price levels characterized by a single defined order to be highlighted.
Single Print Min Value
Defines the minimum volume value for a single print to be considered relevant and to be highlighted.
Enable Only On High Or Low
Enable the option to highlight single prints only when they occur at the maximum or minimum price levels. This allows you to focus, for example, on any depletions at the extremes of the candles.
Border Width
Defines the thickness of the edge used to highlight single prints. A greater thickness makes the print more noticeable, improving readability on the chart.
Border Color
Allows you to select the color of the border to highlight individual prints. A custom color facilitates immediate identification of individual prints of interest.
Ratio
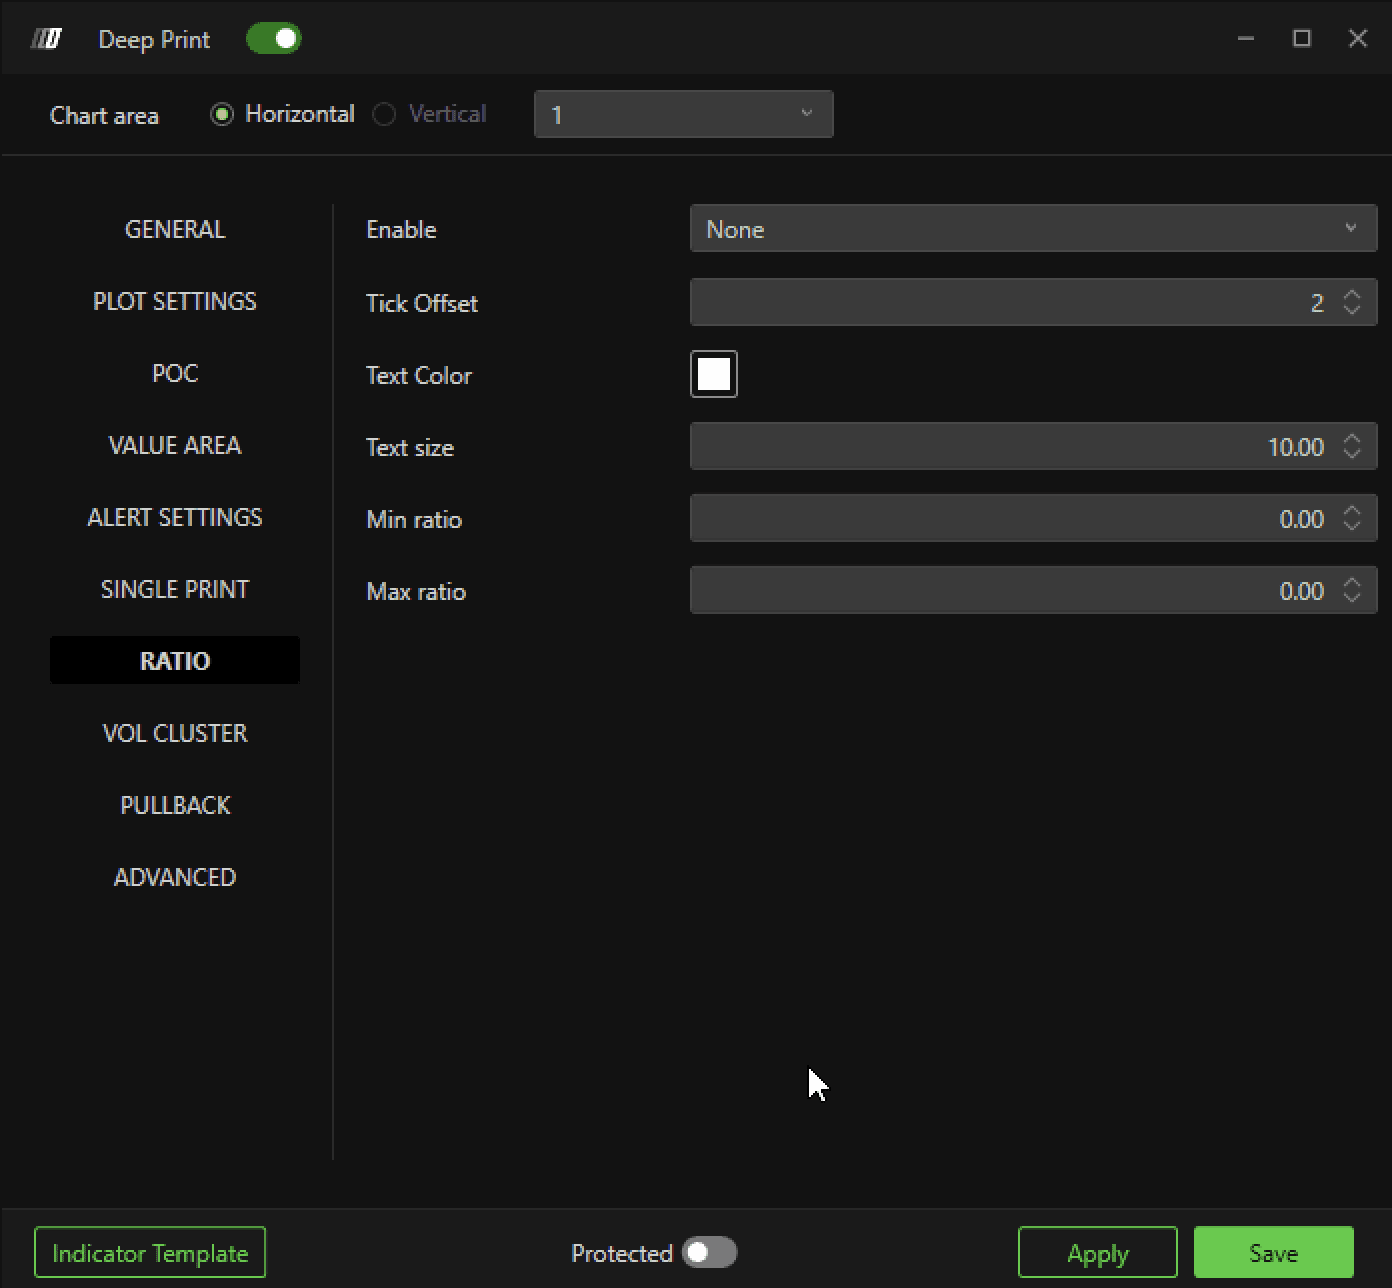
Enabled
Enables or disables the display of the ratio on the footprint bar. When enabled, it provides a numerical representation of the bid/ask ratio directly on the chart.
Tick Offset
Defines the offset in ticks to position the ratio value relative to the high and low of the bar. This allows you to adjust the position of the ratio to avoid overlapping with other data in the chart.
Text Color
Allows you to select the color of the text used to display the ratio.
Text Size
Defines the size of the text for displaying the ratio.
Min Ratio
Sets the minimum value of the ratio that must be reached to be displayed on the graph. This option allows you to filter out low ratios and focus only on significant values.
Maximum Ratio
Defines the maximum value of the ratio that can be displayed. This setting allows you to limit extreme values.
Vol Cluster
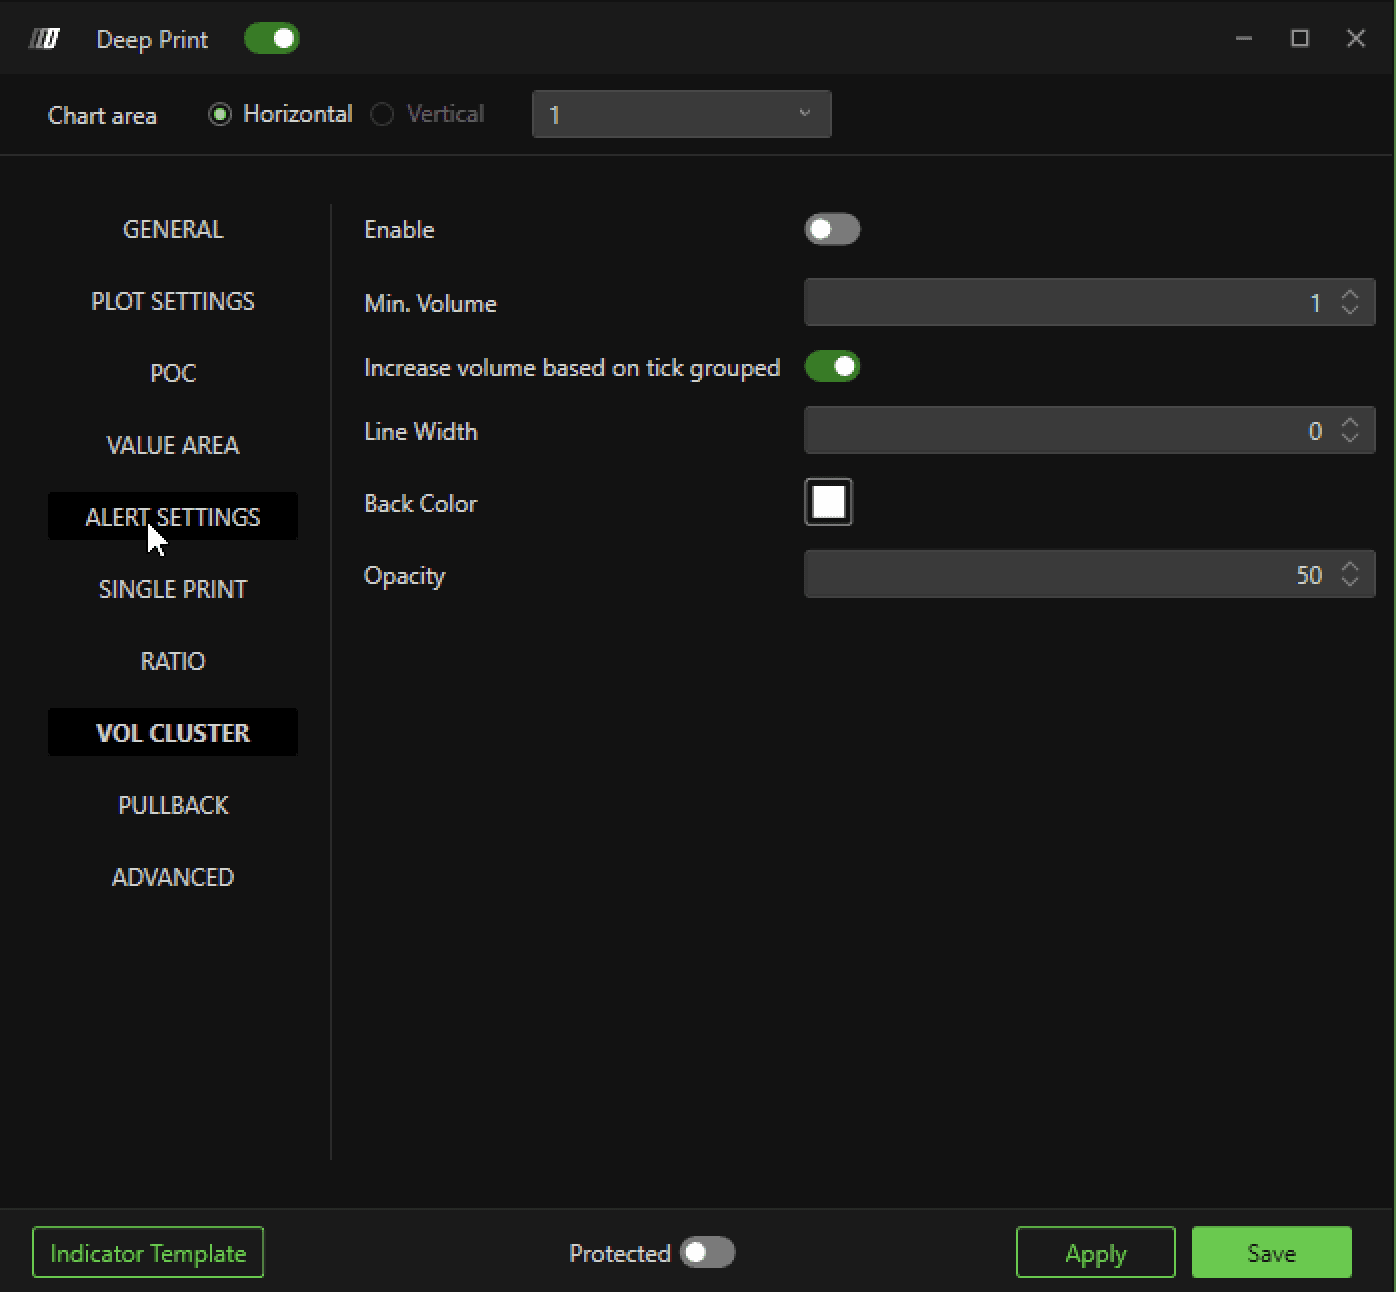
Enable
Enable or disable the display of the cluster volumes in the footprint. This feature highlights areas of the footprint with high trading volumes, helping to identify areas of strong market activity.
Min. Volume
Defines the minimum volume required for a cluster to be considered significant and to be displayed on the chart.
Increase Volume Based on Tick Grouped
Toggles the option to increase volume based on ticks grouped. This feature allows volumes to be summed across multiple levels of neighboring ticks, making it clearer how activities are concentrated in certain price areas.
Line Width
Defines the thickness of the line used to highlight the edge of the volume cluster.
Back Color
Select the background color for the volume cluster. A custom background color makes it easier to identify areas of interest, improving the visual clarity of the graph.
Opacity
Sets the opacity level of the background color for the volume cluster. A higher opacity value makes the background more visible, while a lower value makes it more transparent, allowing you to adjust the display to your preferences and the readability of the chart.
Pull Back
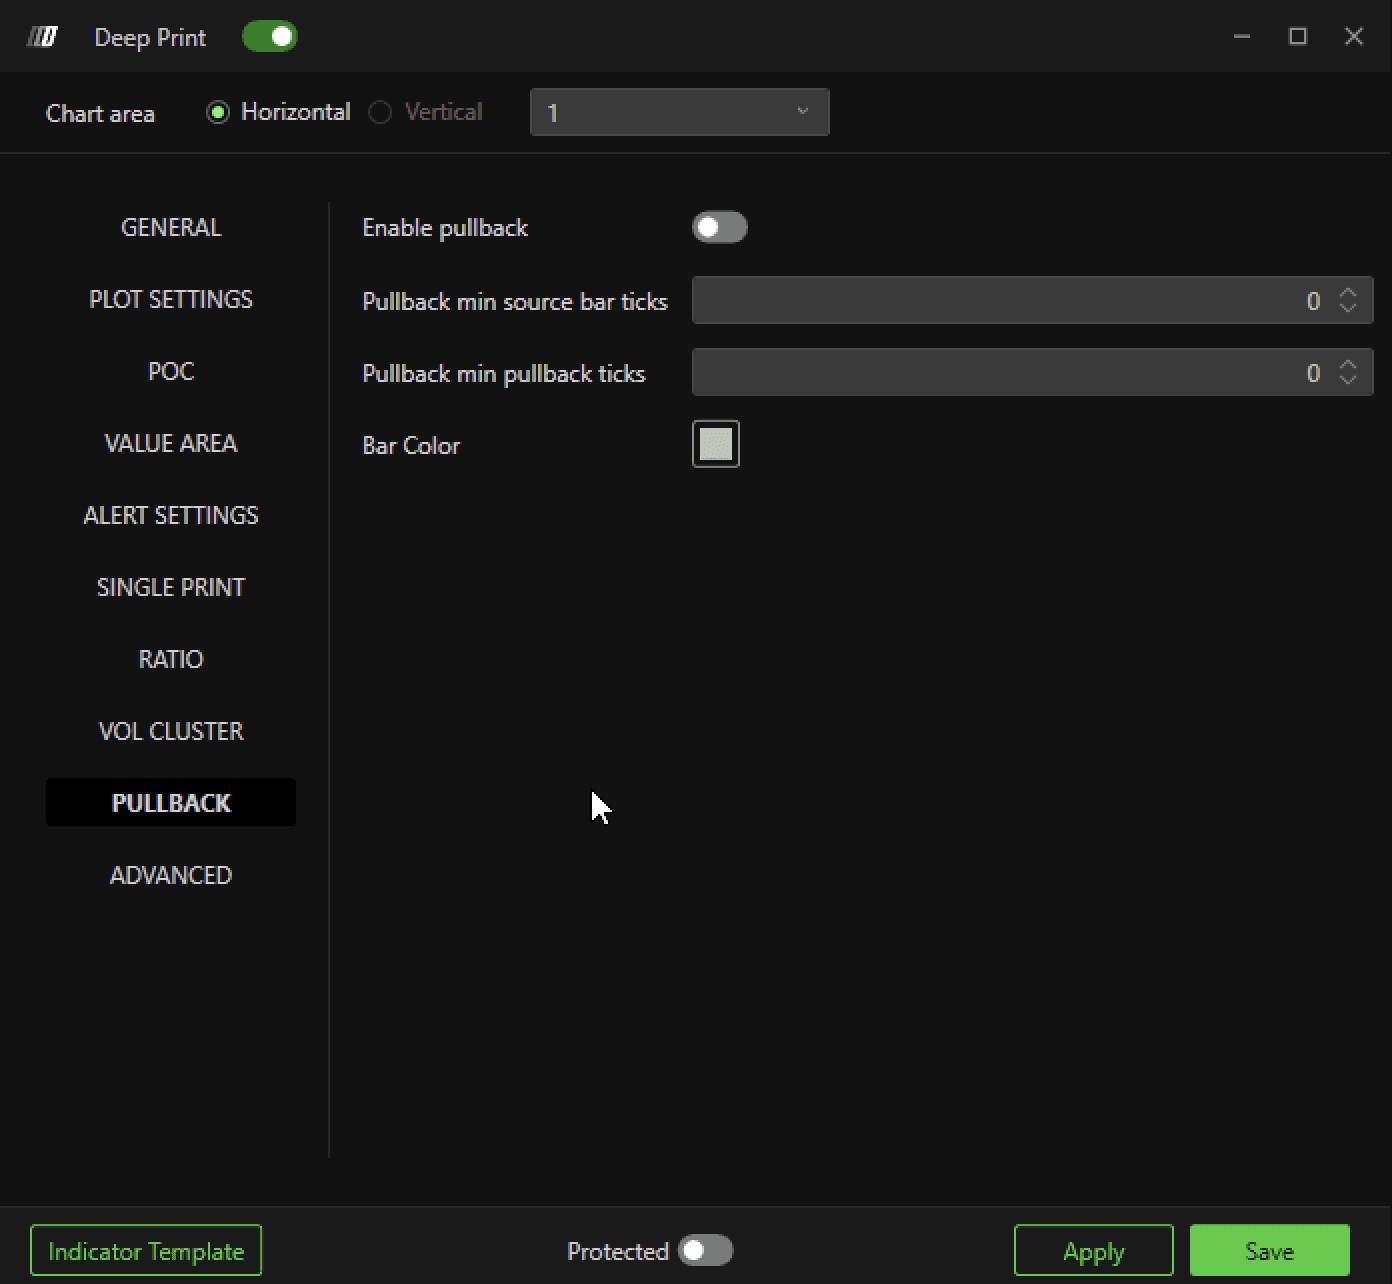
Enable
Toggle pullback on or off on the footprint. This option allows the footprint to highlight price pullbacks, which are useful for understanding potential scalping operation points or intra bar entries and exits.
Pullback Min Source Bar Ticks
Defines the minimum number of ticks the source bar should be composed of for pullback.
Pullback Min Pullback Ticks
Defines the minimum number of ticks to define the pullback by defining the minimum distance that price must retrace to qualify the move as a pullback.
Bar Color
Lets you select the bar color to highlight pullbacks on the chart. This helps make pullbacks visually distinct from other market movements, facilitating analysis.
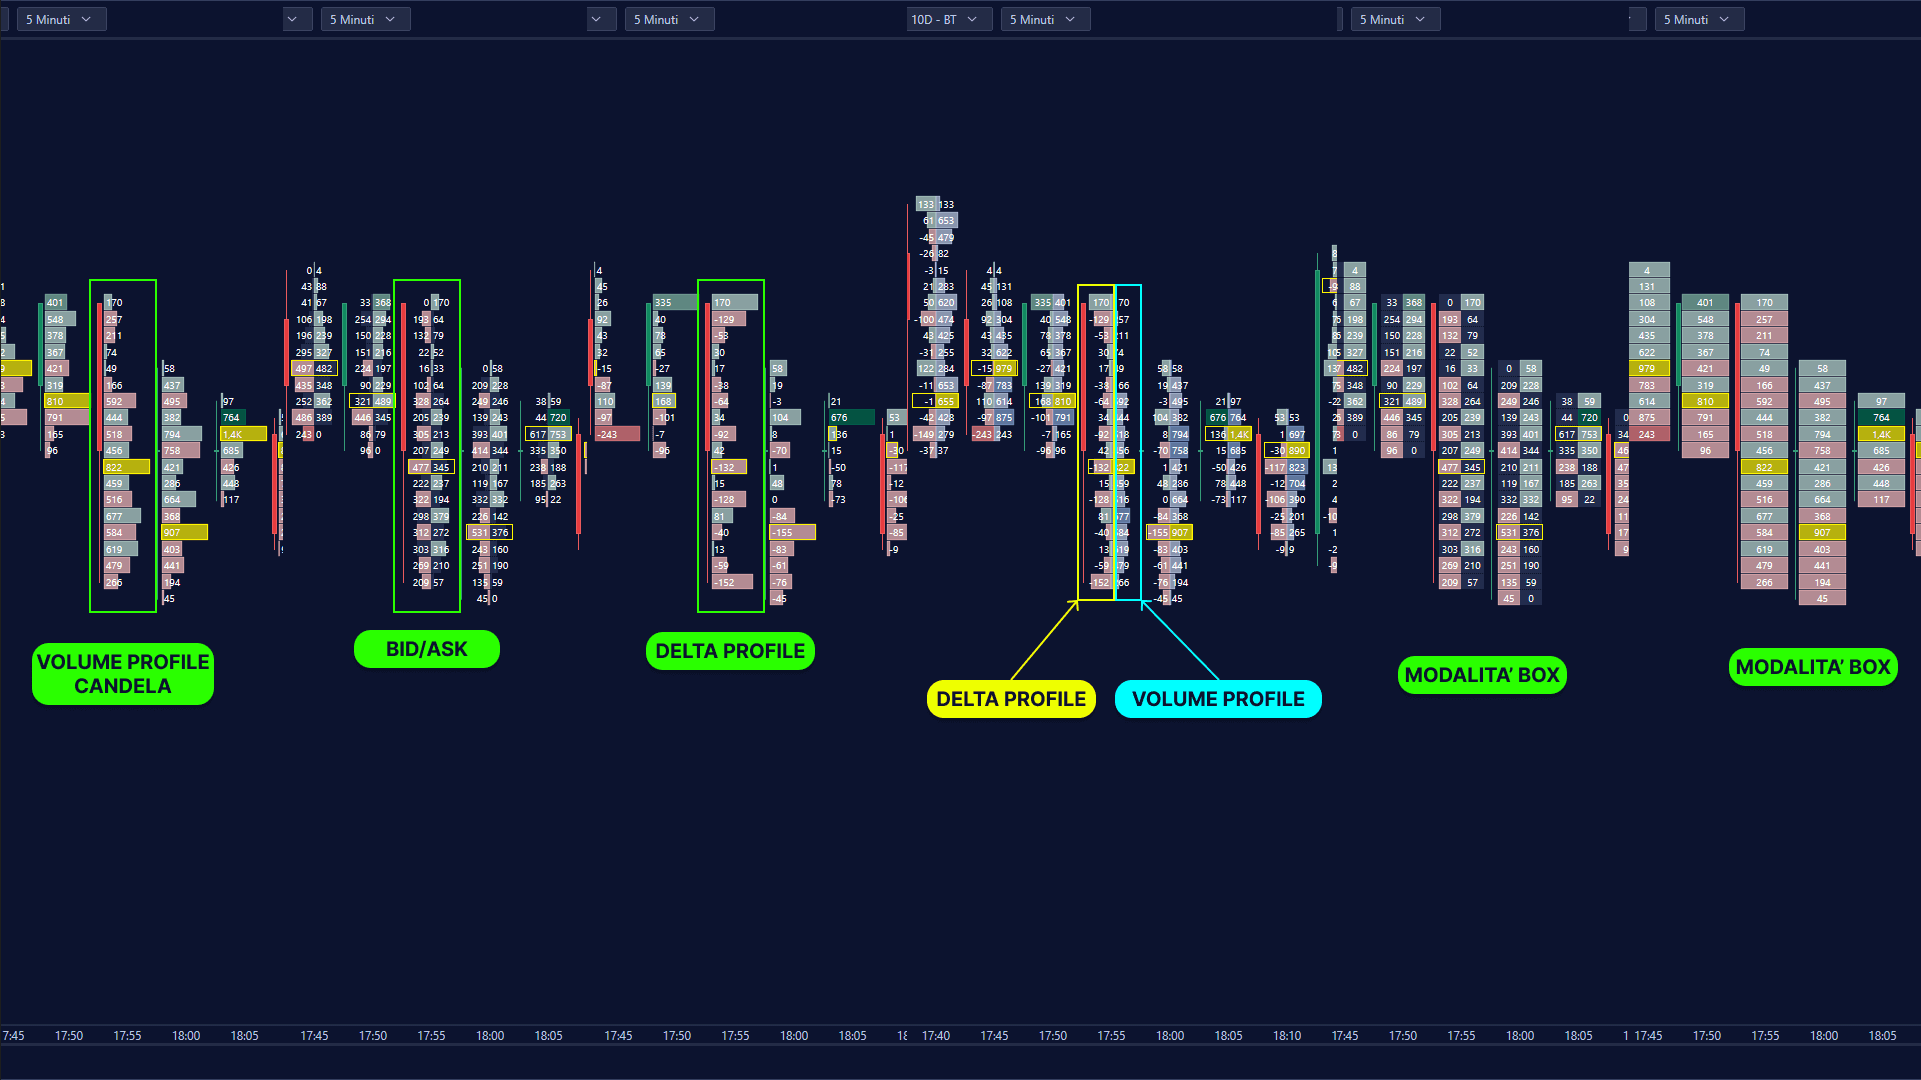
Multi-Column Deep Print Layouts
Deep Print supports displaying multiple footprint views side by side. Users can configure up to 4 simultaneous columns.
Setup Instructions:
Add multiple Deep Print indicators
Open settings for each Deep Print
Navigate to Sizing >> Multi Column
Set the desired number of columns
Assign a unique position for each Deep Print
Customize each Deep Print independently
Examples of what you can display simultaneously:
Bid x Ask
Delta
Volume
Custom footprint configurations
Maximum supported columns: 4
Still Having Trouble?
Our support team is available 24/7 and ready to help you with any issue you encounter.
When reaching out, please include:
A screenshot of the issue
A brief description of what you were trying to do
Support Ticket (Fastest Response)
Visit www.deepcharts.com and create a support ticket directly on our website.
Email Support
Reach us at support@deepcharts.com - please note that email responses may take a little longer than a support ticket.