Deep Indicators
Updated:
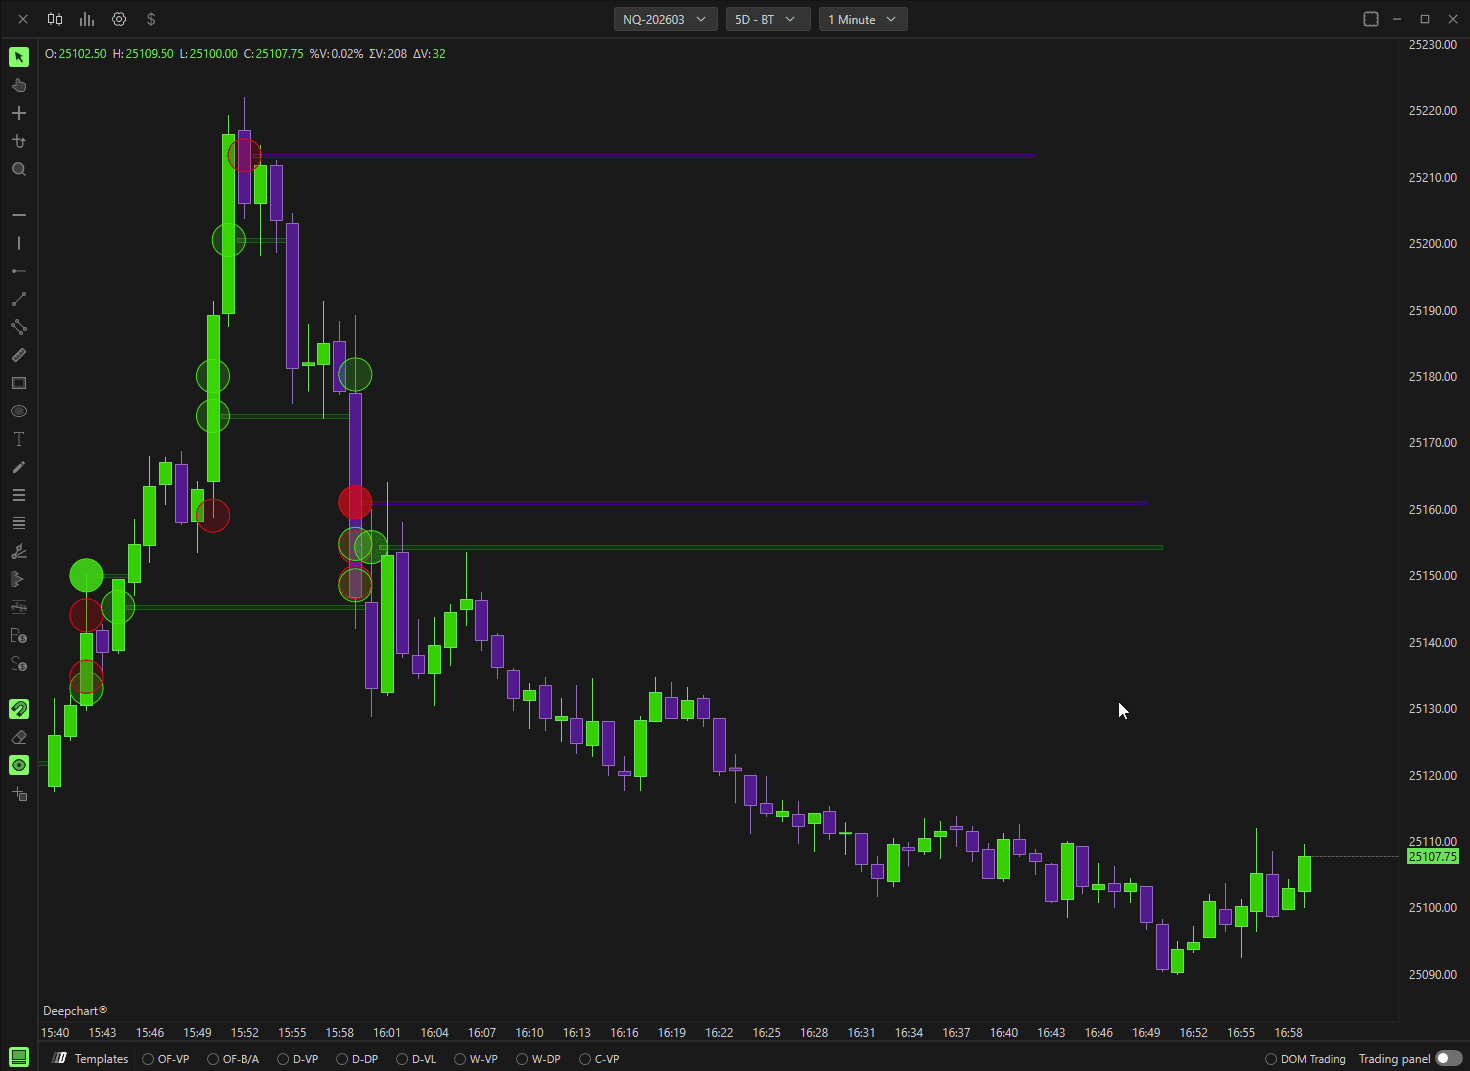
The Deep Trades indicator allows traders to visualize large, aggressive market orders in real time. It highlights significant buy and sell activity directly on the chart, helping identify institutional participation and strong directional intent.
This indicator is especially useful for:
Detecting aggressive buyers and sellers
Identifying high-impact price levels
Understanding real-time order flow dynamics
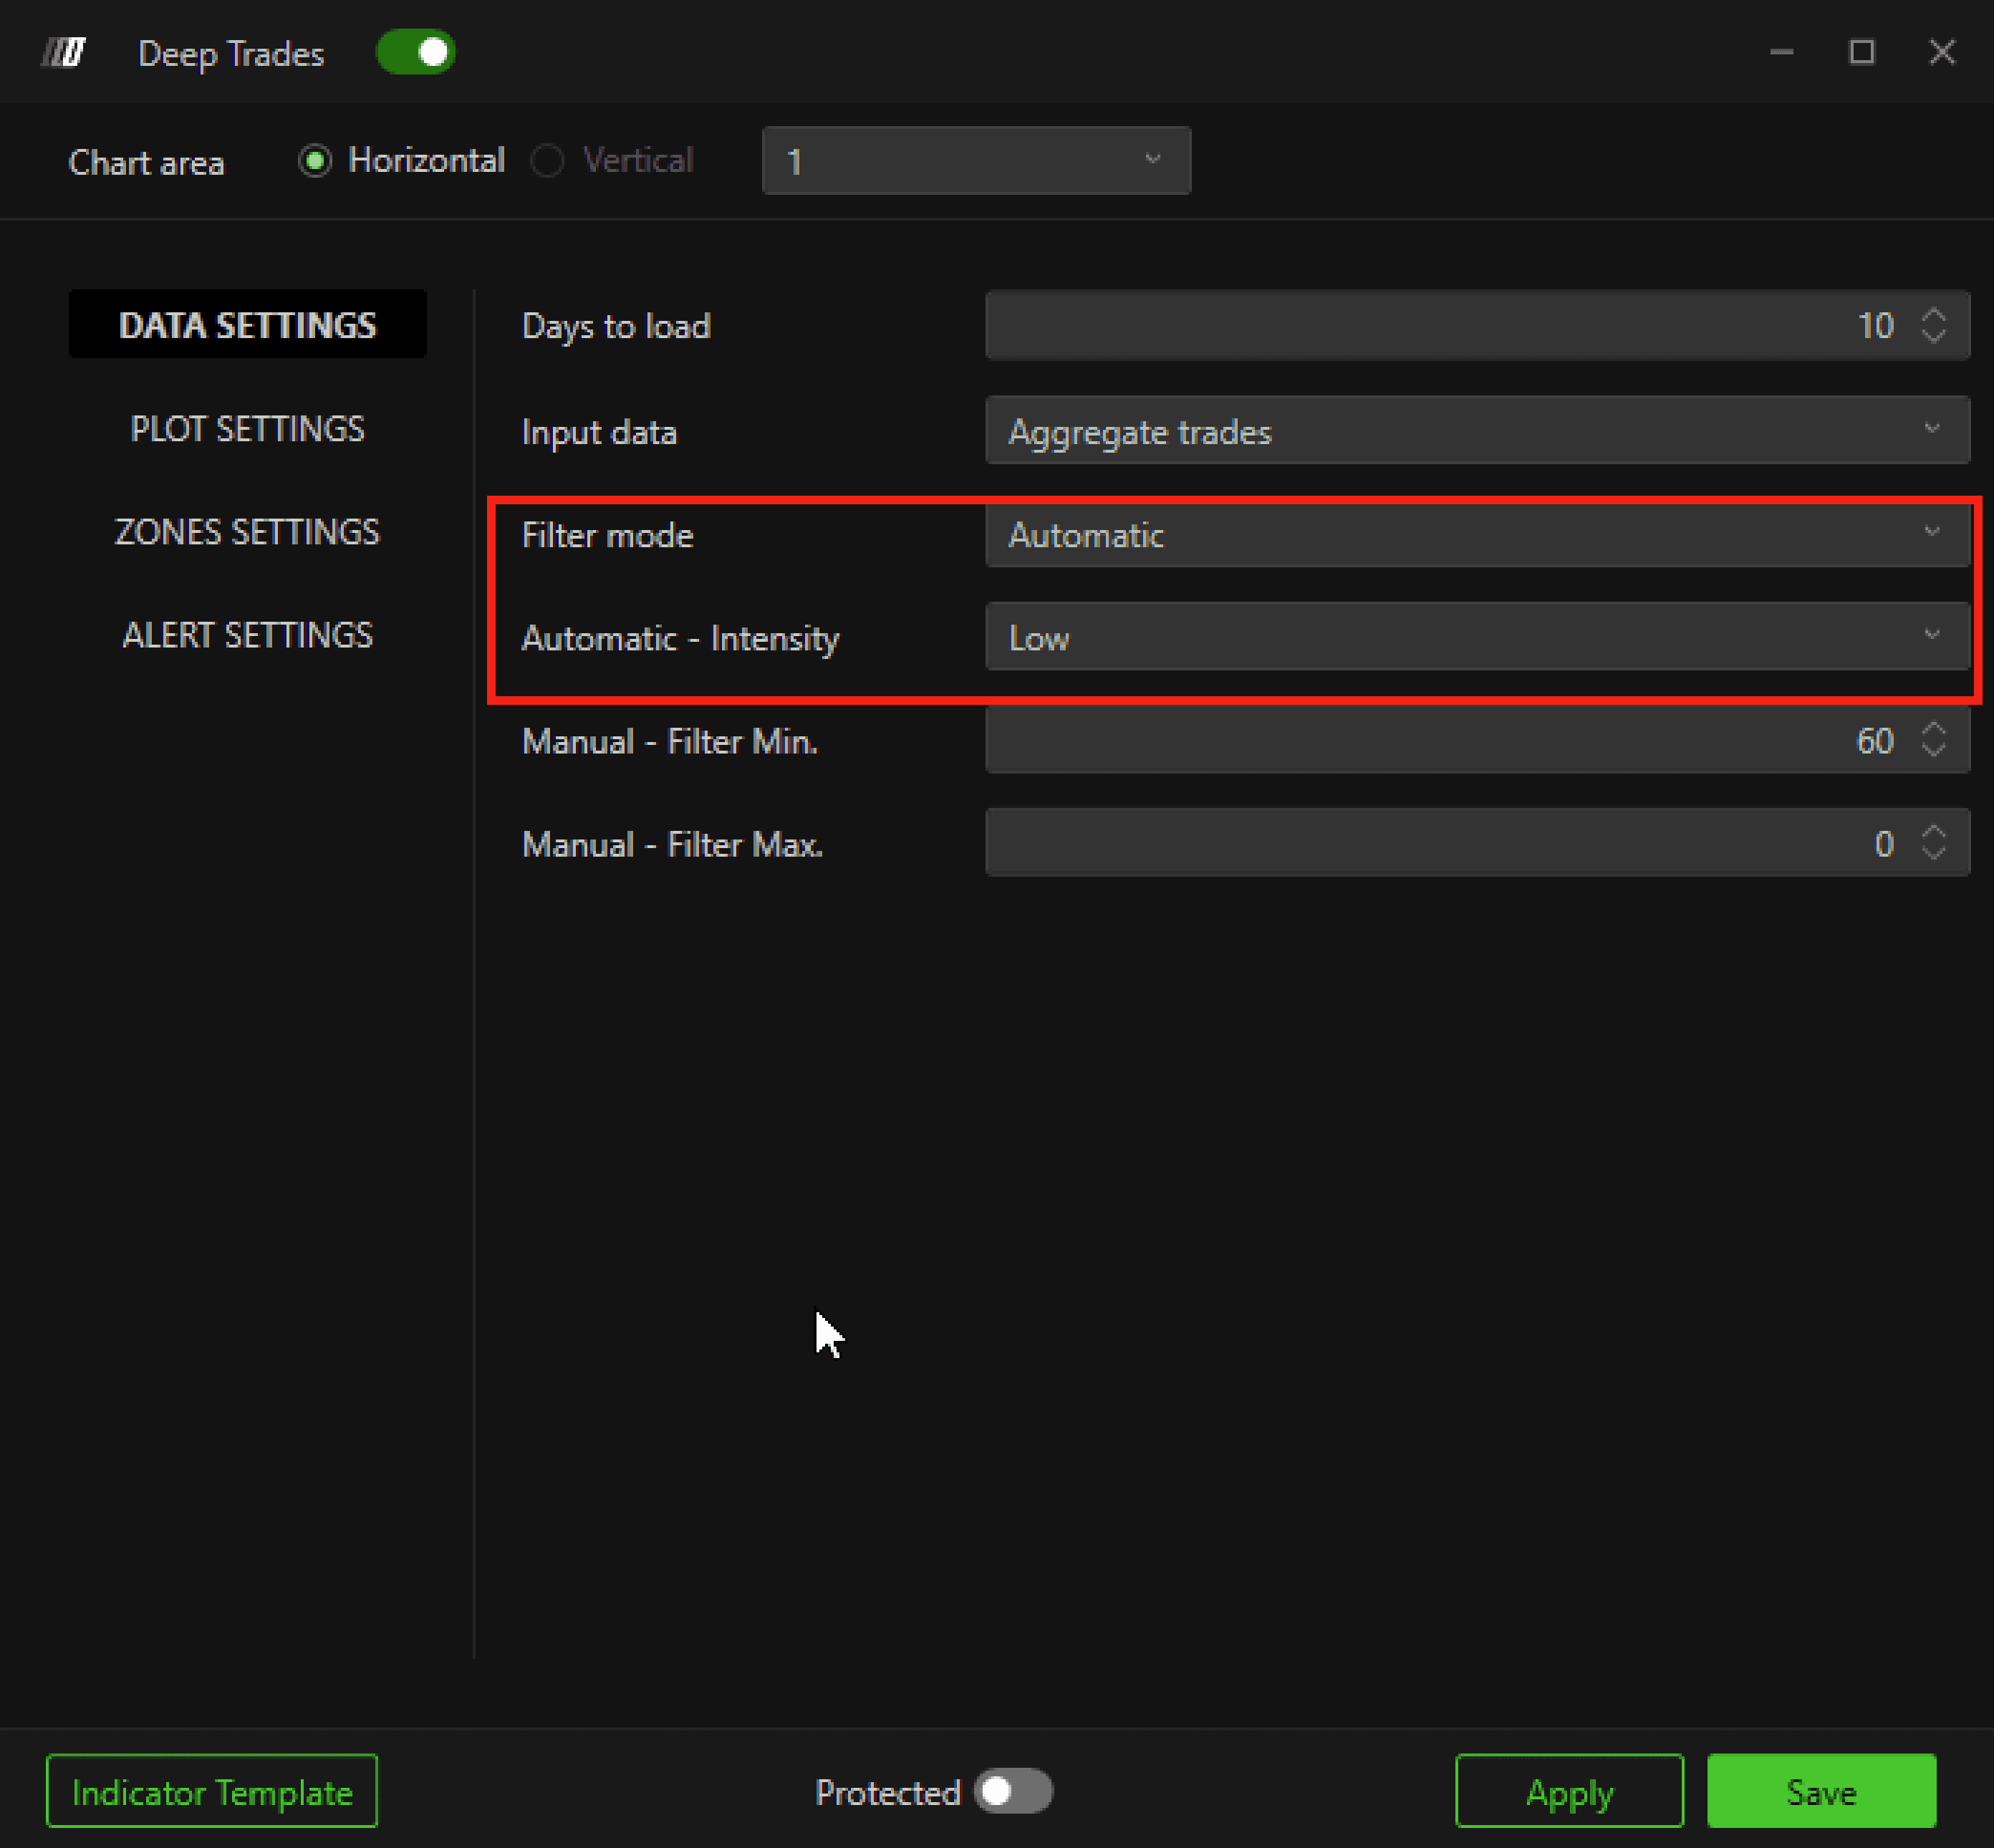
1.1 Data Settings
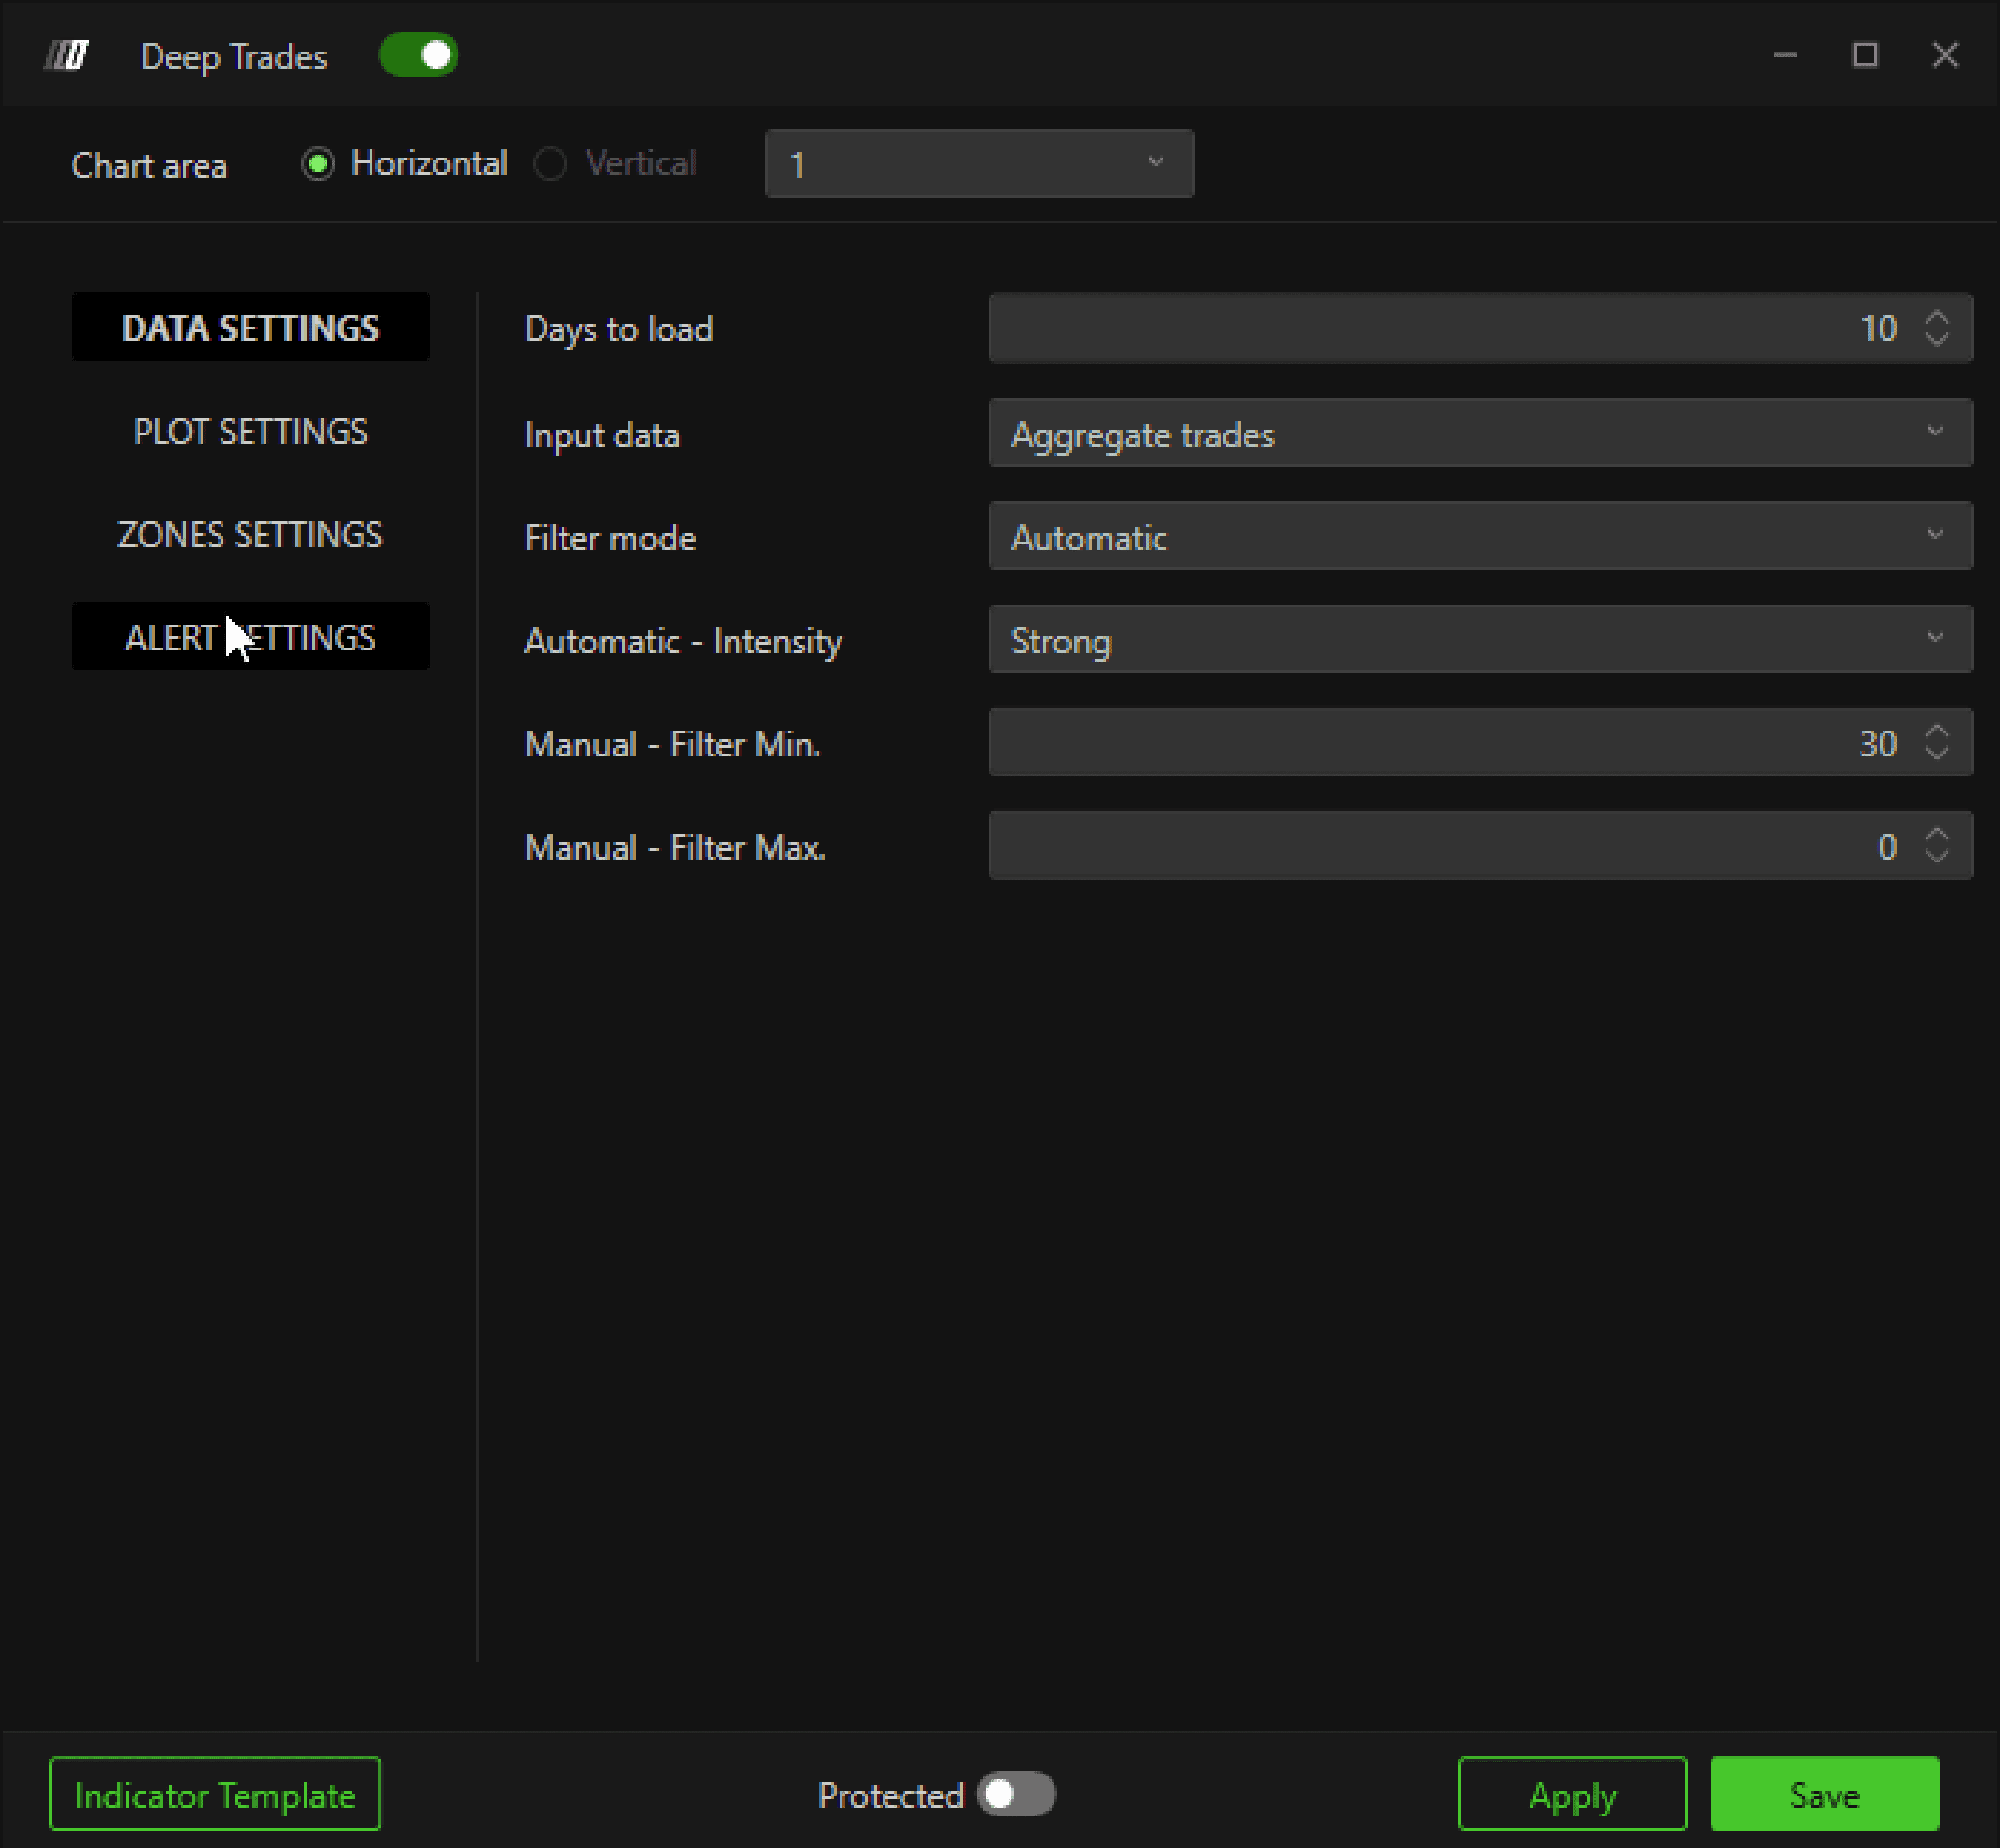
Days to Load
Defines how many historical days of large trade data are loaded on the chart.
Input Type
Specifies which type of order flow data the indicator uses.
For more details, refer to:
Different Types of Input Data for Indicators
Filter Mode
Defines how large trades are filtered:
Manual
Allows you to manually filter large trades using Min & Max values.Automatic
Uses the Big Trades Analysis algorithm to automatically determine optimal thresholds.
(Explained in section 1.4 Big Trades Analysis)
Manual Filter (Min & Max)
Sets the minimum and maximum trade size displayed on the chart.
Example:
If Min = 30, only trades with 30 contracts or more will be plotted.
This helps reduce noise and focus only on meaningful, high-volume trades.
1.2 Plot Settings
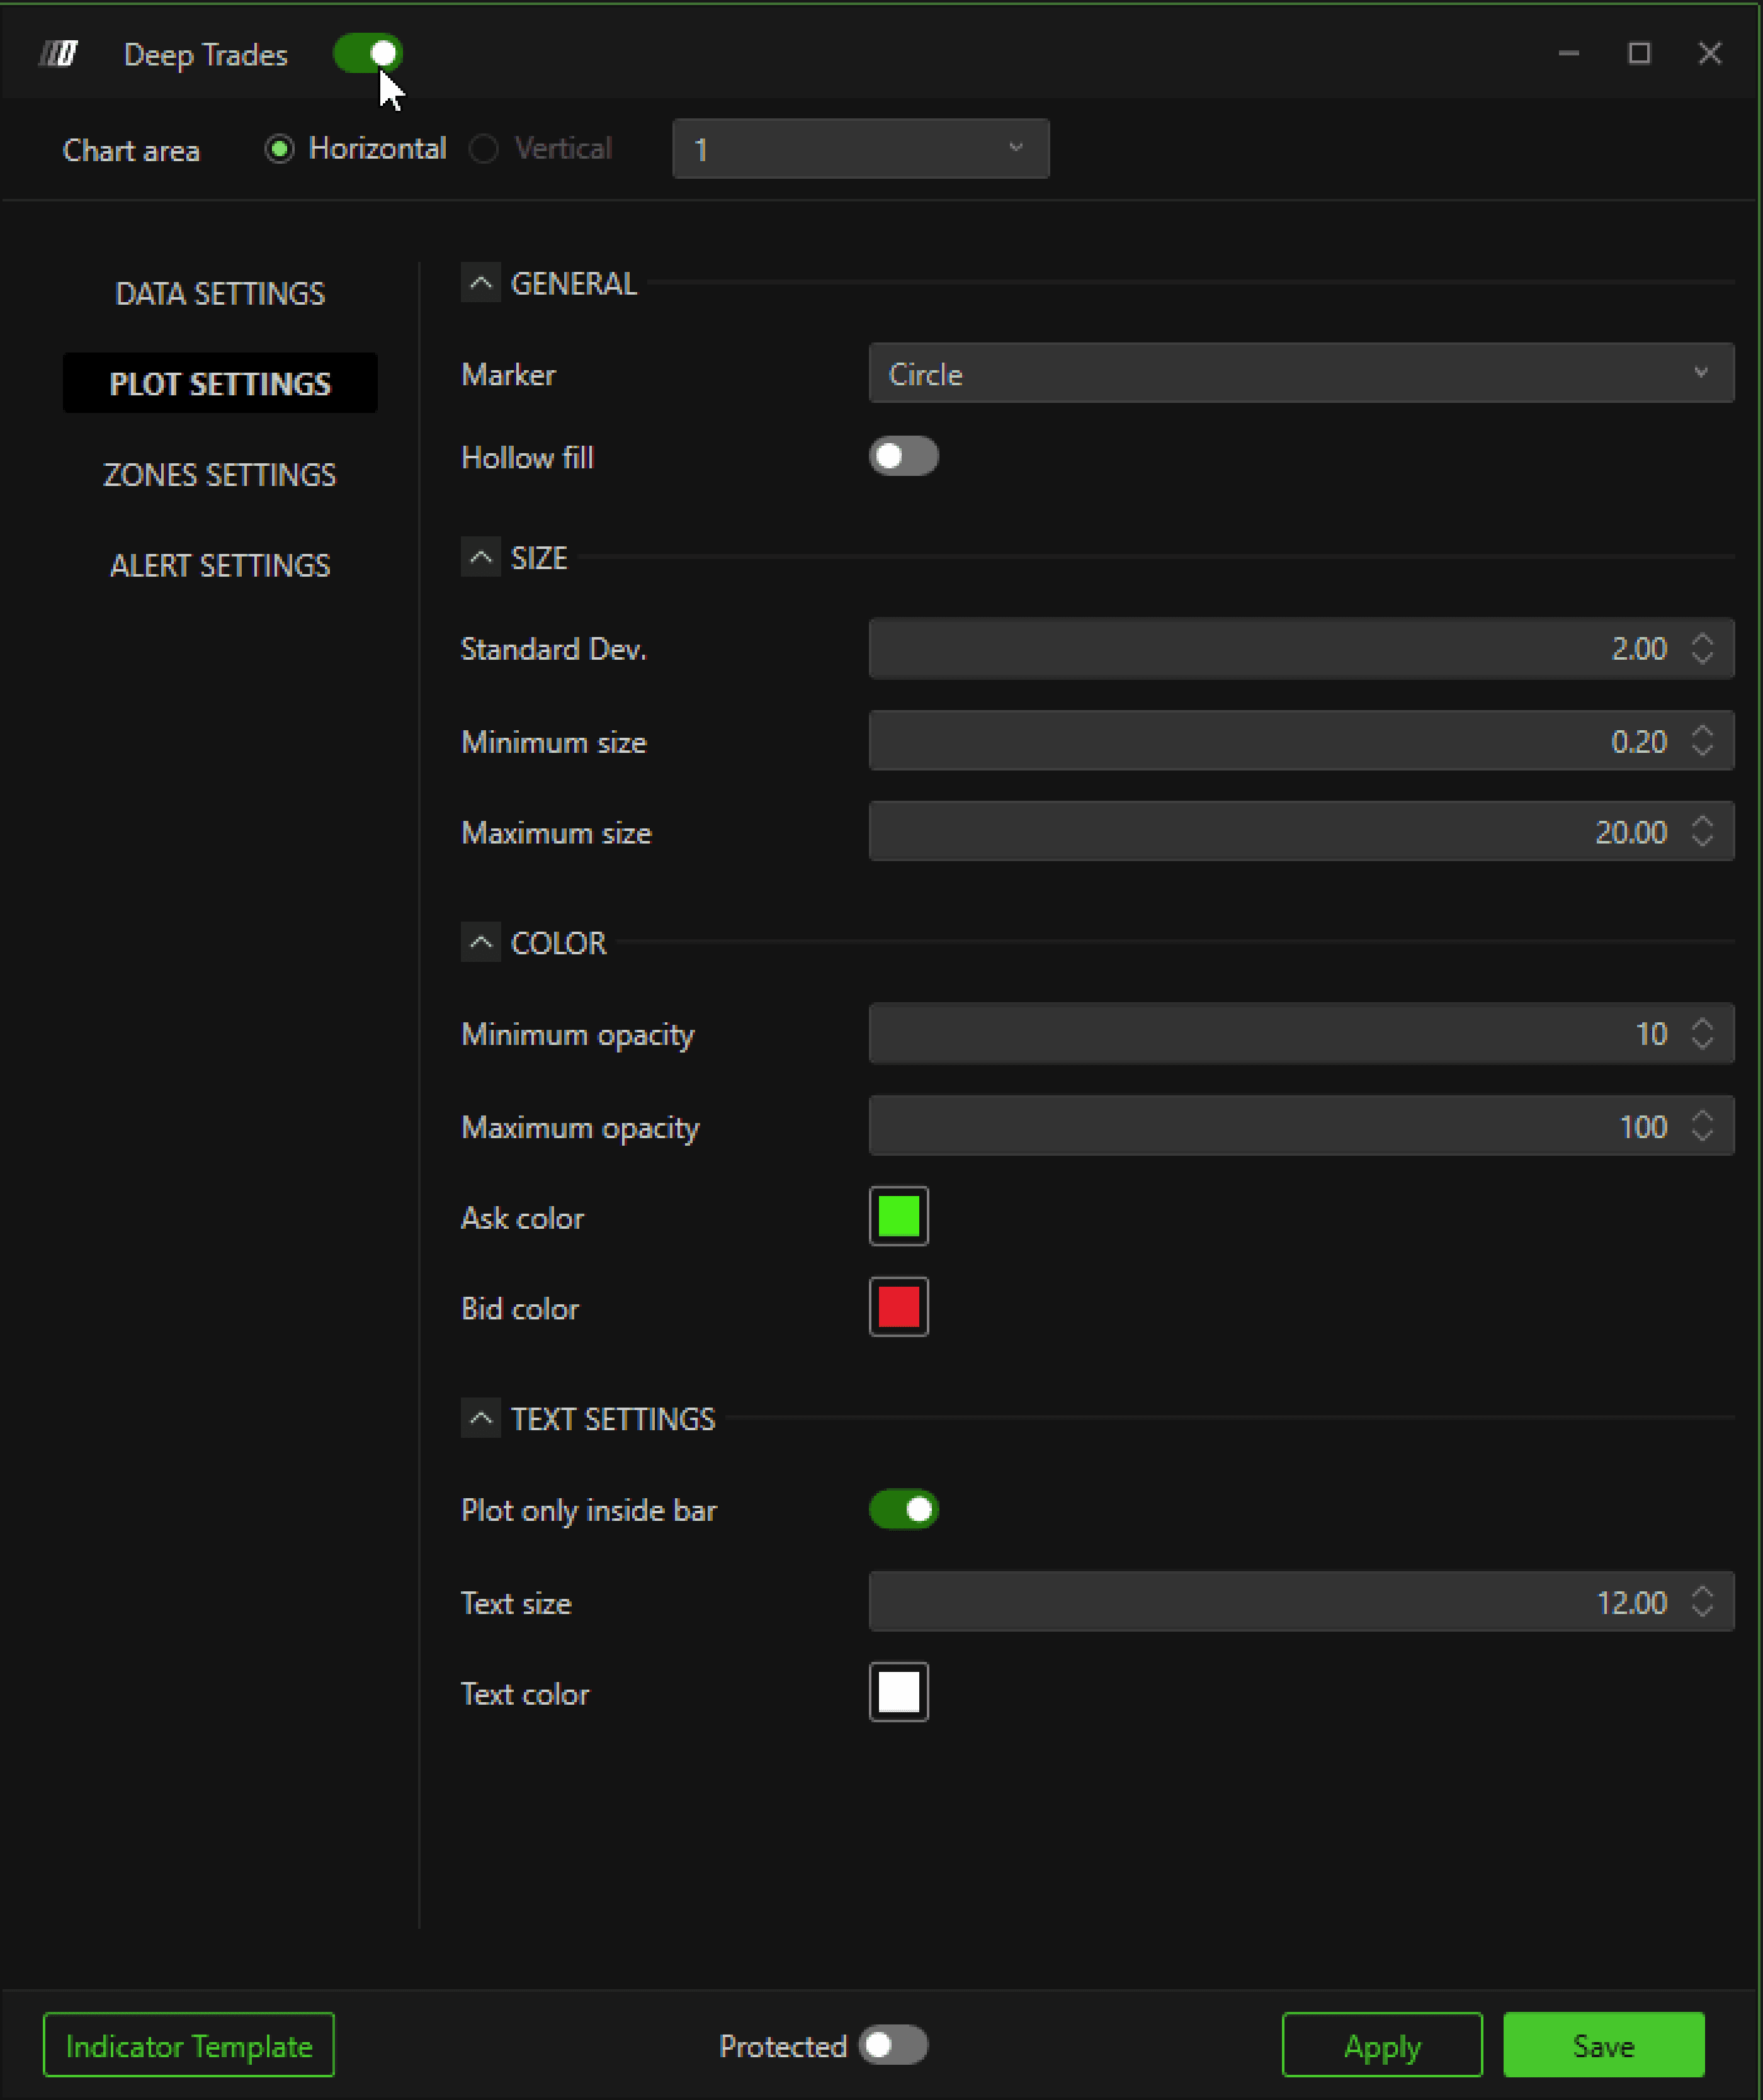
Customize how Deep Trades appear on the chart.
General
Marker Type: Choose between Circle, Square, Diamond, or Text
Hollow Fill: Displays marker outlines without fill color
Size
Standard Deviation: Controls marker scaling between minimum and maximum sizes
(Recommended to keep default)Minimum Size: Smallest marker size
Maximum Size: Largest marker size
Color
Minimum Opacity: Lowest opacity value for markers
Maximum Opacity: Highest opacity value for markers
Ask Color: Color for aggressive buyers
Bid Color: Color for aggressive sellers
Text Settings
(Only applicable when Marker Type is set to Text)
Plot Only Inside Bar: Restricts text to candle body
Text Size: Font size of the text
Text Color: Font color
1.3 Zones Settings
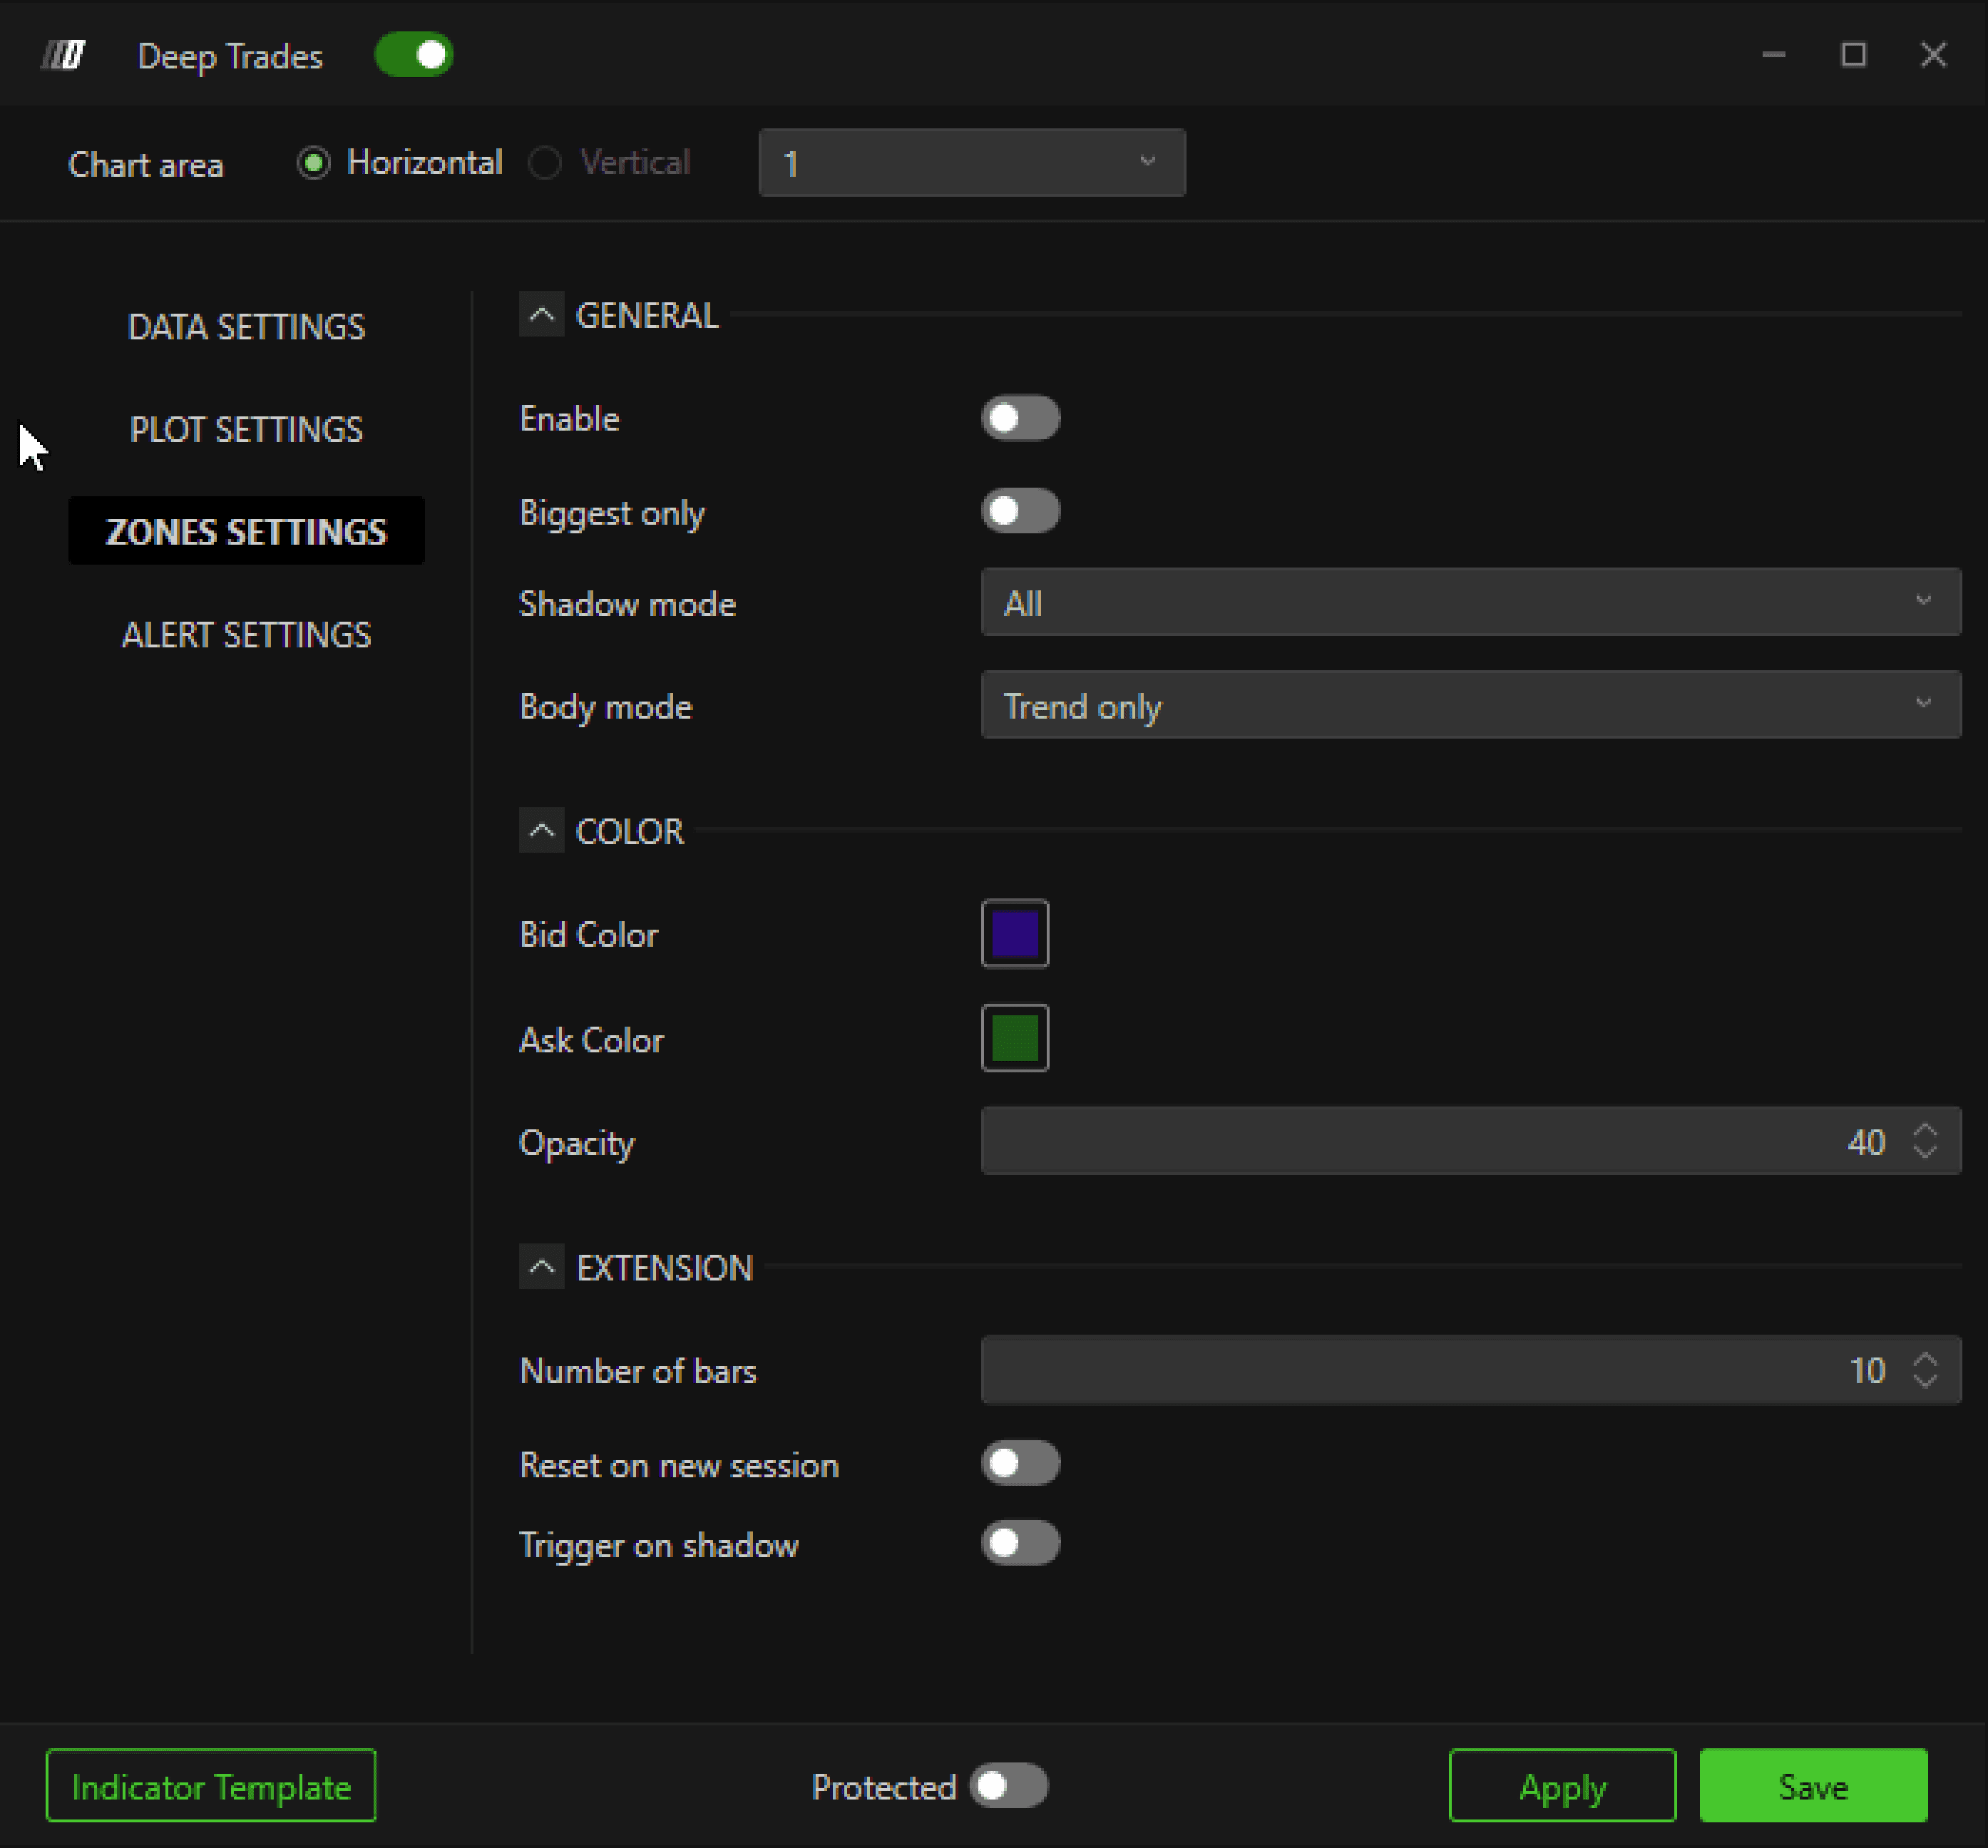
When enabled, the indicator plots horizontal zones based on large trades.
General
Biggest Only
Plots zones only for the largest trades.
Shadow Mode (Candle Wick)
Controls how zones are plotted for trades occurring in candle wicks:
All: Plot zones for all wick trades
Reverse Only:
Bearish candle → Aggressive buyers
Bullish candle → Aggressive sellers
Trend Only:
Bearish candle → Aggressive sellers
Bullish candle → Aggressive buyers
None: No zones plotted for wick trades
Body Mode (Candle Body)
Controls how zones are plotted for trades occurring in candle bodies:
All: Plot zones for all body trades
Reverse Only:
Bearish candle → Aggressive buyers
Bullish candle → Aggressive sellers
Trend Only:
Bearish candle → Aggressive sellers
Bullish candle → Aggressive buyers
None: No zones plotted for body trades
Color
Bid Color: Zone color for aggressive sellers
Ask Color: Zone color for aggressive buyers
Opacity: Transparency level of zones
Extension
Number of Bars: Defines how long the zone extends horizontally
1.4 Big Trades Analysis
Big Trades Analysis is a DeepCharts algorithm that dynamically calculates optimal large-trade thresholds based on price behavior and volatility of the selected symbol.
Key Notes
Analysis only needs to be run once per week or month
Results are saved automatically
No need to rerun the analysis every time you open the platform
How to Use Big Trades Analysis
Apply the Deep Trades indicator to your chart
Open Indicator Settings
Set Filter Mode to Automatic
Select Intensity Level:
Low
Medium
Strong
(These act similarly to Min & Max filters but are calculated automatically by the platform)
Save the settings
Run the Analysis
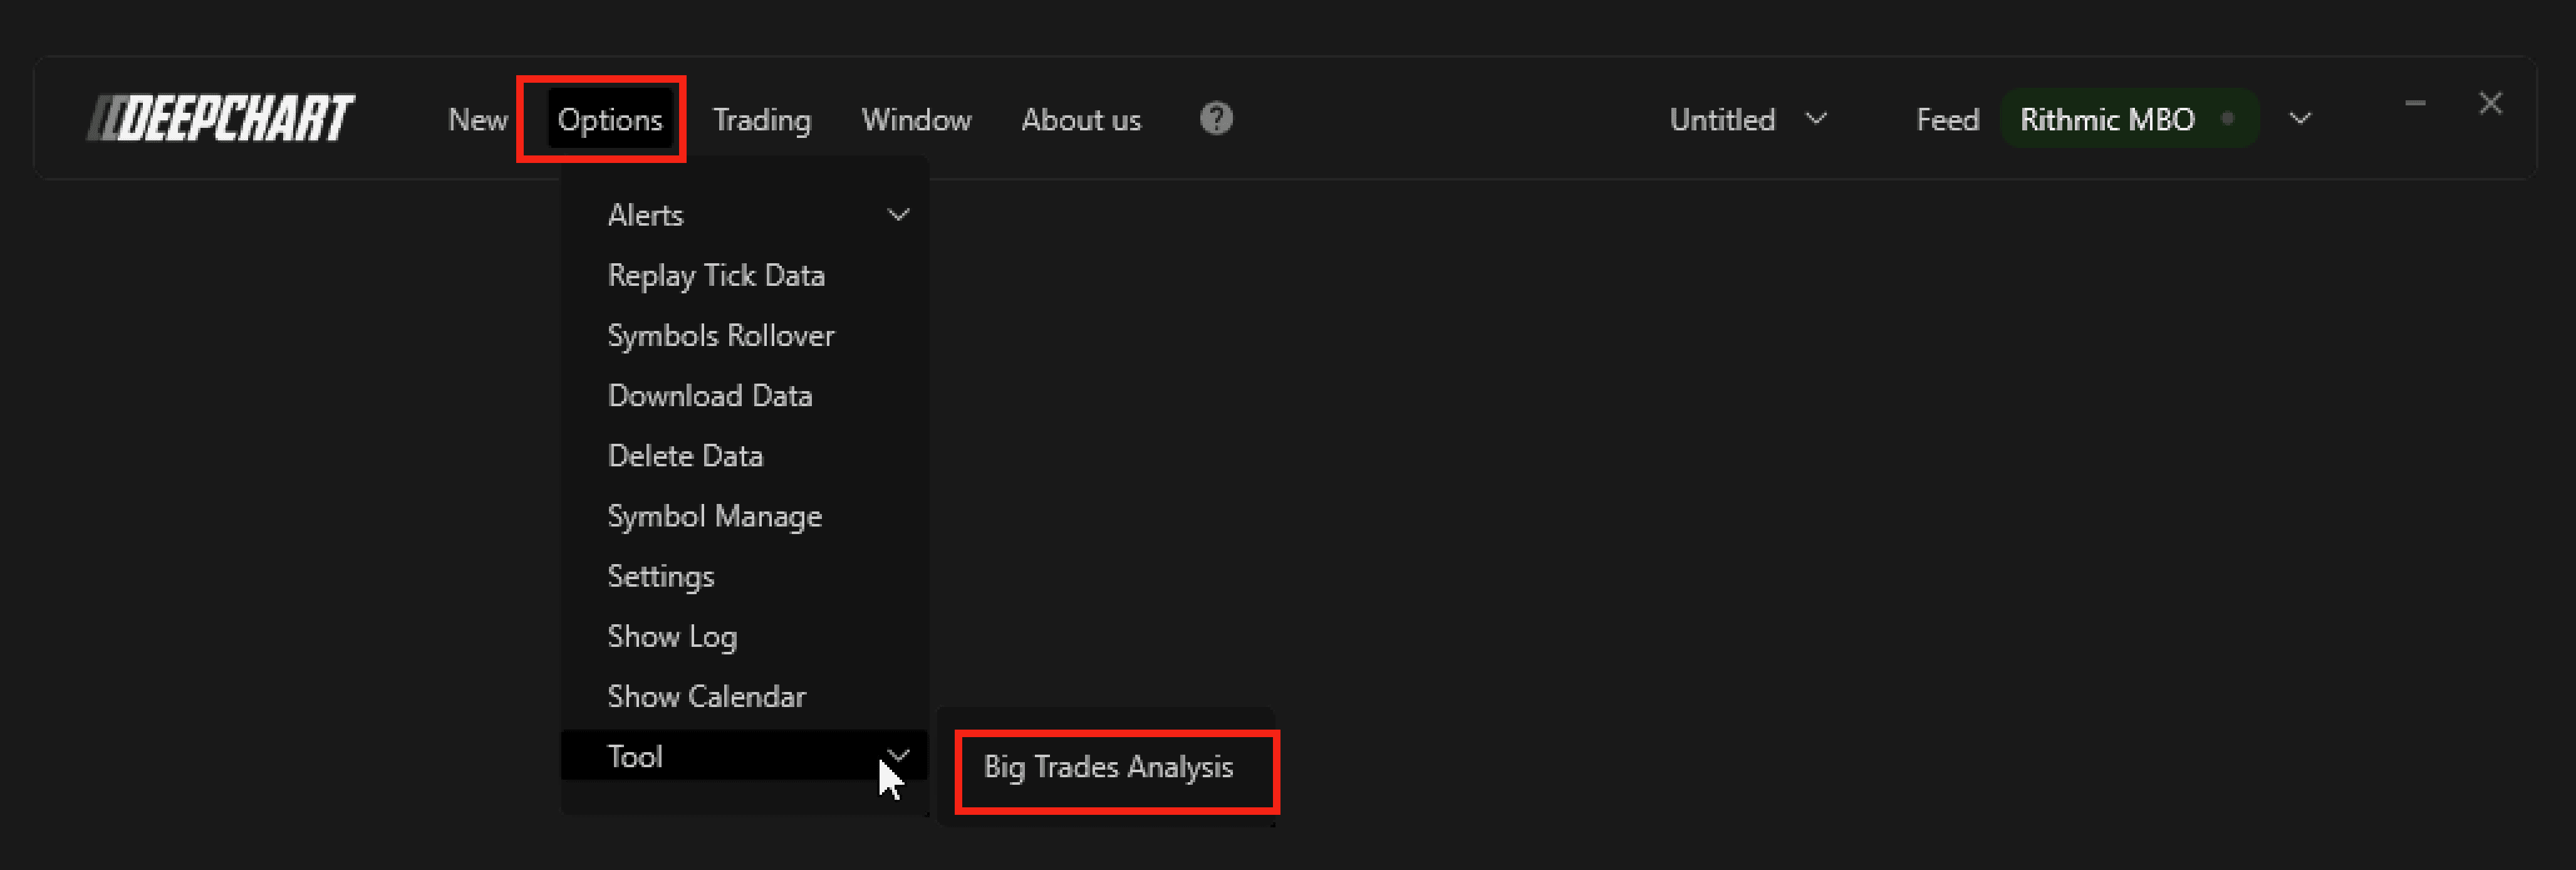
Go to Options → Tools → Big Trades Analysis
Run the analysis
Reload or restart the chart if results do not appear immediately
Once completed, the indicator will automatically apply optimized thresholds to your charts.