Indicators
Updated:
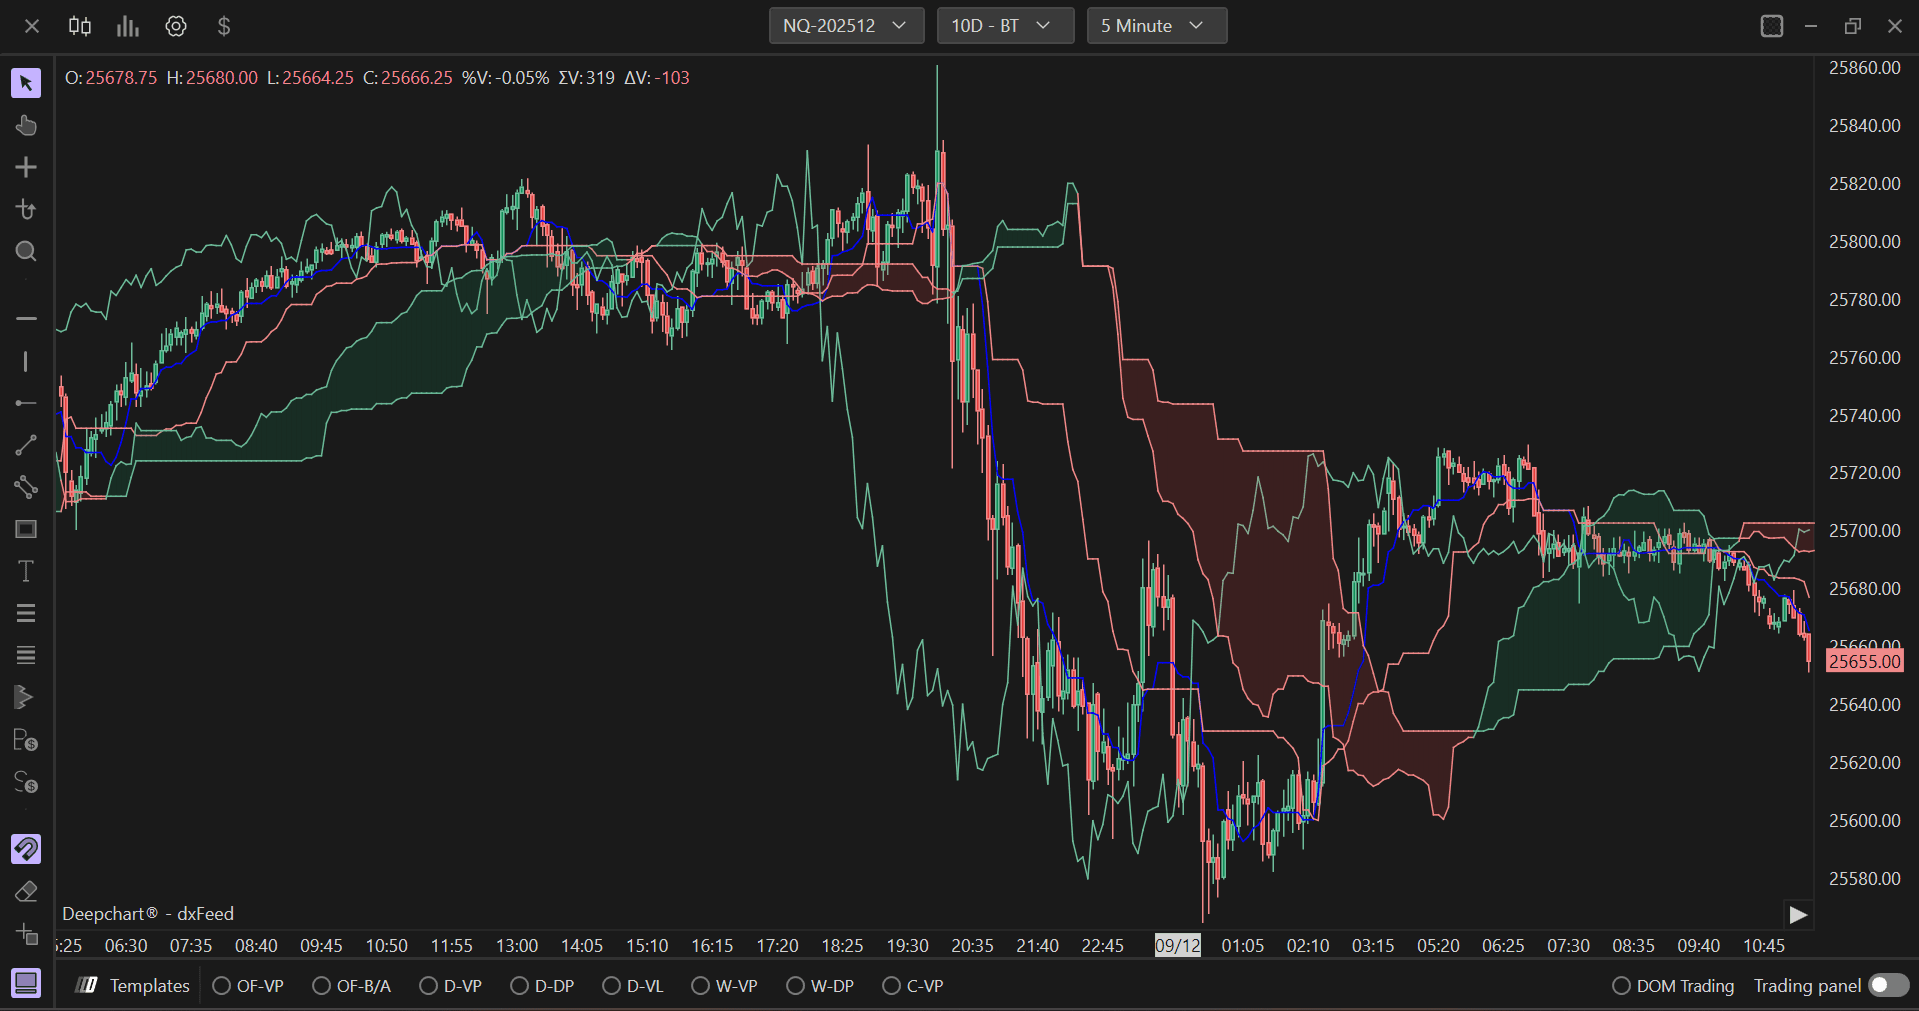
The Ichimoku indicator, also known as "Ichimoku Kinko Hyo," is a technical analysis tool developed by Japanese journalist Goichi Hosoda in the 1930s. It is a comprehensive technical analysis tool that allows you to identify support and resistance, determine trend, and measure momentum.
The indicator consists of 4 main lines and a cloud called "Kumo."
Ichimoku Components
Tenkan-sen (Conversion Line): Calculated as the average of the highs and lows of the last 9 periods. Serves as a short-term indicator for trend direction.
Kijun-sen (Baseline): The average of the highs and lows of the last 26 periods. It acts as support/resistance and can be used to identify potential trend changes.
Chikou Span (Delay Line): Represents the closing price moved back 26 periods. It is used to compare the current price with past price movement.
Senkou Span: Calculated as the average of Tenkan-sen and Kijun-sen, projected forward 26 periods. It forms one of the two lines that create the "cloud" (Kumo).
Using Settings
Clicking on the indicator settings icon will open its configuration window, within which you can make several choices regarding the indicator's functionality.
Parameters
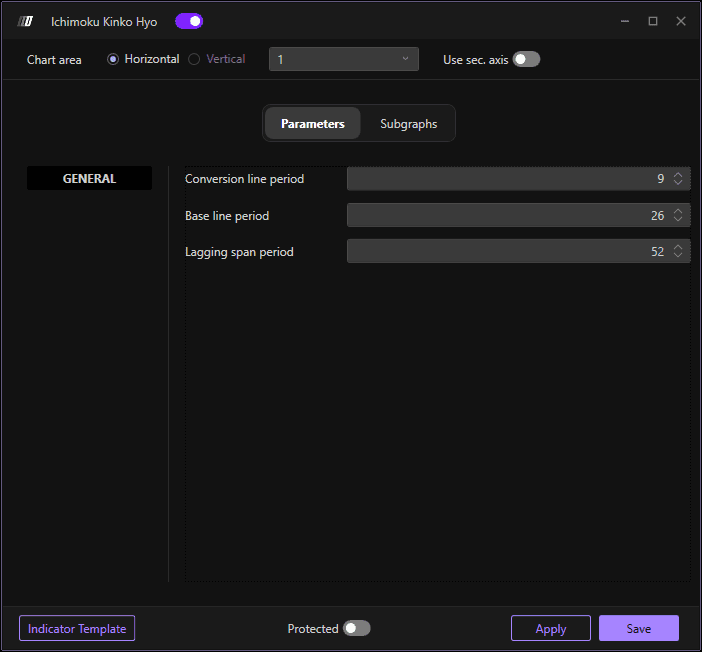
In the Parameters section you can set the period of:
Conversion Line Period: Period for the Tenkan-sen calculation (default: 9 periods)
Baseline Period: Period for the Kijun-sen calculation (default: 26 periods)
Lagging Span Period: Period for the Chikou Span calculation (default: 26 periods)
Subgraphs
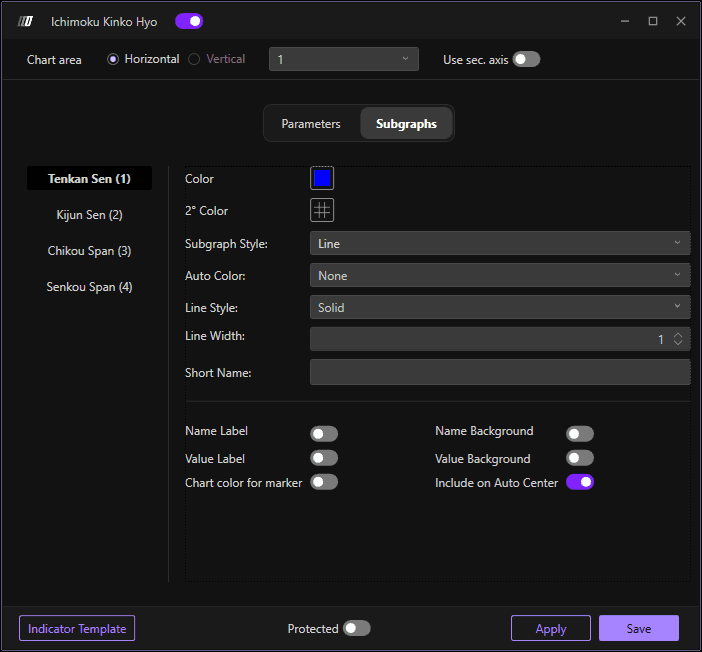
In the Subgraphs section you can set the colors and style of:
Tenkan-sen Color: Set the color of the conversion line
Kijun-sen Color: Set the color of the baseline
Chikou Span Color: Set the color of the delay line
Senkou Span Color: Set the color of the cloud lines
Subgraph Style: Choose the display style
Line Style: Define the line style
Line Width: Define the thickness of the lines
Use Secondary Axis: Option to display on a secondary axis