Indicators
Updated:
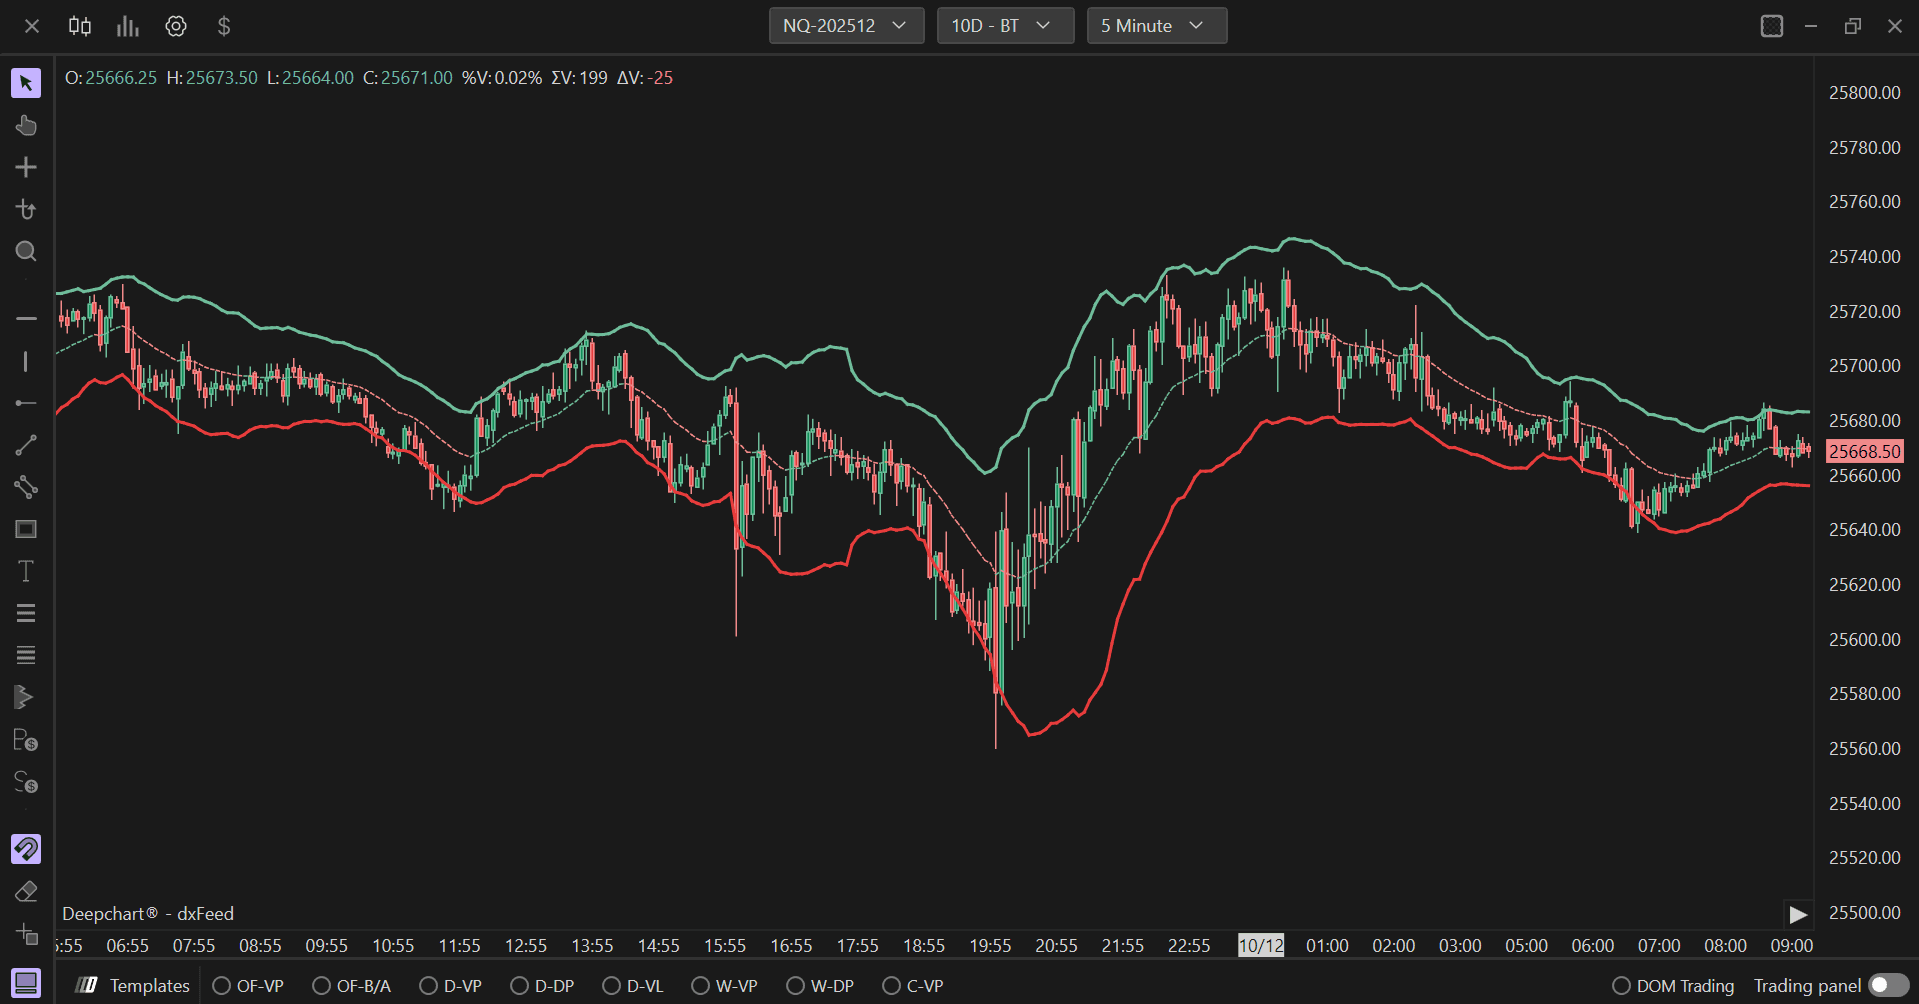
The Keltner Channel indicator is a classic technical analysis indicator developed by Chester Keltner in 1960. It is a technical analysis indicator that is used to identify trends, volatility, and possible areas of reversal in the price of an asset.
The Keltner Channel consists of three lines: a center line (exponential moving average, EMA) and two outer bands that move above and below the center line at a distance proportional to the ATR (Average True Range).
Using Settings
Clicking on the indicator settings icon will open its configuration window, within which you can make several choices regarding the indicator's functionality.
Parameters

In the Parameters section you can select:
ATR Multiplier Value: The value used to multiply the ATR for determining the distance of the outer bands from the center line (default: 2.00)
Input: The price data to use for calculation (Close, Open, High, Low and volume)
Length: The number of periods for the channel average calculation (default: 21 periods)
Subgraphs

In the Subgraph section, you can change the style and colors of:
Keltner Avg Color: Set the color of the center line (EMA)
Secondary Color: Set an optional secondary color
Keltner Up Color: Set the color of the upper band
Keltner Down Color: Set the color of the lower band
Subgraph Style: Choose the display style
Line Style: Define the line style
Line Width: Define the thickness of the lines
Use Secondary Axis: Option to display on a secondary axis