Indicators
Updated:
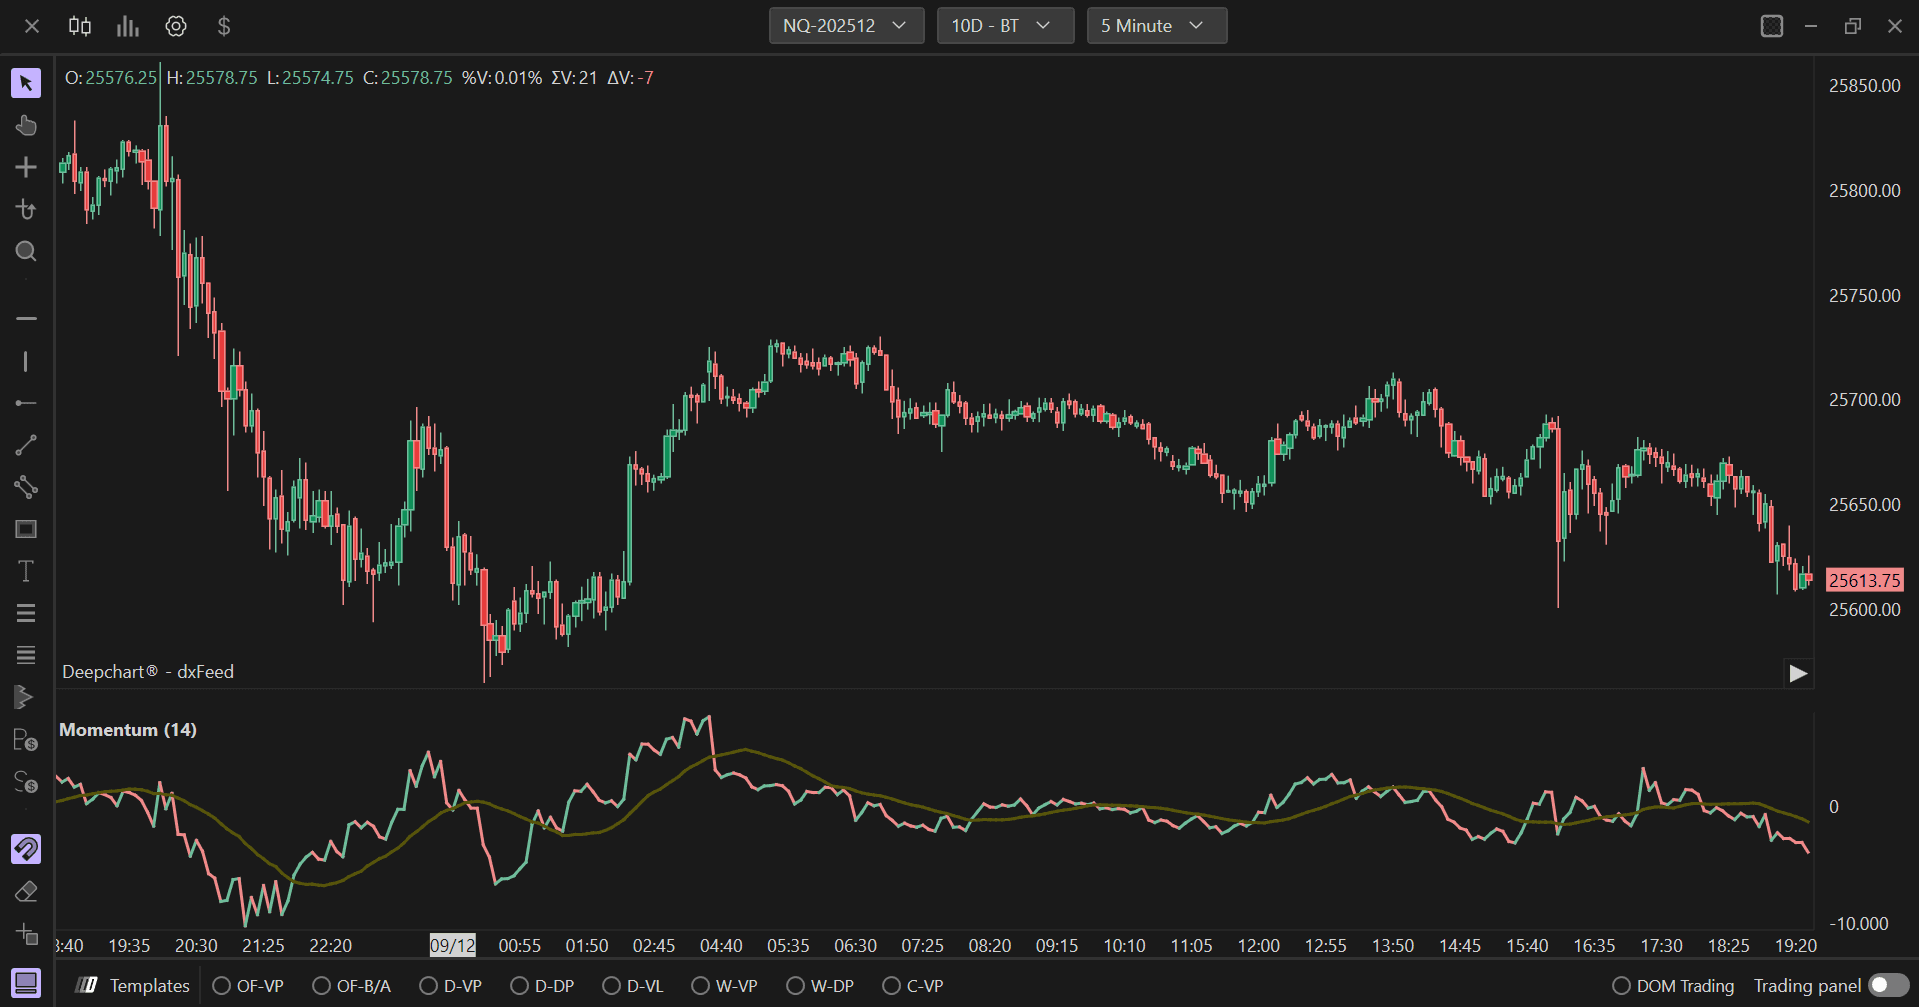
The Momentum indicator is a technical analysis indicator that measures the speed or pace of an asset's price movements. The main objective is to assess how fast a price is changing from a previous period, providing information about the strength of a trend and signaling potential reversals. Momentum is particularly useful for identifying the acceleration or deceleration phases of a trend.
Using Settings
Clicking on the indicator settings icon will open its configuration window, within which you can make several choices regarding the indicator's functionality.
Parameters
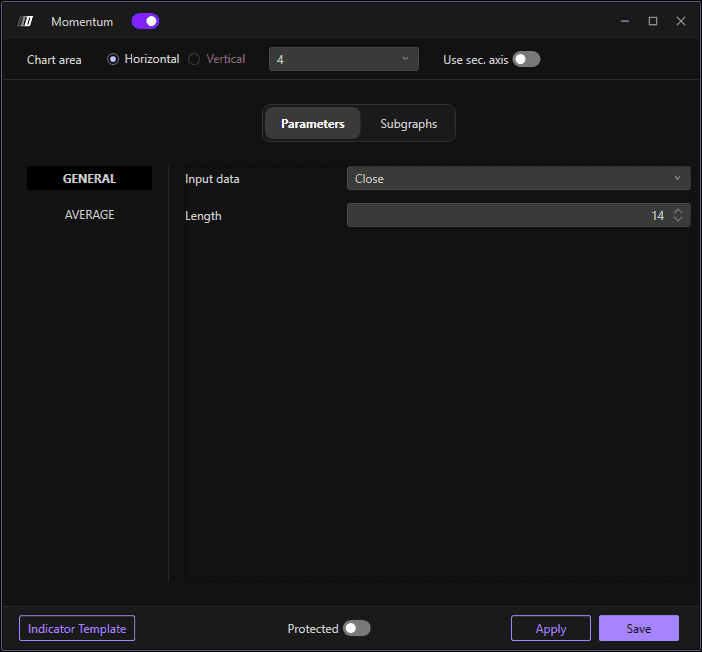
The Parameters section is divided into two sub-sections:
General
Where you can change:
Input Data: The price data to use for calculation (Close, Open, High, Low and Volume)
Length: The number of periods for momentum calculation (default: 14 periods)
Average
Where you can:
Enable: Toggle the average line on or off
Average Type: Choose the type of averaging (Simple, Exponential, Triangular and Weighted)
Periods: Set the number of periods for the average calculation (default: 20 periods)
Subgraphs

In the Subgraph section you can change colors and style of the indicator and its reference average:
Momentum Color: Set the color of the momentum line
Average Color: Set the color of the average line
Secondary Color: Set an optional secondary color
Subgraph Style: Choose the display style
Line Style: Define the line style
Line Width: Define the width of the lines
Use Secondary Axis: Option to display on a secondary axis