Indicatori
Updated:
Rileva aree di confluenza aggregando:
Livelli del Volume Profile (POC, Value Area, Picchi, Valli)
Swing di Price Action (massimi e minimi)
Livelli di ritracciamento del trend
Quando diversi di questi elementi si allineano entro un intervallo di prezzo definito, l'indicatore evidenzia tali zone come potenziale supporto o resistenza.
Configurazione dell'indicatore
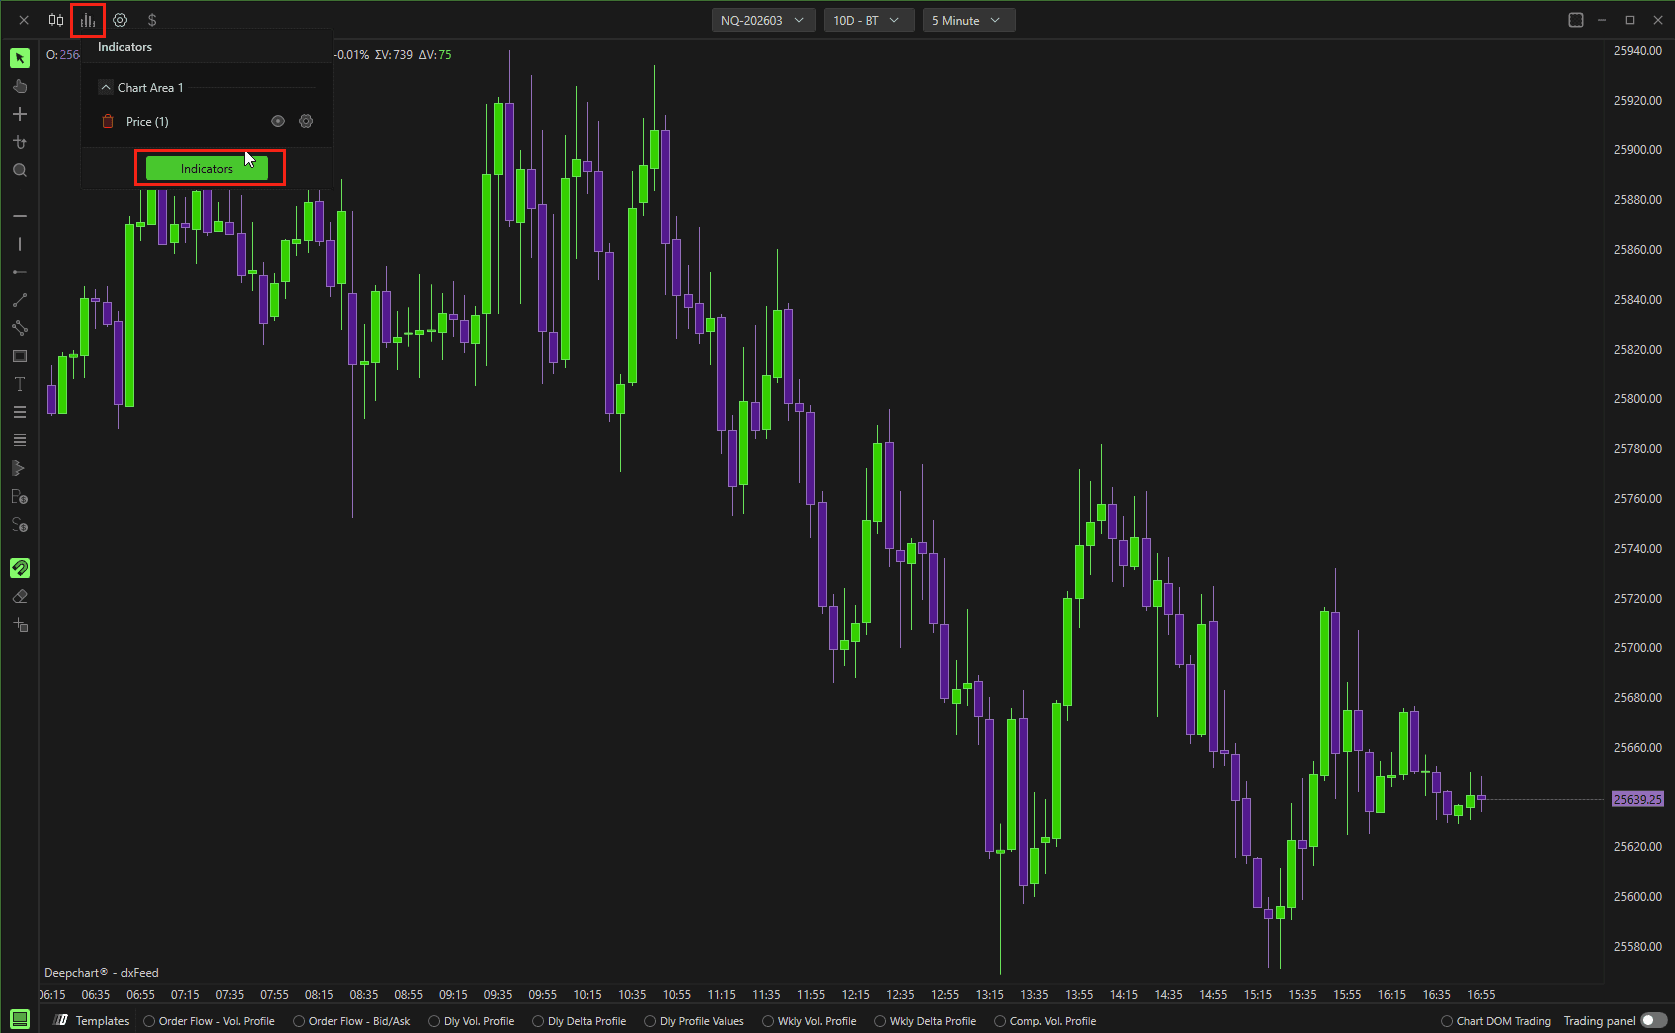
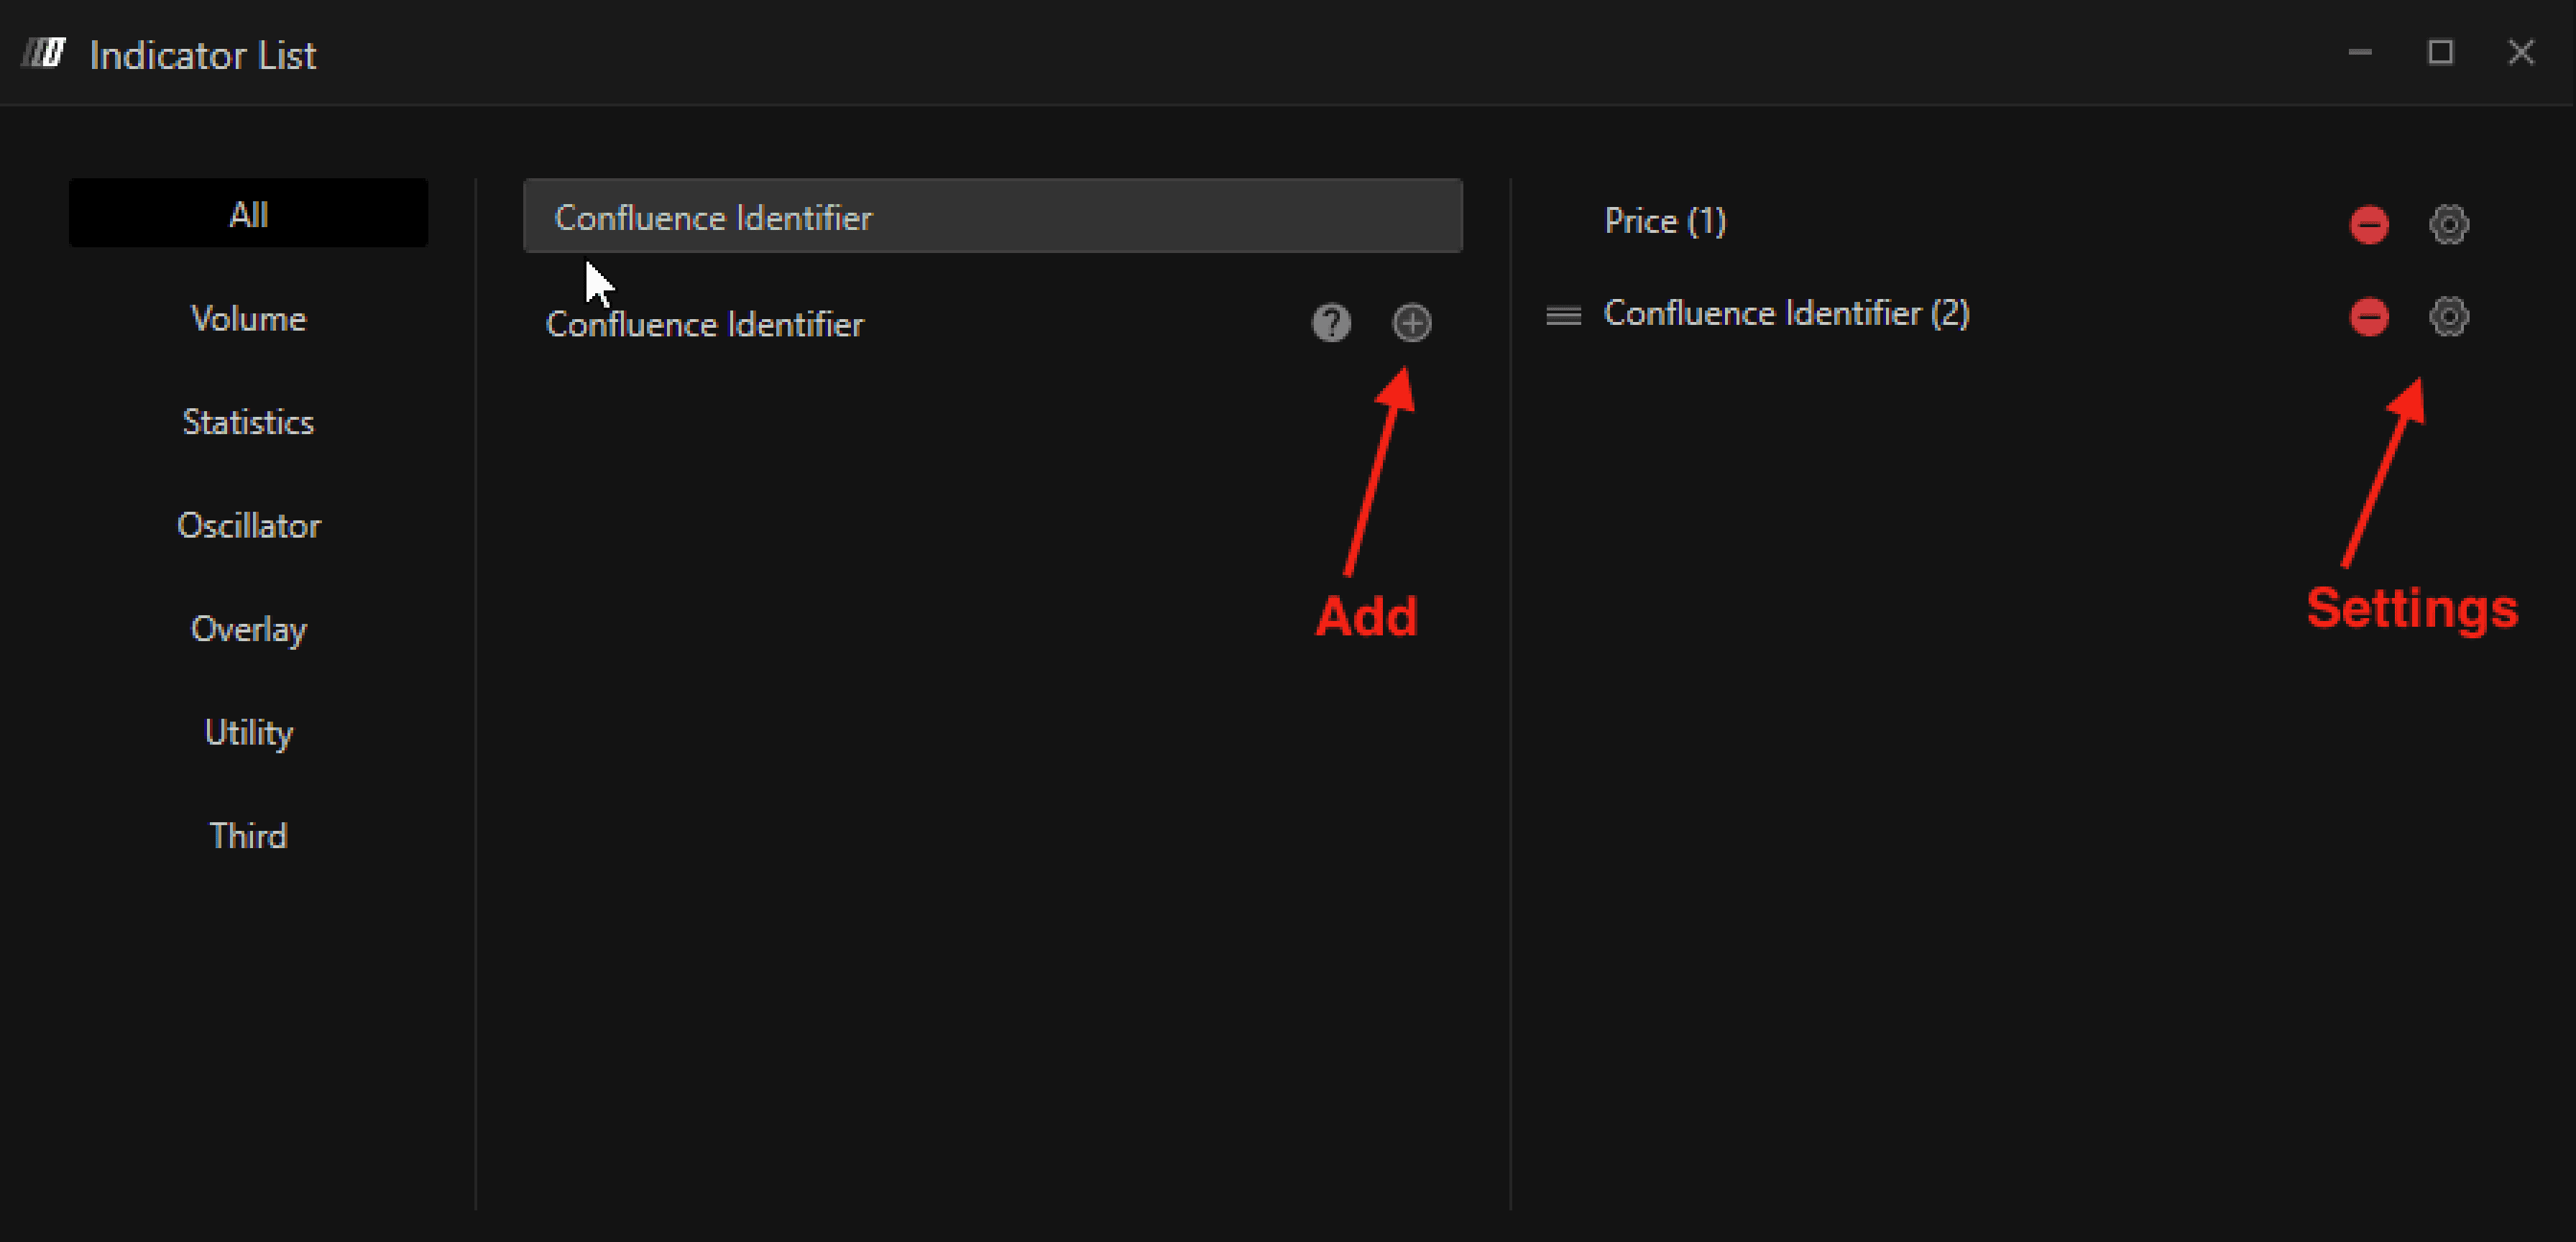
Per aggiungere il Confluence Identifier:
Apri il menu Indicatori
Aggiungi Confluence Identifier
Fai clic sull'icona Impostazioni per configurare l'indicatore
Impostazioni dati
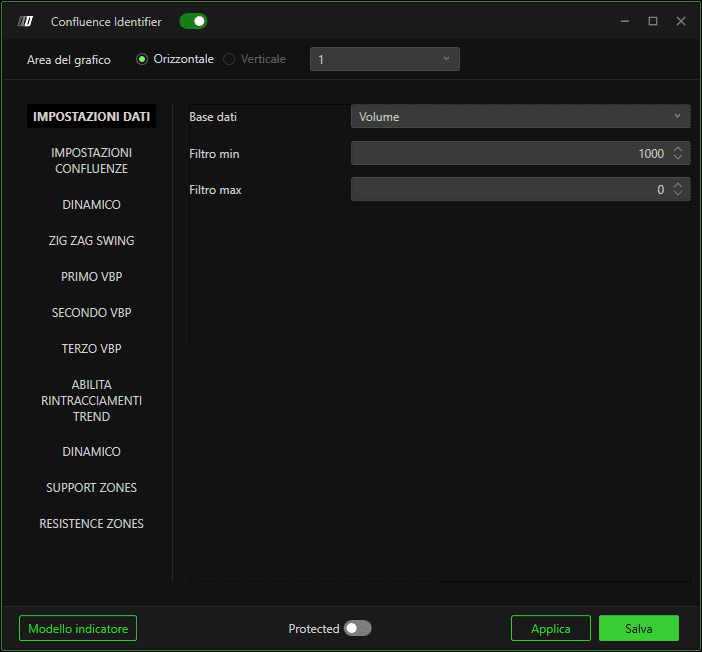
Dati in input
Definisce la sorgente dati usata per i calcoli:
Volume
Misura il volume scambiato a ciascun livello di prezzo.Ordini
Misura il numero di ordini eseguiti.
Impostazioni filtro
Filtro minimo
Applica una soglia minima per escludere i valori insignificanti.
Filtro massimo
Applica una soglia massima.
Se impostato su 0, non viene applicato alcun filtro massimo.
Impostazioni di confluenza
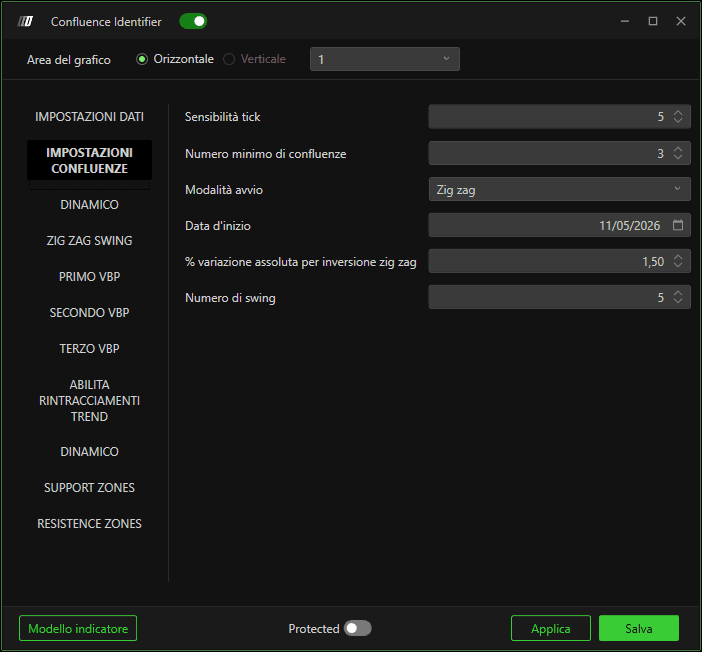
Sensibilità tick
Definisce l'intervallo di prezzo (in tick) entro il quale i diversi elementi devono allinearsi per essere considerati una confluenza.
Valori più bassi = zone più precise
Valori più alti = zone più ampie
Numero minimo di confluenze
Specifica quanti elementi devono allinearsi per generare una zona di confluenza.
Valori più alti → meno zone, ma più forti
Valori più bassi → zone più frequenti
Modalità di avvio
Definisce come viene determinato il punto di inizio del calcolo:
Zig Zag
Utilizza gli swing di prezzo basati sulla logica Zig Zag.Data
Avvia i calcoli da una data specifica.
Data di inizio
Definisce la data da cui iniziano i calcoli di confluenza (usata quando è selezionata la modalità Data).
Percentuale assoluta di inversione per il trend Zig Zag
Definisce l'inversione di prezzo minima necessaria per identificare un punto di swing nel trend Zig Zag.
Numero di swing
Specifica quanti swing vengono considerati per determinare il punto di inizio del calcolo.
Impostazioni swing Zig Zag
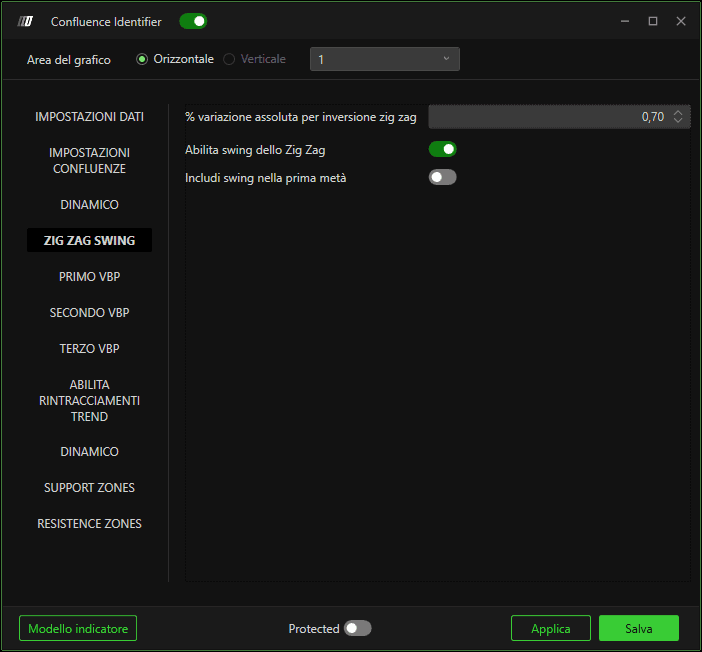
Variazione assoluta % per l'inversione Zig Zag
Definisce la percentuale di inversione di prezzo necessaria per identificare massimi e minimi di swing.
Nota importante:
Il primo Zig Zag viene usato solo per determinare la data di inizio del calcolo e può usare una percentuale più alta.
Il secondo Zig Zag identifica gli swing usati per le confluenze e dovrebbe usare una percentuale più bassa per includere gli swing minori.
Abilita swing Zig Zag
Include massimi e minimi di swing nel calcolo della confluenza.
Includi gli swing nella prima metà
Abilitato: include i punti di swing più vecchi (meno recenti)
Disabilitato: considera solo gli swing più recenti
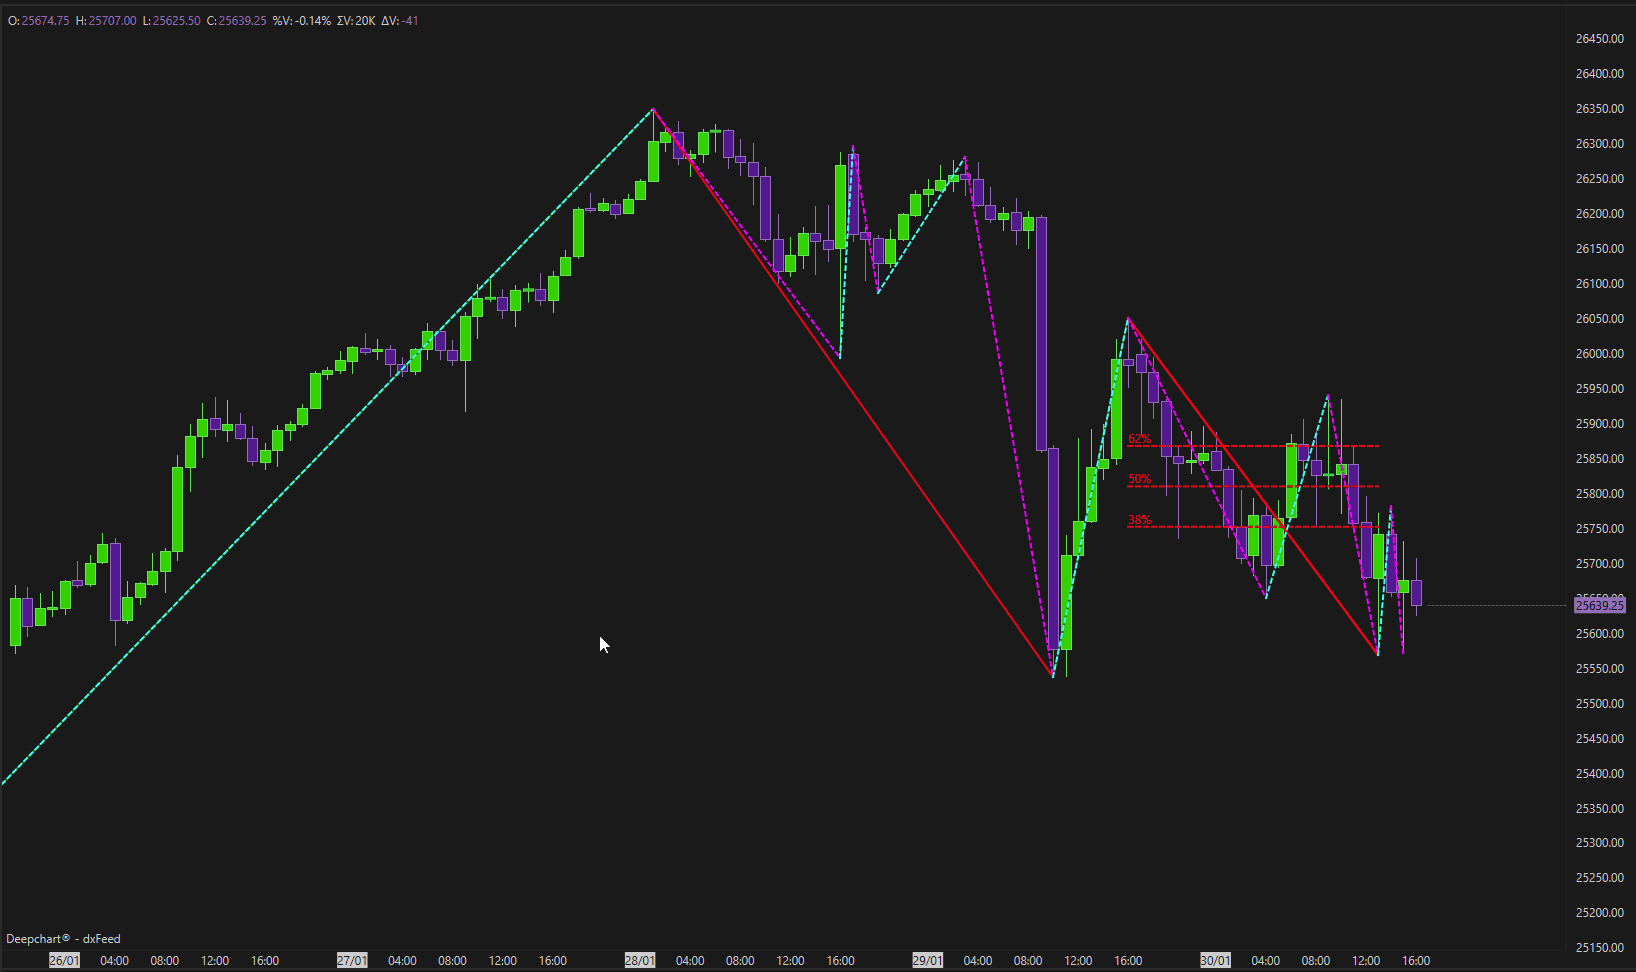
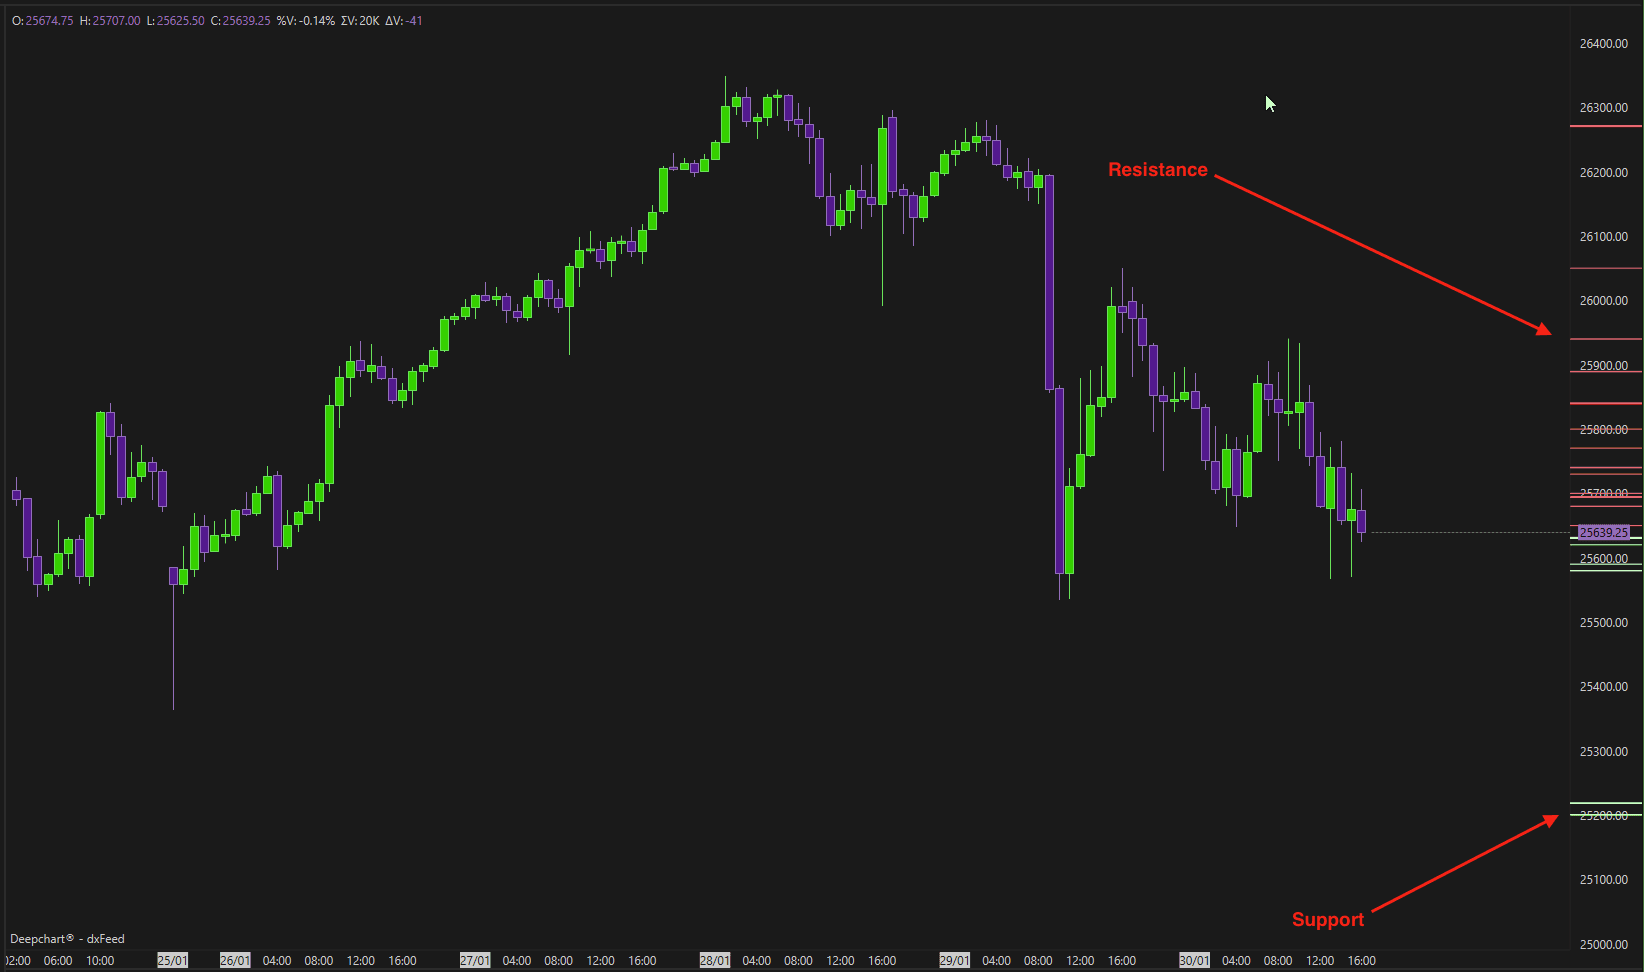
Spiegazione dell'esempio
Nell'esempio mostrato:
Sono abilitati solo gli swing Zig Zag
Le confluenze sono calcolate usando solo la price action
La linea verticale grigia segna l'inizio del calcolo
La data di inizio viene determinata usando 9 swing con una inversione del 3%
Gli swing di confluenza usano un'inversione dell'1%
Le zone vengono evidenziate quando almeno 3 swing si allineano entro 5 tick
Le zone verdi rappresentano la resistenza, le zone rosse rappresentano il supporto.
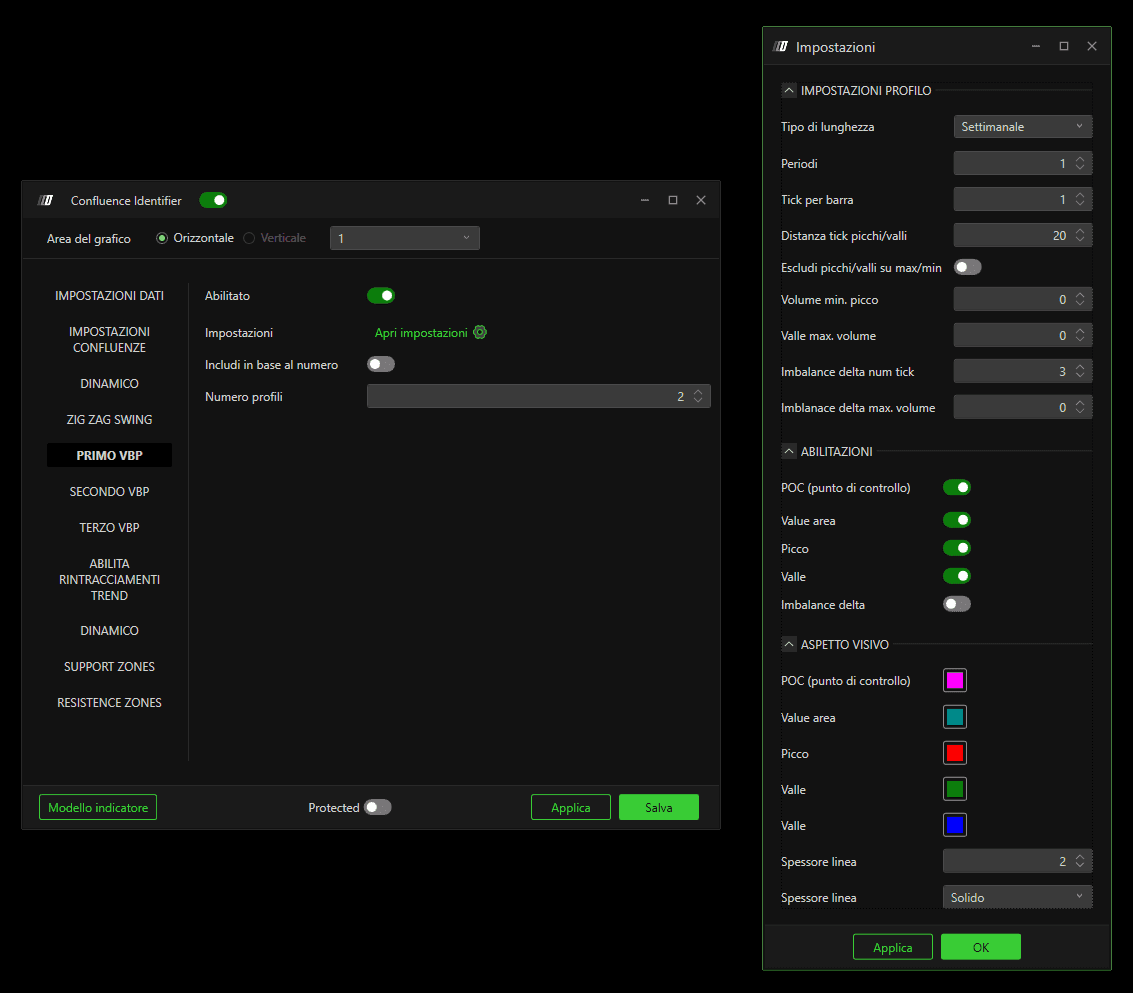
Primo / Secondo / Terzo Volume By Price (VBP)
Puoi abilitare fino a tre profili Volume By Price separati.
Abilita
Attiva il Volume Profile selezionato.
Impostazioni del profilo
Consente di configurare:
Tipo di profilo: Daily, Weekly, Monthly, Composite
Raggruppamento dei tick
Volume minimo per i picchi
Volume massimo per le valli
Opzioni aggiuntive specifiche del profilo
Elementi abilitabili
Scegli quali elementi VBP partecipano ai calcoli di confluenza:
Point of Control (POC)
Value Area
Picchi
Valli
Delta Imbalances
Aspetto visivo
Personalizza:
Colori
Spessore linea
Stile linea
Includi per numero
Abilitato: viene considerato solo un numero fisso di profili recenti
Disabilitato: vengono usati tutti i profili dalla data di inizio del calcolo
Numero di profili
Definisce quanti profili vengono inclusi quando l'opzione sopra è abilitata.
Abilitazioni ritracciamento trend
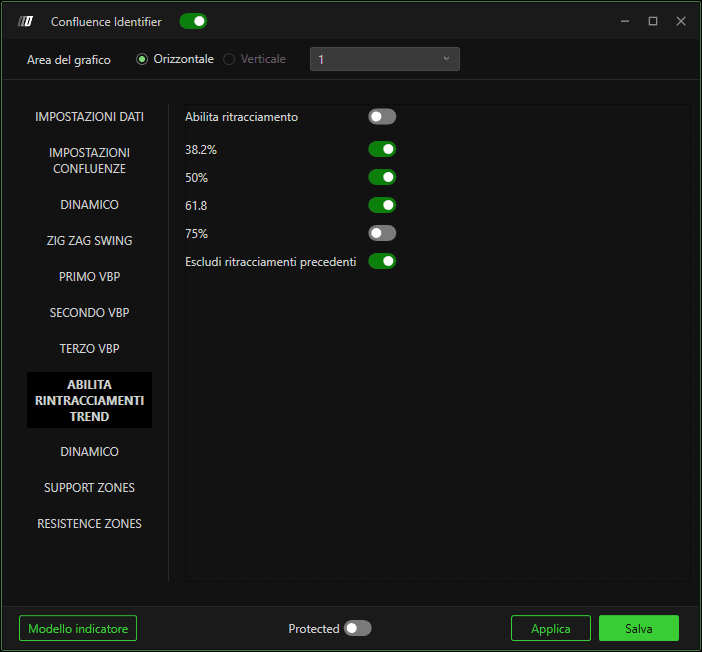
Abilita ritracciamenti
Aggiunge i livelli di ritracciamento dello swing principale ai calcoli di confluenza:
38.2%
50%
61.8%
75%
Escludi i ritracciamenti precedenti
Abilitato: vengono usati solo i ritracciamenti dello swing più recente
Disabilitato: vengono inclusi anche i ritracciamenti precedenti
Impostazioni di sviluppo
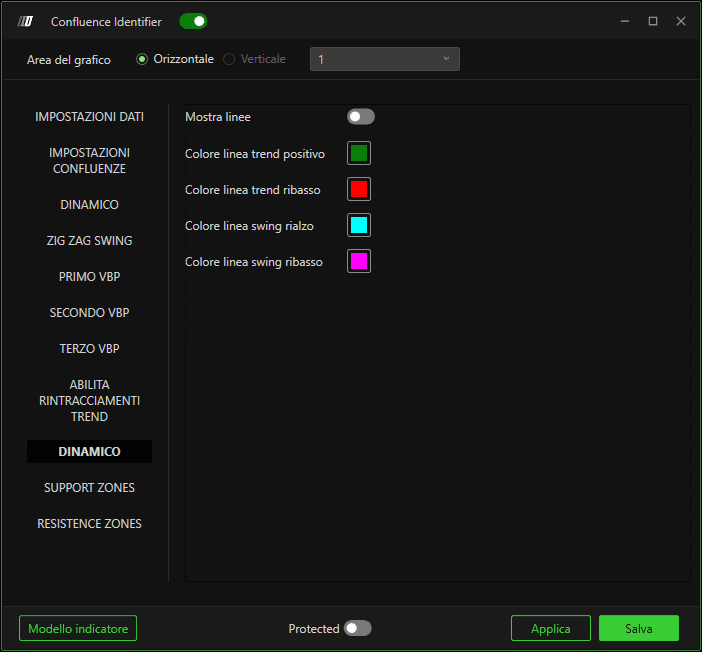
Consente di:
Mostrare le linee Zig Zag
Personalizzare i colori per gli swing rialzisti e ribassisti
Questo aiuta a distinguere visivamente la struttura del mercato direttamente sul grafico.
Colori di supporto e resistenza
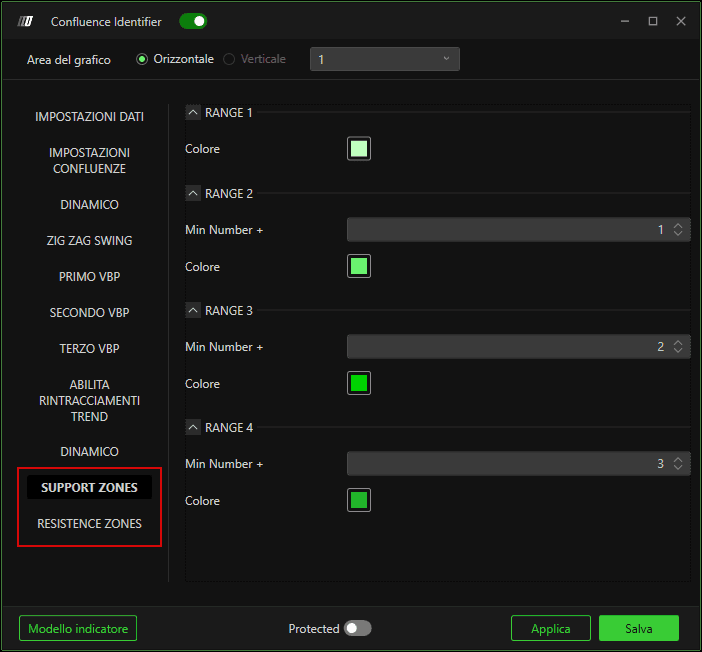
Personalizza i colori delle zone di supporto e resistenza in base al numero di confluenze che compongono ciascuna zona.
Le zone più forti (con più confluenze) possono essere evidenziate visivamente.
Buone pratiche e note
Man mano che vengono abilitati più elementi (più VBP, swing, ritracciamenti), si consiglia di:
Aumentare il numero minimo di confluenze
Ridurre la sensibilità in tick
Questo garantisce che vengano evidenziate solo le zone di prezzo più significative.
Nell'esempio mostrato:
Tre Volume Profile (Daily, Weekly, Composite)
Swing di prezzo
Ritracciamenti dell'ultimo swing
Minimo 5 confluenze
Sensibilità di 3 tick
Per un grafico più pulito, puoi disattivare le linee VBP e visualizzare i Volume Profile usando indicatori separati.