Indicatori avanzati
Updated:
Deep Pattern Builder è l’indicatore più avanzato della suite DeepCharts. Ti consente di costruire una logica di trading completamente personalizzata usando condizioni relazionali e di eseguire automaticamente il backtest di tali condizioni tramite il motore di simulazione integrato.
Per comprendere correttamente questo indicatore, dobbiamo prima capire i concetti fondamentali alla base della creazione delle condizioni e il modo in cui più condizioni vengono combinate per formare una logica di trading complessa.
1. Comprendere la logica delle condizioni
Ogni condizione in Deep Pattern Builder è costruita usando:
Tipi di input
Operatori matematici
Operatori logici
Modalità di combinazione delle condizioni
Analizziamoli passo dopo passo.
Tipi di input
Esistono tre tipi di input:
1. Riferimento
Questo tipo di input ti consente di fare riferimento a diversi componenti di una candela, tra cui:
Open, Close, High, Low, Bid Volume, Bid NT, Ask Volume, Ask NT, Total Volume, Total NT, Delta Volume, Delta NT, Low–High Ticks, Open–Close Ticks, POC Price %, POC Total Volume, POC on Shadow, Cumulative Delta Volume.
2. Indicatore
Questo tipo di input ti consente di recuperare dinamicamente i valori da un altro indicatore applicato al grafico (spiegato più avanti in questo articolo).
3. Costante
Un valore numerico predefinito che inserisci manualmente.
Operatori matematici
Gli operatori matematici disponibili sono:
+(Addizione)(Sottrazione)
x(Moltiplicazione)/(Divisione)
Operatori logici
Gli operatori logici definiscono la relazione tra due valori calcolati:
>Maggiore di>=Maggiore o uguale a=Uguale a<>Diverso da<Minore di<=Minore o uguale a
Creazione di condizioni semplici
Iniziamo con un semplice esempio usando input costanti.
Supponiamo:
Input A = 40
Input B = 30
Possiamo valutare:
A > B → Vero
A < B → Falso
A = B → Falso
A <> B → Vero
A >= B → Vero
A <= B → Falso
Puoi usare fino a quattro input in una singola condizione:
Esempio:
A + B > C + D
A − B < C + D
Con quattro input e combinazioni di operatori, si possono creare centinaia di strutture logiche.
Esempio con i dati della candela
Applichiamo ora la stessa logica usando dati di mercato reali.
Supponiamo:
A = Open (input di Riferimento)
B = Close (input di Riferimento)
Condizione:
A − B = 10
Se una candela apre a 100 e chiude a 90:
100 − 90 = 10
La condizione diventa Vera.
Questo significa che abbiamo appena definito una regola che rileva una candela ribassista da 10 tick. In base a questa condizione, possiamo tracciare un marker (cerchio, quadrato, ecc.) sul grafico.
Esempio usando un altro indicatore
Possiamo anche recuperare i valori da un altro indicatore.
Ad esempio:
A = Delta da Deep Stats
Condizione:
A = -30
Questa condizione diventa vera ogni volta che una candela ha un delta di −30, indicando vendite aggressive. In tal caso, è possibile tracciare un marker sul grafico ogni volta che ciò accade.
2. Combinare più condizioni
Deep Pattern Builder consente di combinare più condizioni usando:
OR
AND
AND + OR (Avanzato)
Combinazione OR
Se:
Condizione 1 = Vero
Condizione 2 = Falso
Combinazione = Condizione1 OR Condizione2
Risultato = Vero
(Ne basta una sola che sia vera.)
Combinazione AND
Combinazione = Condizione1 AND Condizione2
Il risultato è Vero solo se entrambe le condizioni sono vere.
Esempio di combinazione avanzata
Puoi combinare fino a quattro condizioni:
Combinazione = (Condizione1 OR Condizione2) AND (Condizione3 OR Condizione4)
Se:
Condizione1 = Vero
Condizione2 = Falso
Condizione3 = Falso
Condizione4 = Falso
Allora:
(Vero AND Falso) OR (Falso AND Falso)
Falso AND Falso
Risultato = Falso
3. Come applicare Deep Pattern Builder
Per prima cosa, applica l’indicatore Deep Trades al grafico.
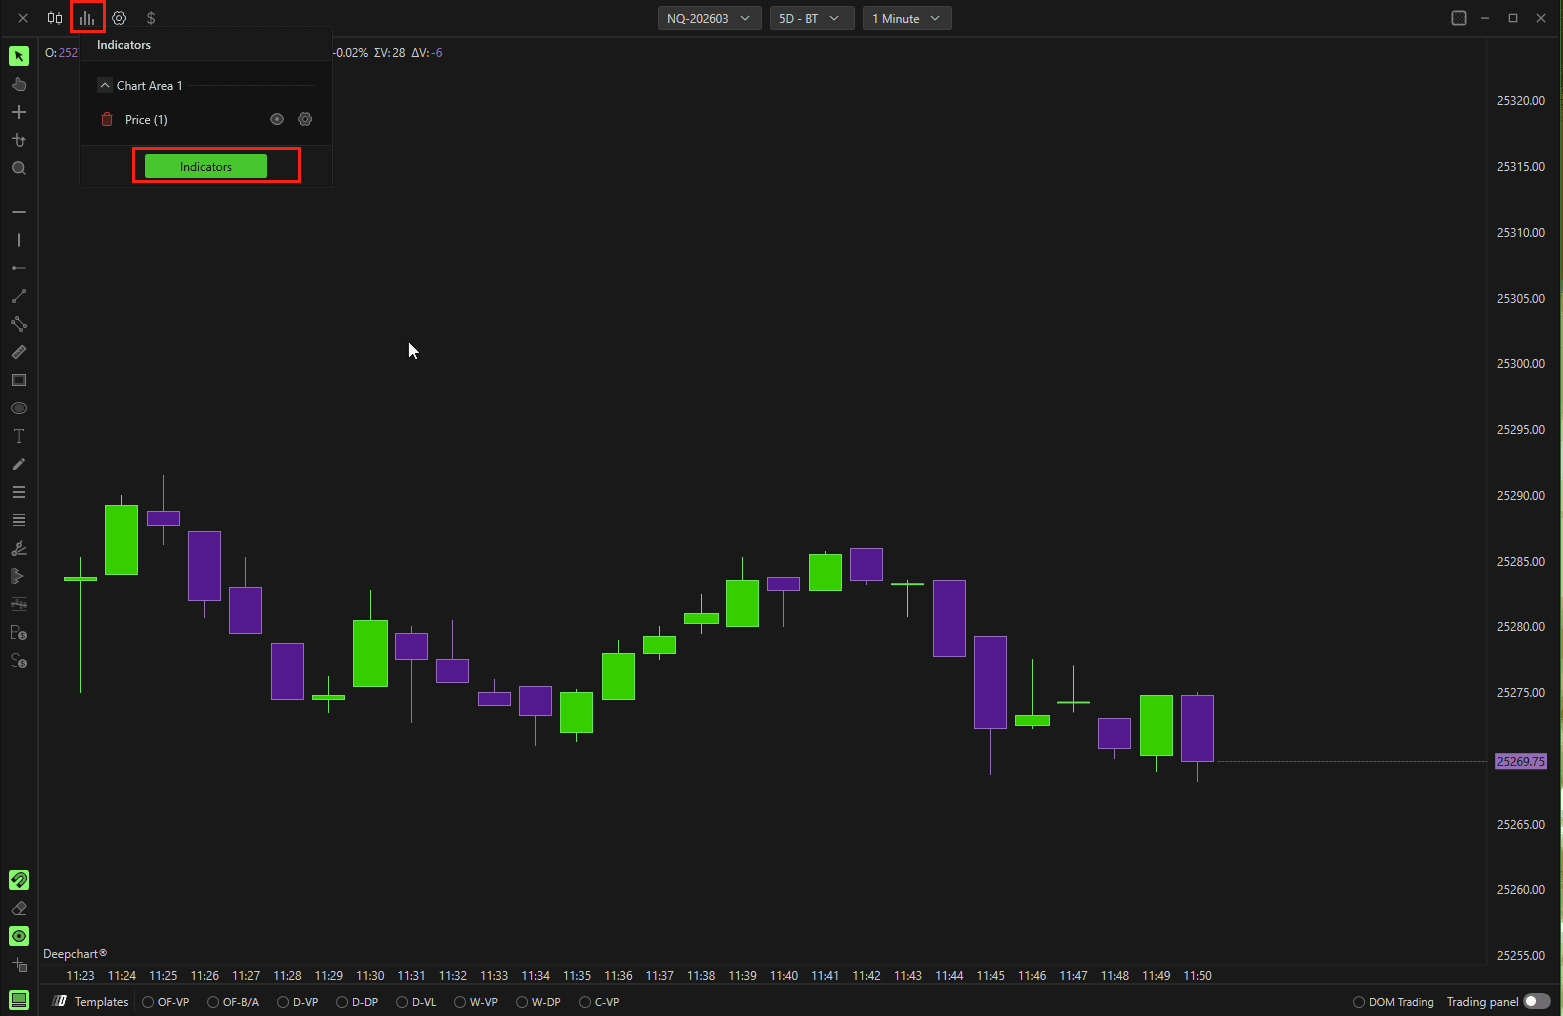
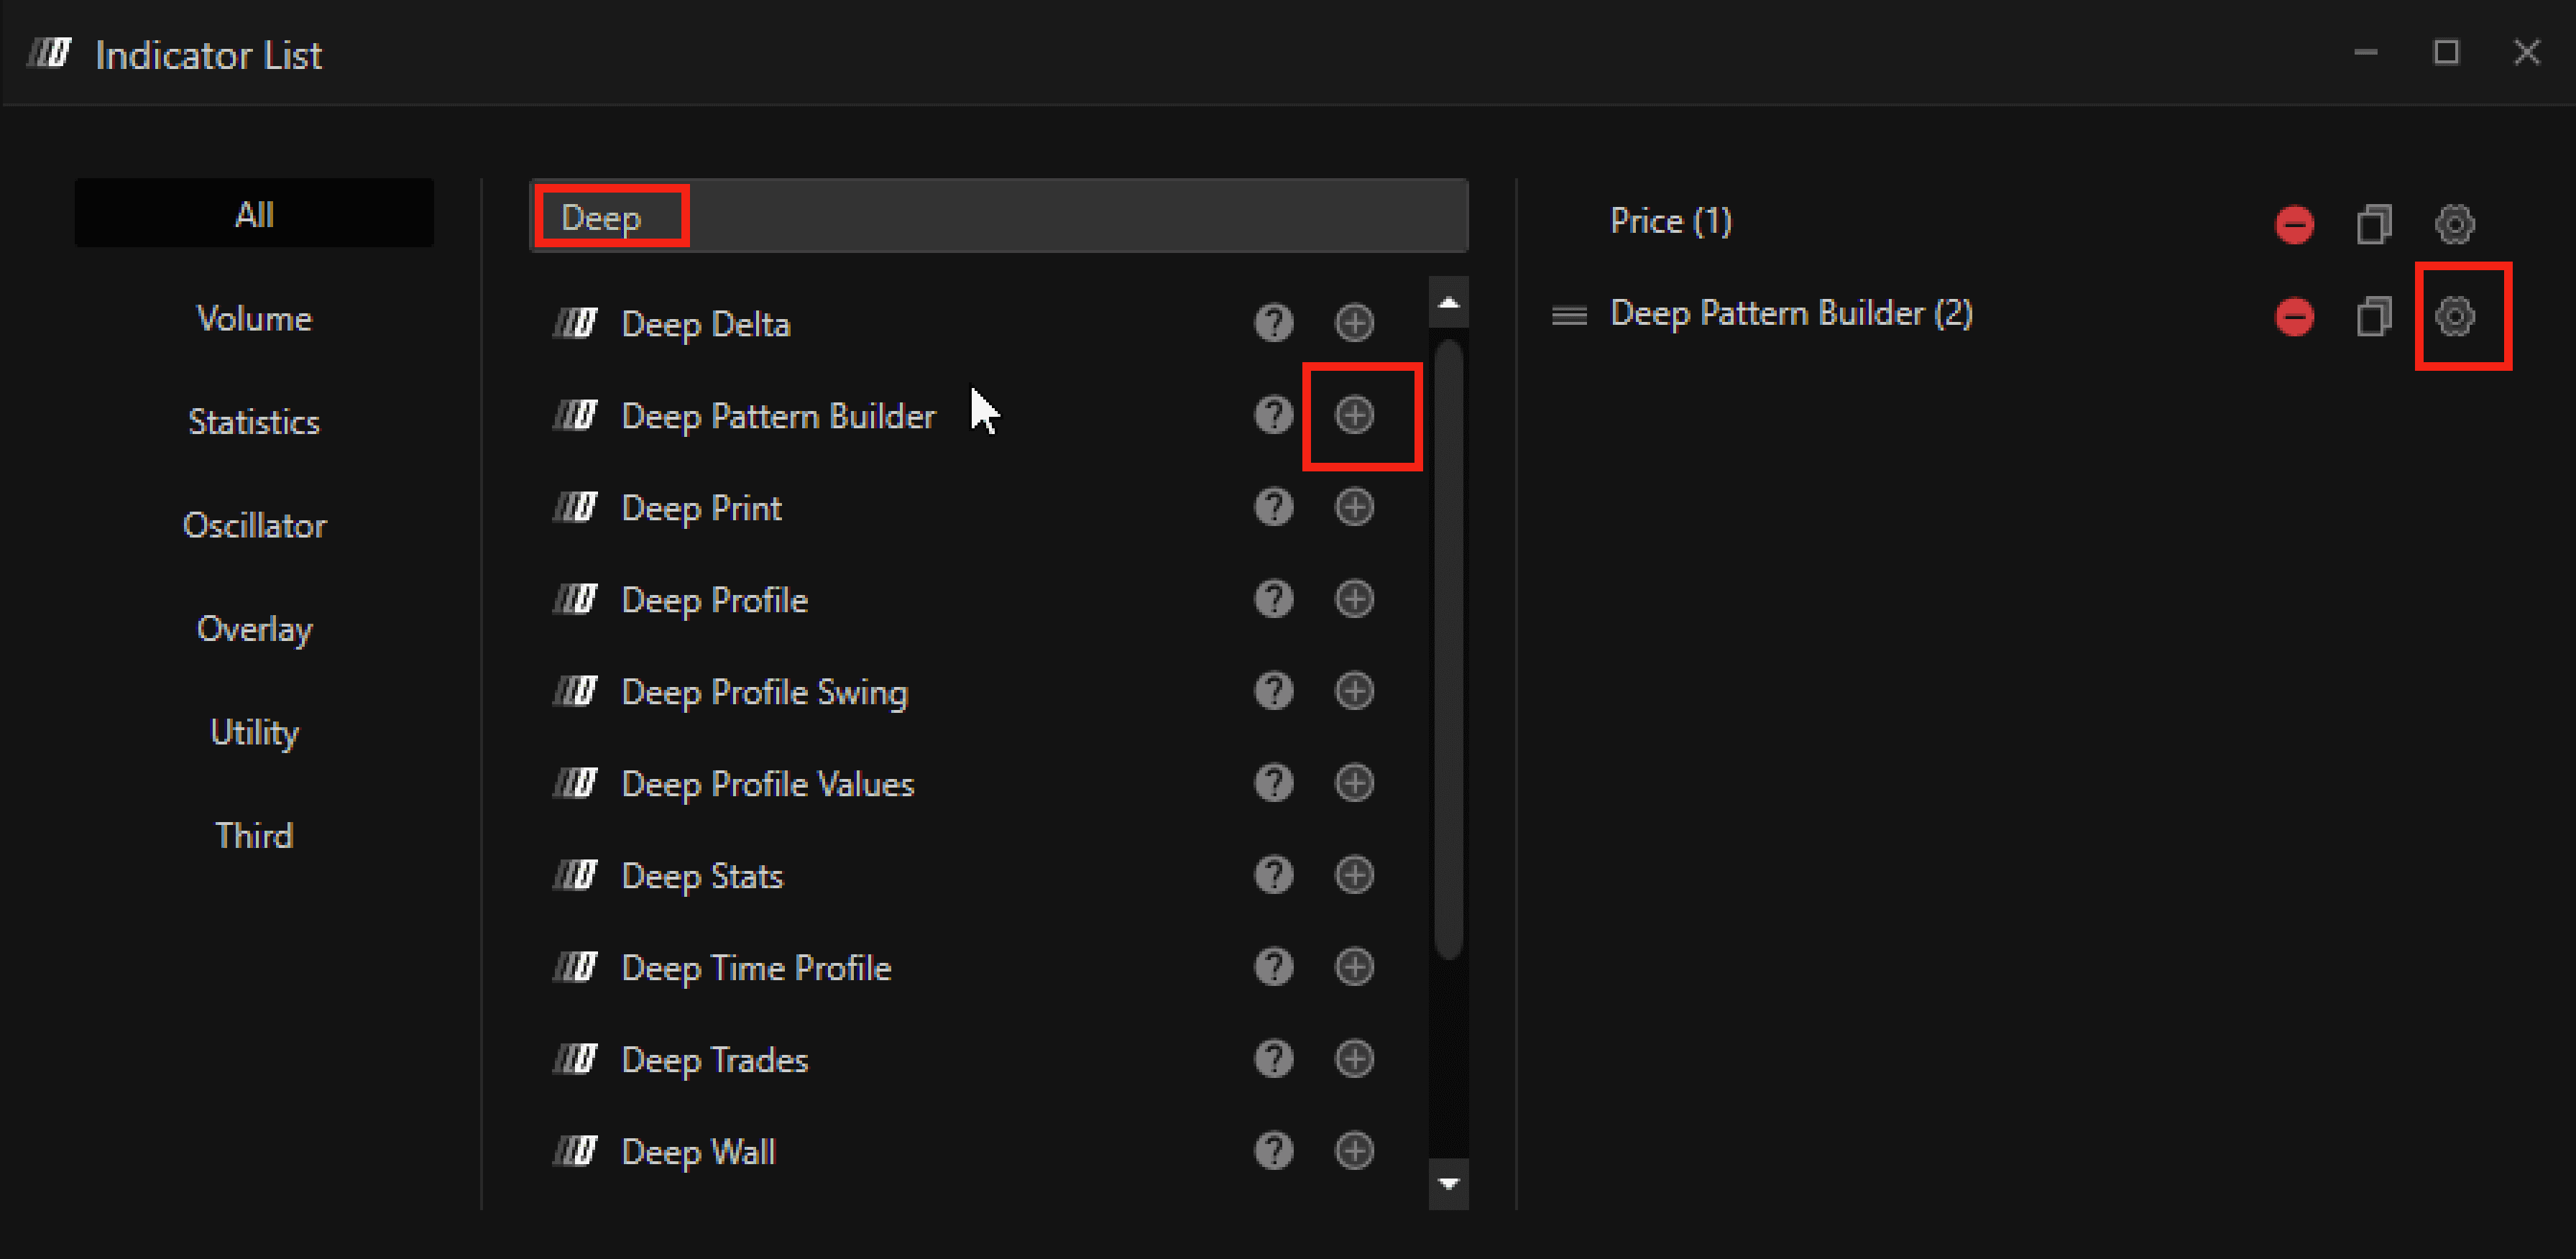
Fai clic sull’icona dell’indicatore sul grafico.
Cerca Deep Pattern Builder.
Fai clic sul pulsante + per aggiungerlo.
Fai clic sull’icona delle impostazioni per configurarlo.
4. Impostazioni spiegate (passo dopo passo)
Sezione Condizioni
Ci sono 4 condizioni che puoi impostare
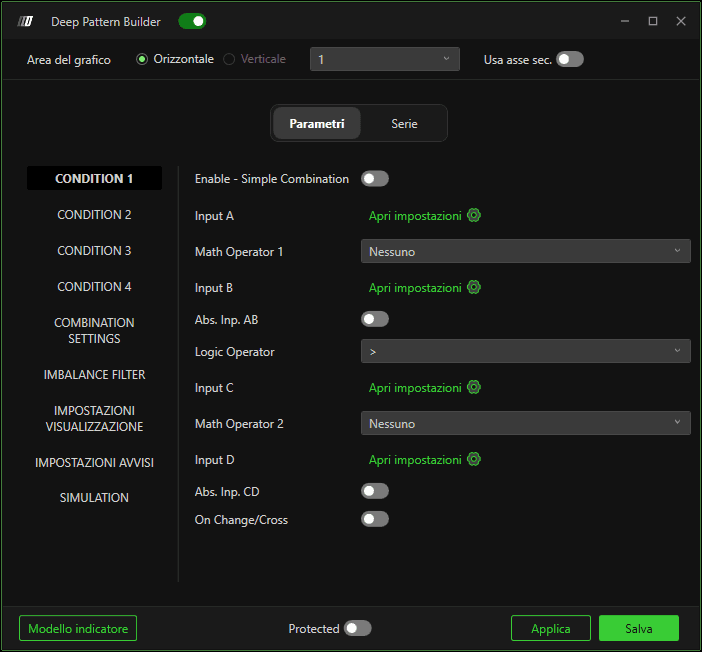
Abilita – Combinazione semplice
Abilita la condizione.
Input (A, B, C, D)
Ogni condizione consente quattro input.
Fai clic sull’icona delle impostazioni accanto a ciascun input per configurarlo:
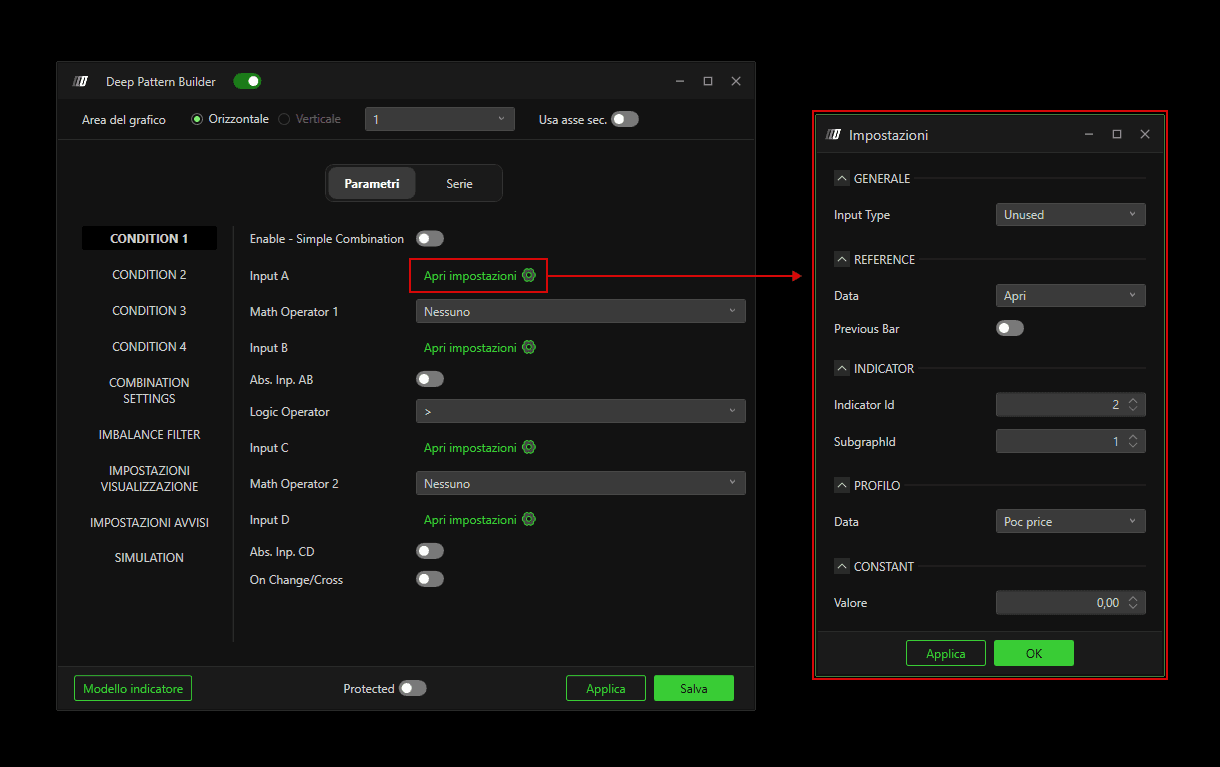
Tipo di input
Opzioni:
Non usato – Disabilita l’input

Riferimento – Usa i valori della candela
Indicatore – Recupera i dati da un altro indicatore
Costante – Usa un valore numerico fisso
Impostazioni input di Riferimento
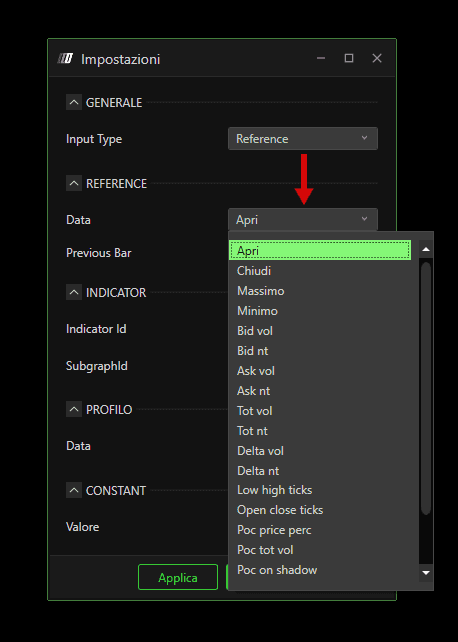
Quando selezioni Riferimento, puoi scegliere:
Open, Close, High, Low, Bid Volume, Bid NT, Ask Volume, Ask NT, Total Volume, Total NT, Delta Volume, Delta NT, Low–High Ticks, Open–Close Ticks, POC Price %, POC Total Volume, POC on Shadow, Cumulative Delta Volume.
Barra precedente
Se abilitato, il valore verrà caricato dalla candela precedente invece che da quella corrente.
Impostazioni input Indicatore

Consente il recupero dinamico dei dati da un altro indicatore.
ID indicatore – L’ID dell’indicatore sul grafico.
ID sottografico – La linea di valore specifica che vuoi richiamare.
Esempio:
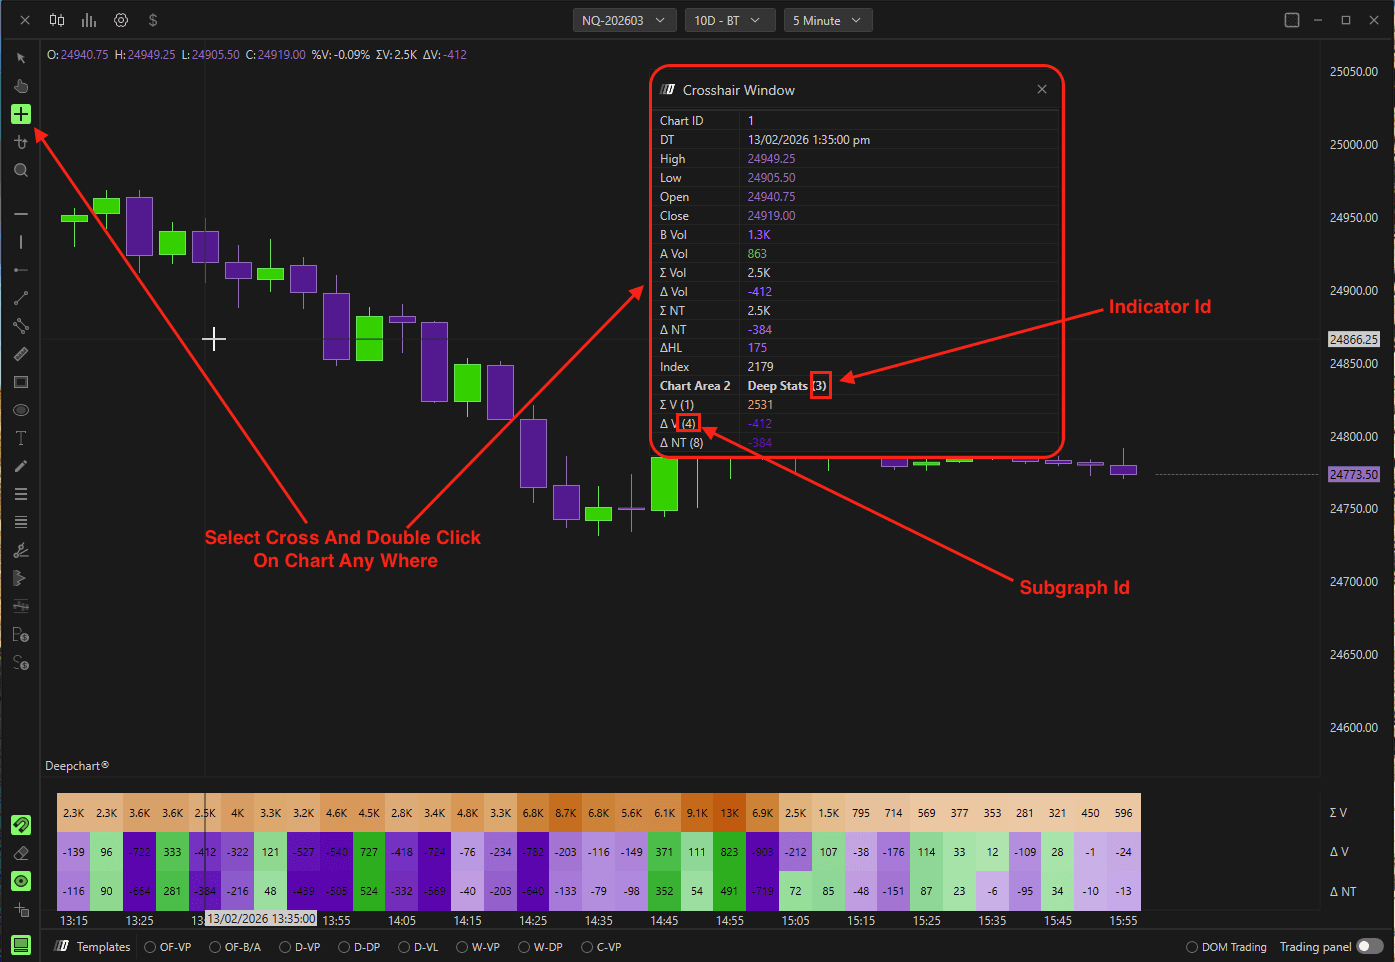
Per caricare il Delta da Deep Stats:
Aggiungi Deep Stats al grafico.
Apri le sue impostazioni.
Individua l’ID indicatore e l’ID sottografico.
Inserisci questi valori in Deep Pattern Builder.
Input costante

Consente l’inserimento manuale di un valore numerico predefinito.
Operatore matematico 1 & 2

Operatore matematico 1: tra Input A e B
Operatore matematico 2: tra Input C e D
Operatore logico
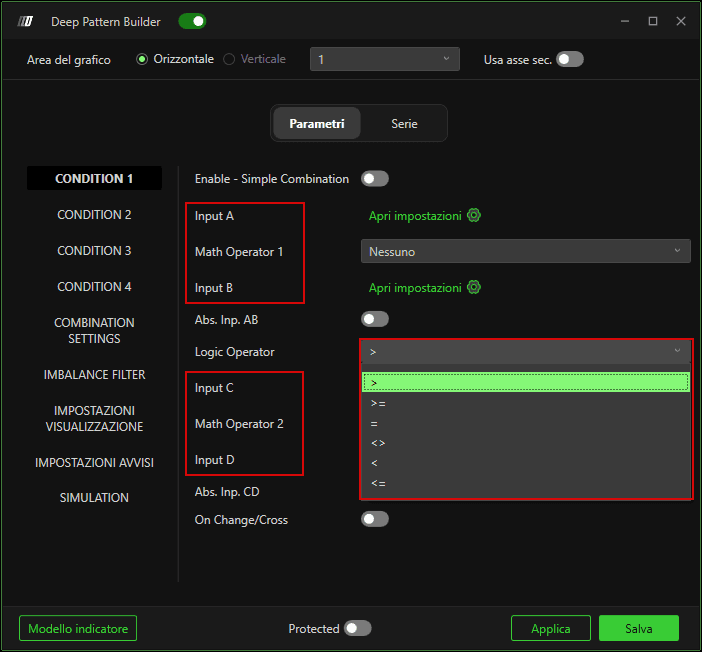
Posizionato tra il blocco AB e il blocco CD.
Definisce il confronto finale tra i due risultati calcolati.
5. Modalità di combinazione delle condizioni
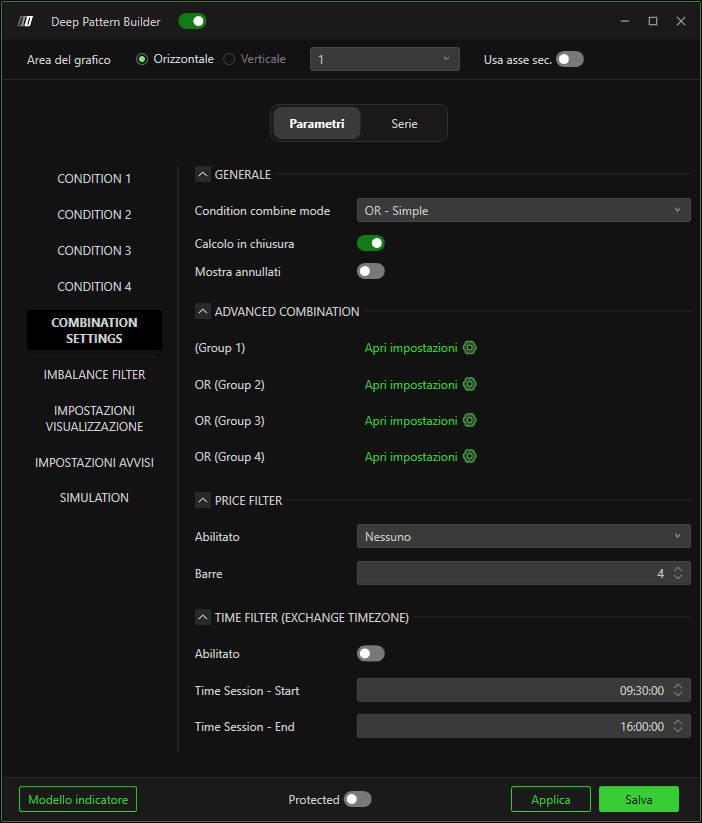
Si trova sotto Impostazioni combinazione.
OR – Semplice
Tutte le condizioni abilitate vengono combinate usando OR.
Esempio con 3 condizioni:
Condizione1 OR Condizione2 OR Condizione3
AND – Semplice
Condizione1 AND Condizione2 AND Condizione3
AND + OR – Avanzato
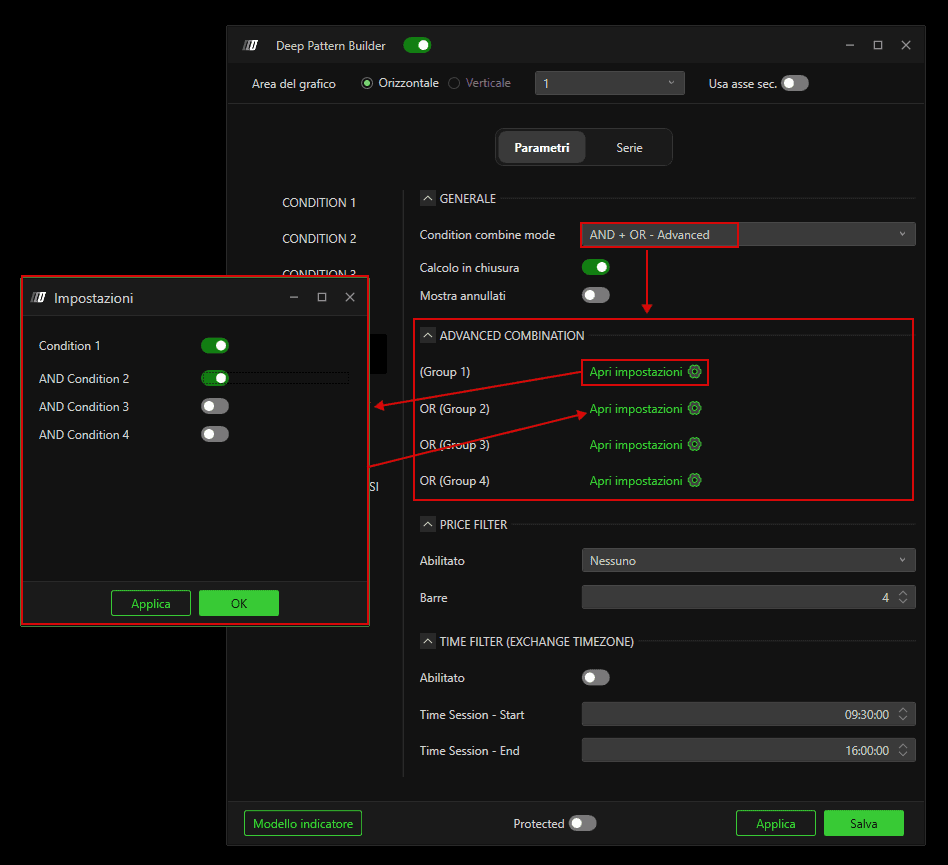
Condizione1 AND Condizione2 AND Condizione3
Calcola alla chiusura
Se abilitato, le condizioni vengono valutate solo dopo la chiusura della candela.
6. Filtro di Imbalance
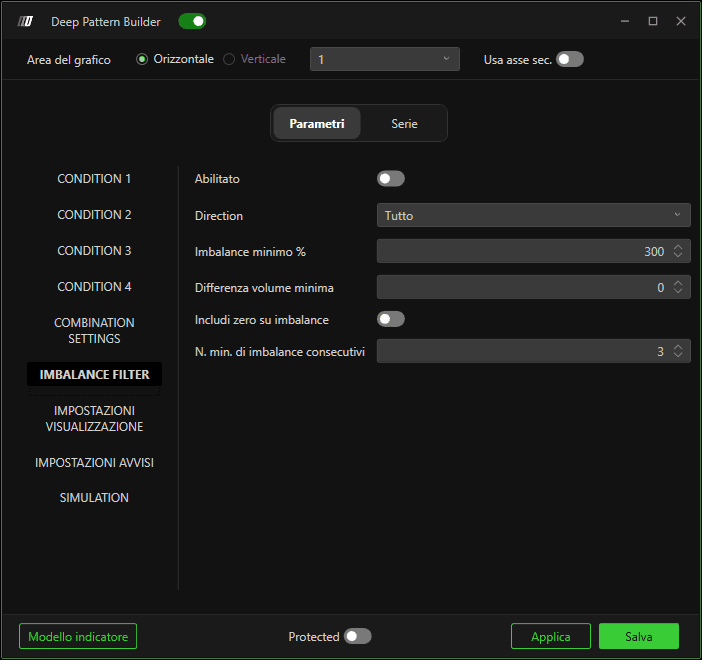
Puoi aggiungere filtri di imbalance direttamente da questa sezione.
La configurazione è simile a quella dell’indicatore Imbalance Tracker.
7. Impostazioni del plot
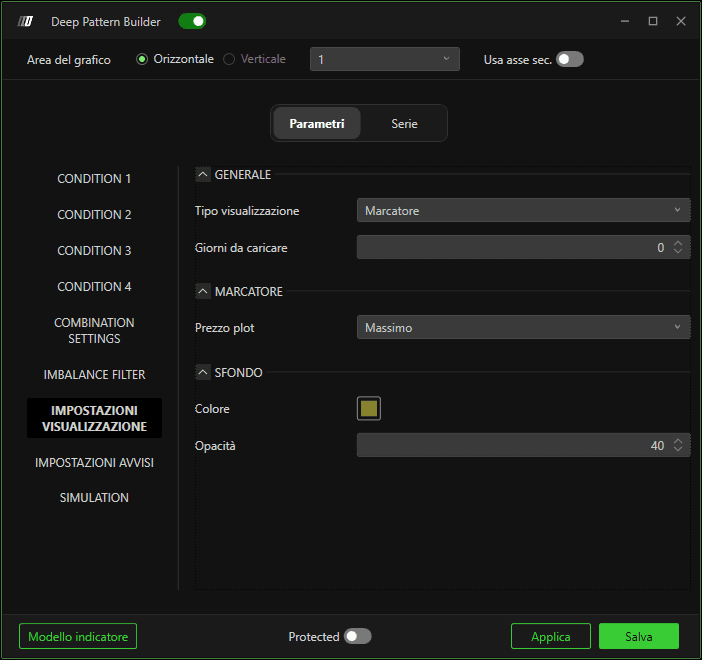
Definisce come il segnale appare sul grafico.
Tipo di plot
Marker – Mostra solo il marker
Background – Evidenzia lo sfondo della candela
Series & Background – Mostra sia il marker sia lo sfondo
Giorni da caricare
Definisce quanti giorni storici calcolare.
Prezzo del plot
High – Sopra la candela
Low – Sotto la candela
Current – Alla chiusura della candela
Mid Price – Centro della wick
Colore
Seleziona il colore del marker o dello sfondo.
Opacità
Regola la trasparenza dello sfondo.
8. Impostazioni alert
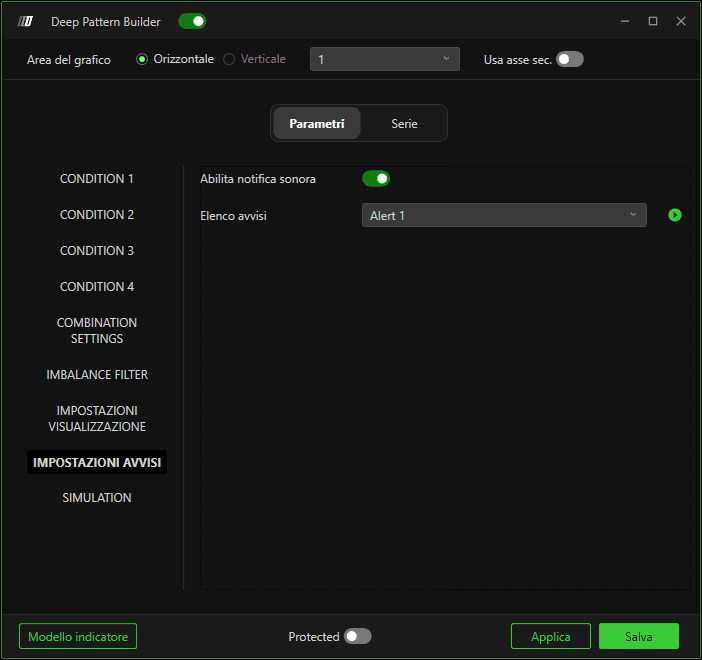
Prima di usare gli alert:
Vai su Opzioni → Aggiungi alert.
Crea il tuo alert.
Comparirà poi nell’elenco degli alert all’interno di Deep Pattern Builder.
9. Simulazione (backtest automatico)
La sezione Simulazione consente di eseguire automaticamente il backtest della tua logica personalizzata.

Abilita
Attiva la simulazione.
Tipo di ingresso
Market – Entra immediatamente al prezzo di mercato
Half Bar – Logica di ingresso basata sul calcolo a mezza barra
Ticks from Close – Posiziona un ordine limite a X tick dalla chiusura della candela
Lato
Scegli Acquisto o Vendita.
Consenti ingressi multipli
Se abilitato, nuovi segnali possono aprire ulteriori posizioni anche se una è già attiva.
Scadenza ingresso (barre)
Se impostato a 2, per esempio, l’ordine deve essere eseguito entro le 2 barre successive. In caso contrario, viene annullato.
Impostazioni stop
Stop (tick)
Stop loss fisso in tick.
Trailing stop – Abilita
Attiva il trailing stop.
Trailing stop – Attivazione (tick)
Definisce quanti tick di profitto devono maturare prima che il trailing si attivi.
Trailing stop – Offset (tick)
Distanza in tick tra il prezzo e il nuovo stop dopo l’attivazione.
Target
Puoi configurare più target:
Definisci ogni target in tick.
Abilita Sposta a pareggio (B/E) così lo stop si sposta all’ingresso una volta raggiunto un target.
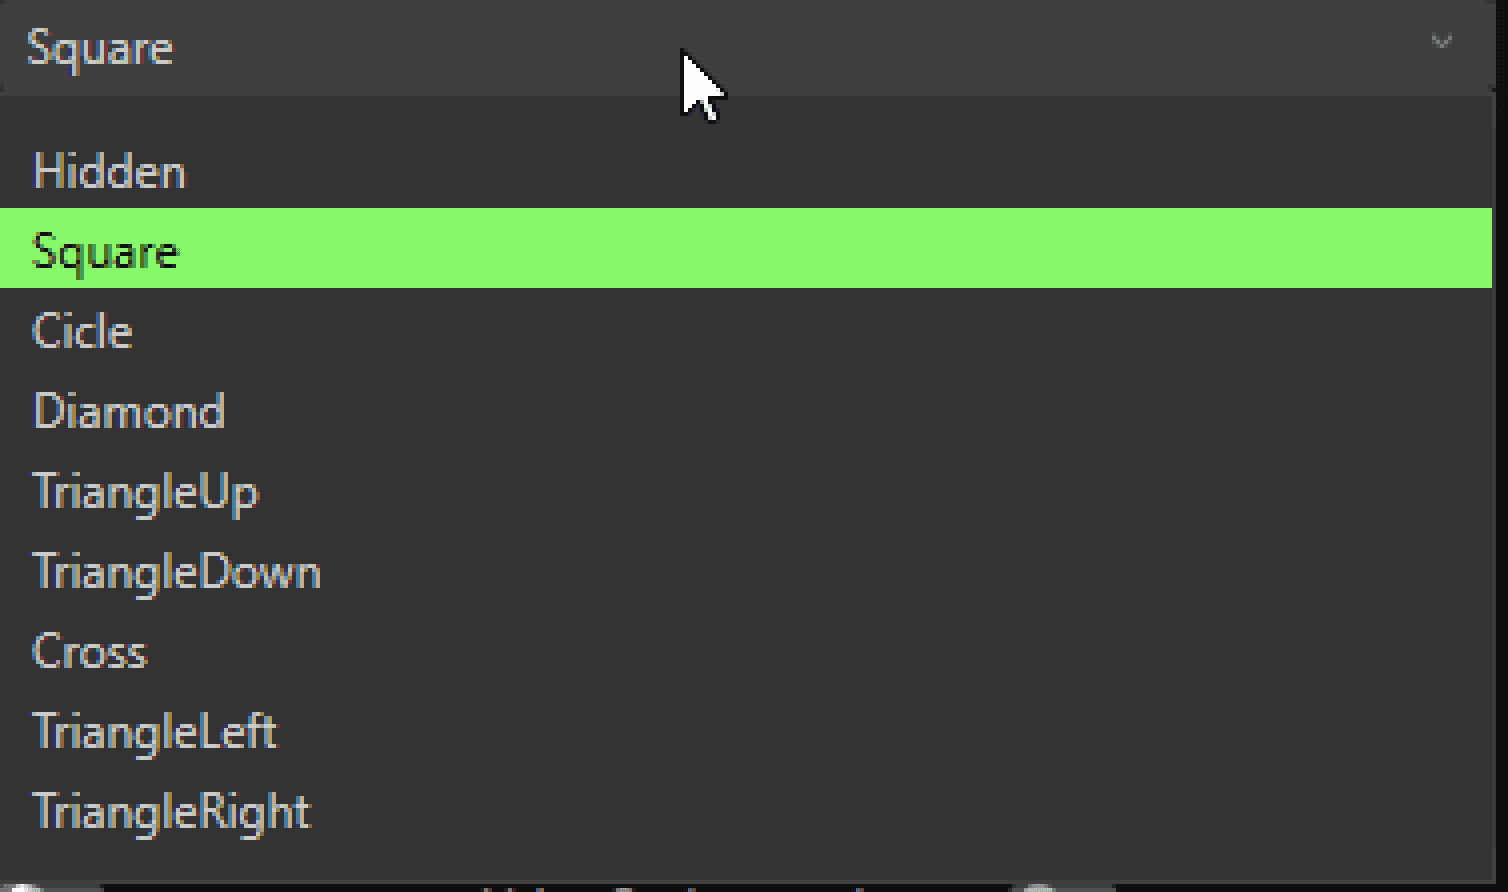
10. Subgraph
Colore: imposta il colore del marker bid
2 Color: imposta il colore del marker ask
Subgraph style: puoi selezionare qui qualsiasi stile del marker
11. Esecuzione del backtest
Una volta configurate tutte le impostazioni:
Fai clic su Applica e salva.
Fai clic destro sul grafico.
Seleziona Autotrading → Esegui backtest.
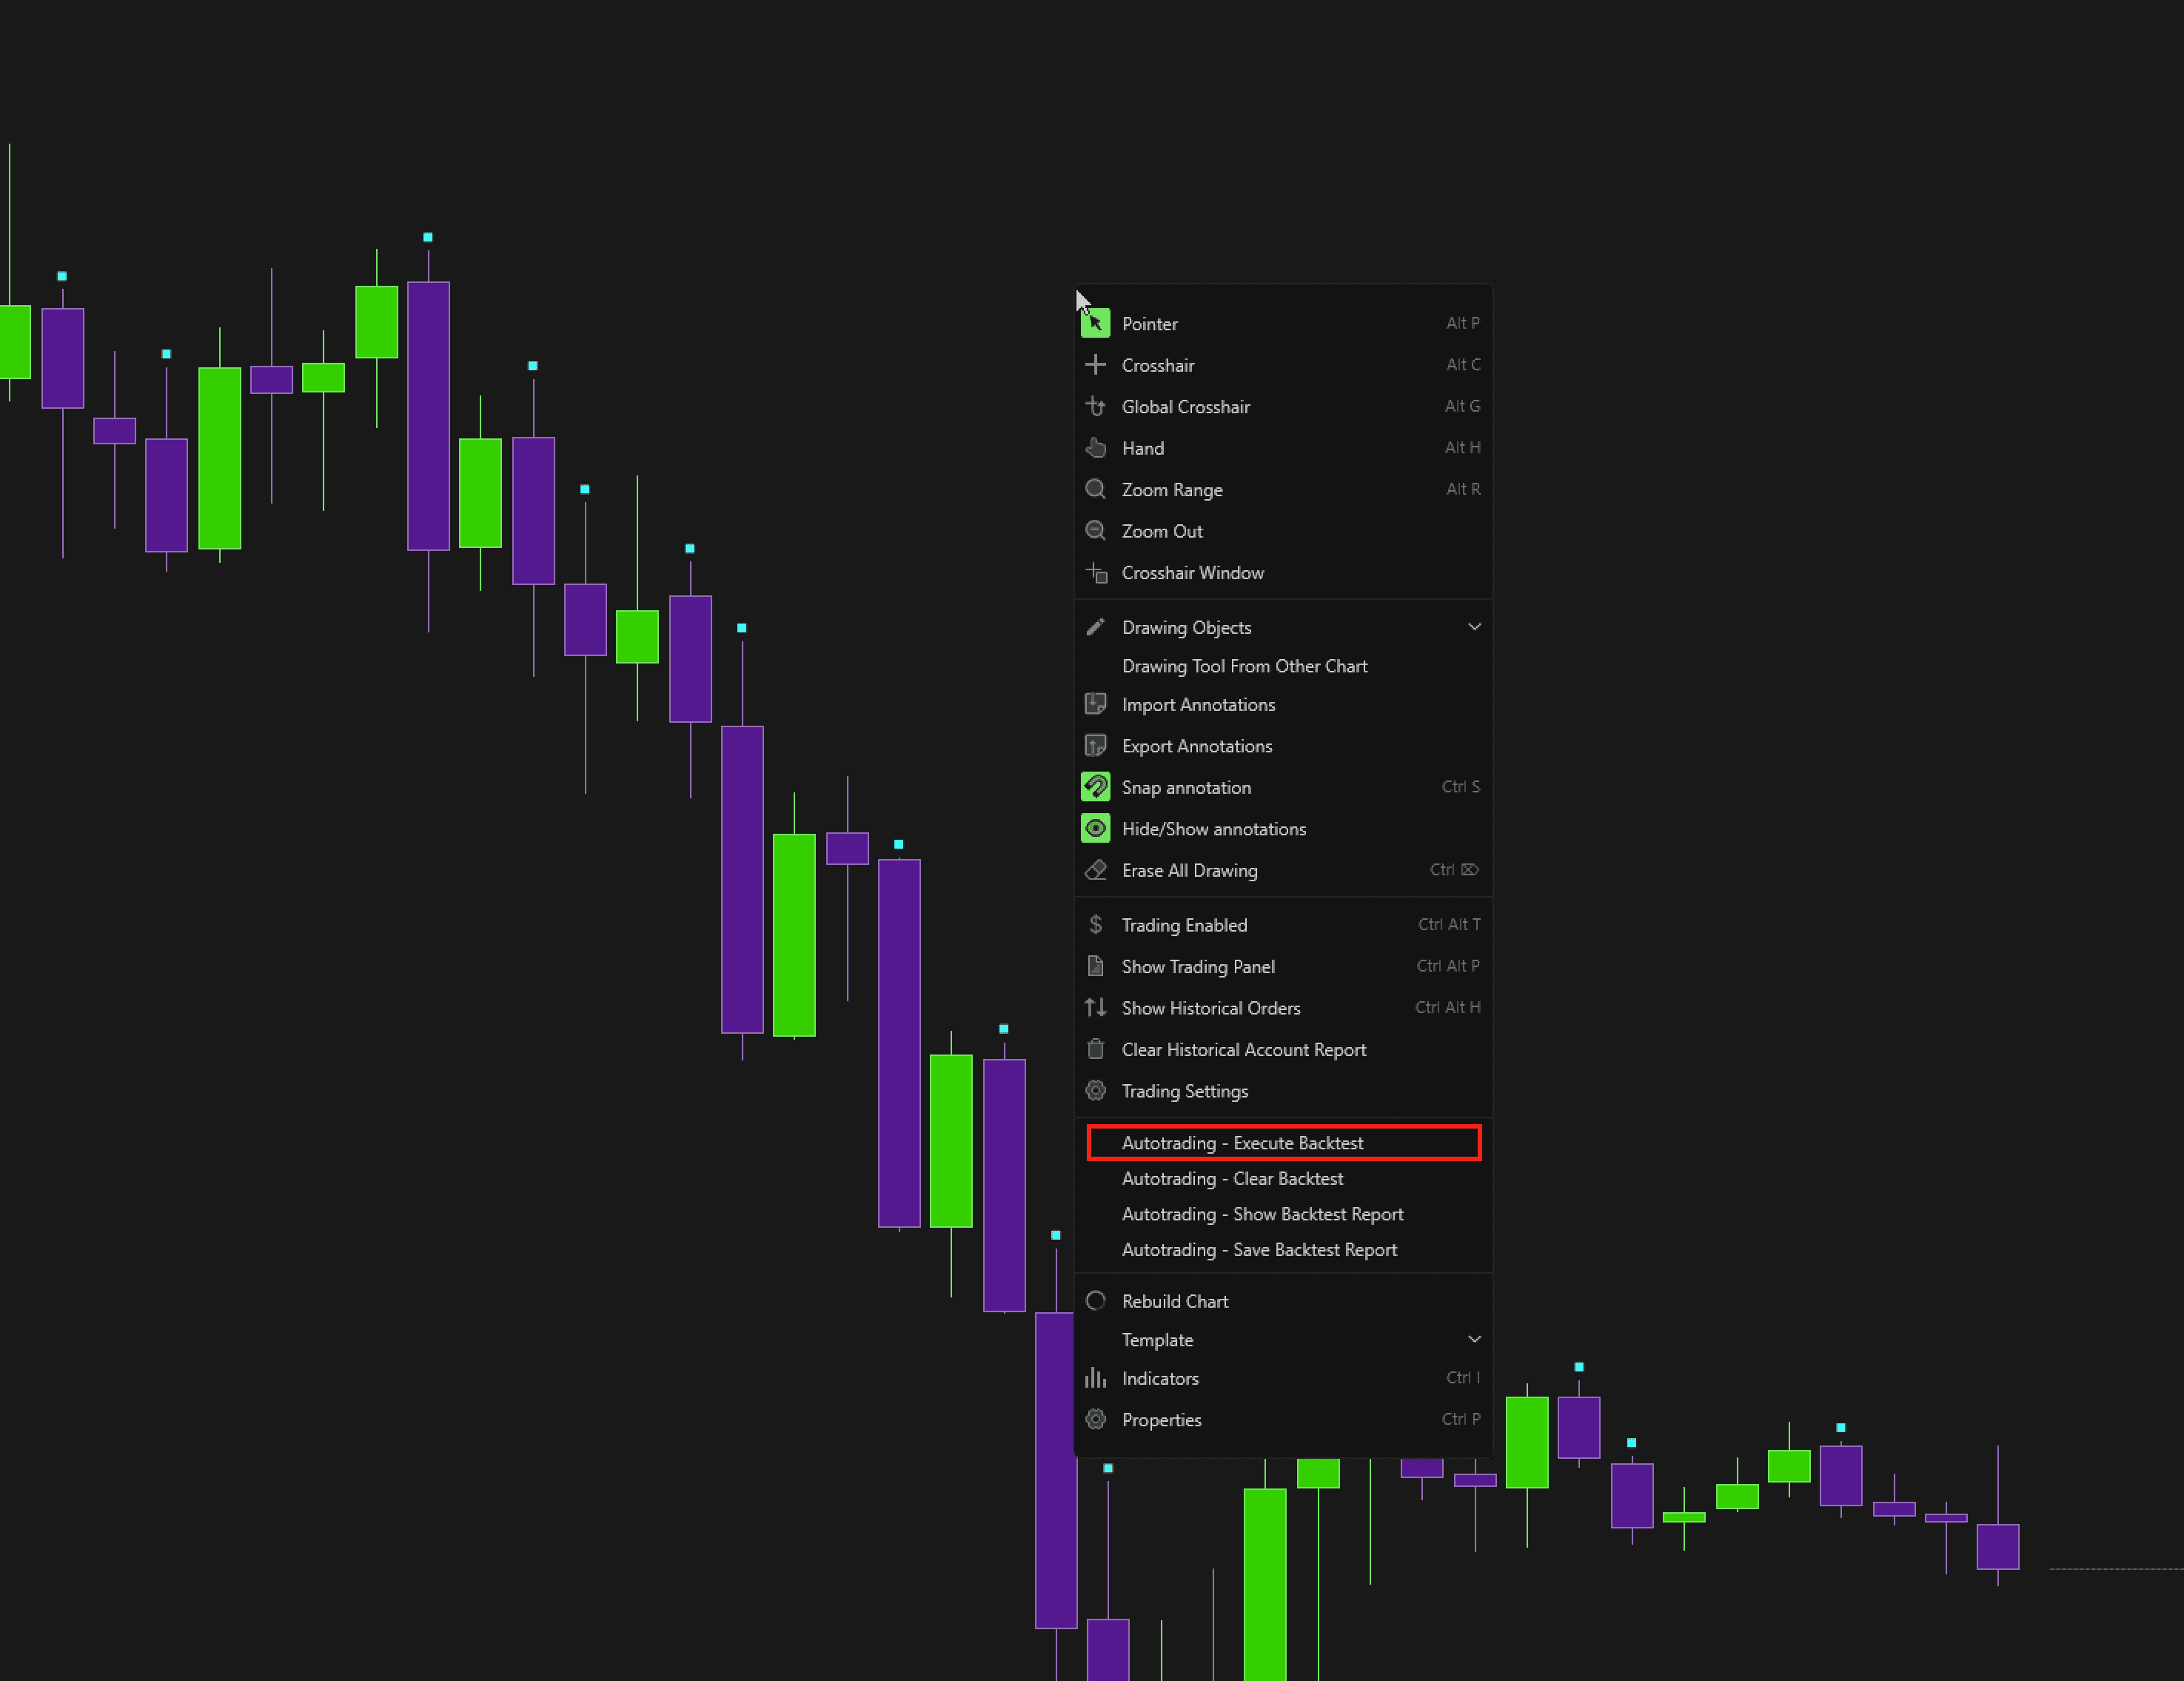
La simulazione verrà eseguita e genererà un report delle performance.
Puoi:
Cancellare i risultati
Visualizzare i backtest precedenti
Salvare il report del backtest (opzione da clic destro)