Indicatori avanzati
Updated:
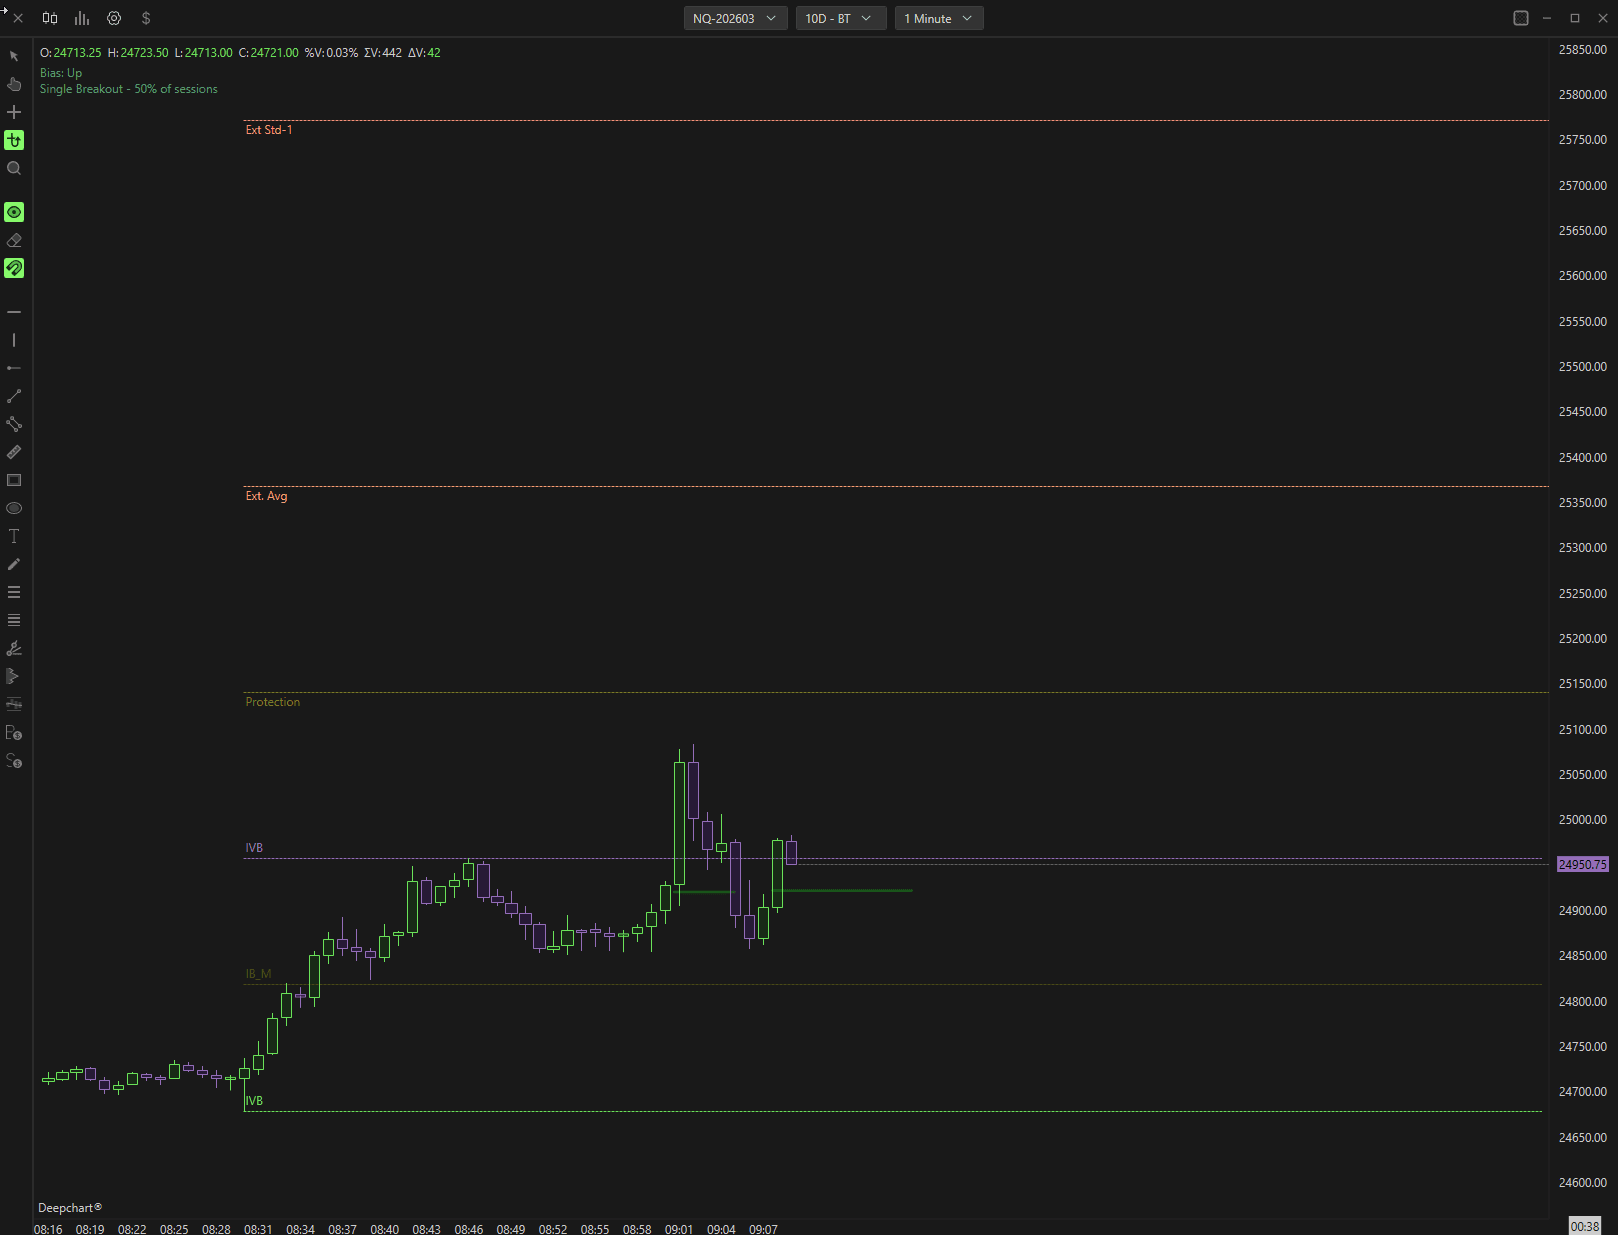
L'indicatore analizza anni di dati storici e traccia automaticamente livelli di proiezione, protezione e uscita ad alta probabilità in base a calcoli di probabilità statistica. Il suo obiettivo è fornire ai trader un approccio strutturato e basato sui dati al range di apertura RTH.
1. Come applicare l'indicatore
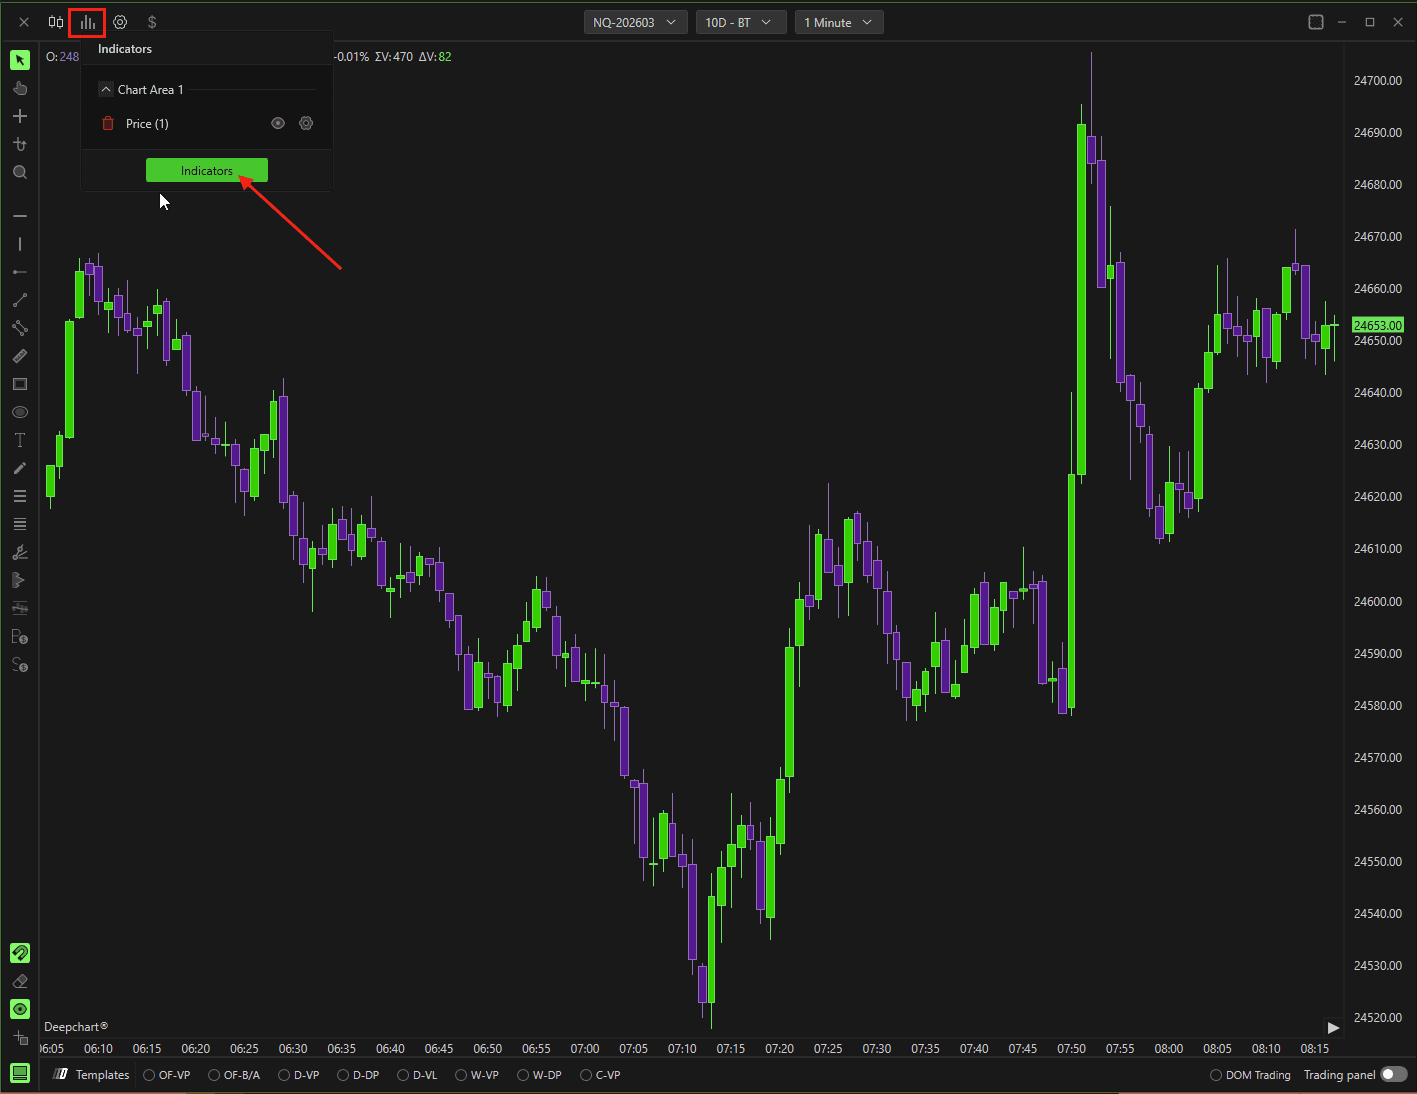
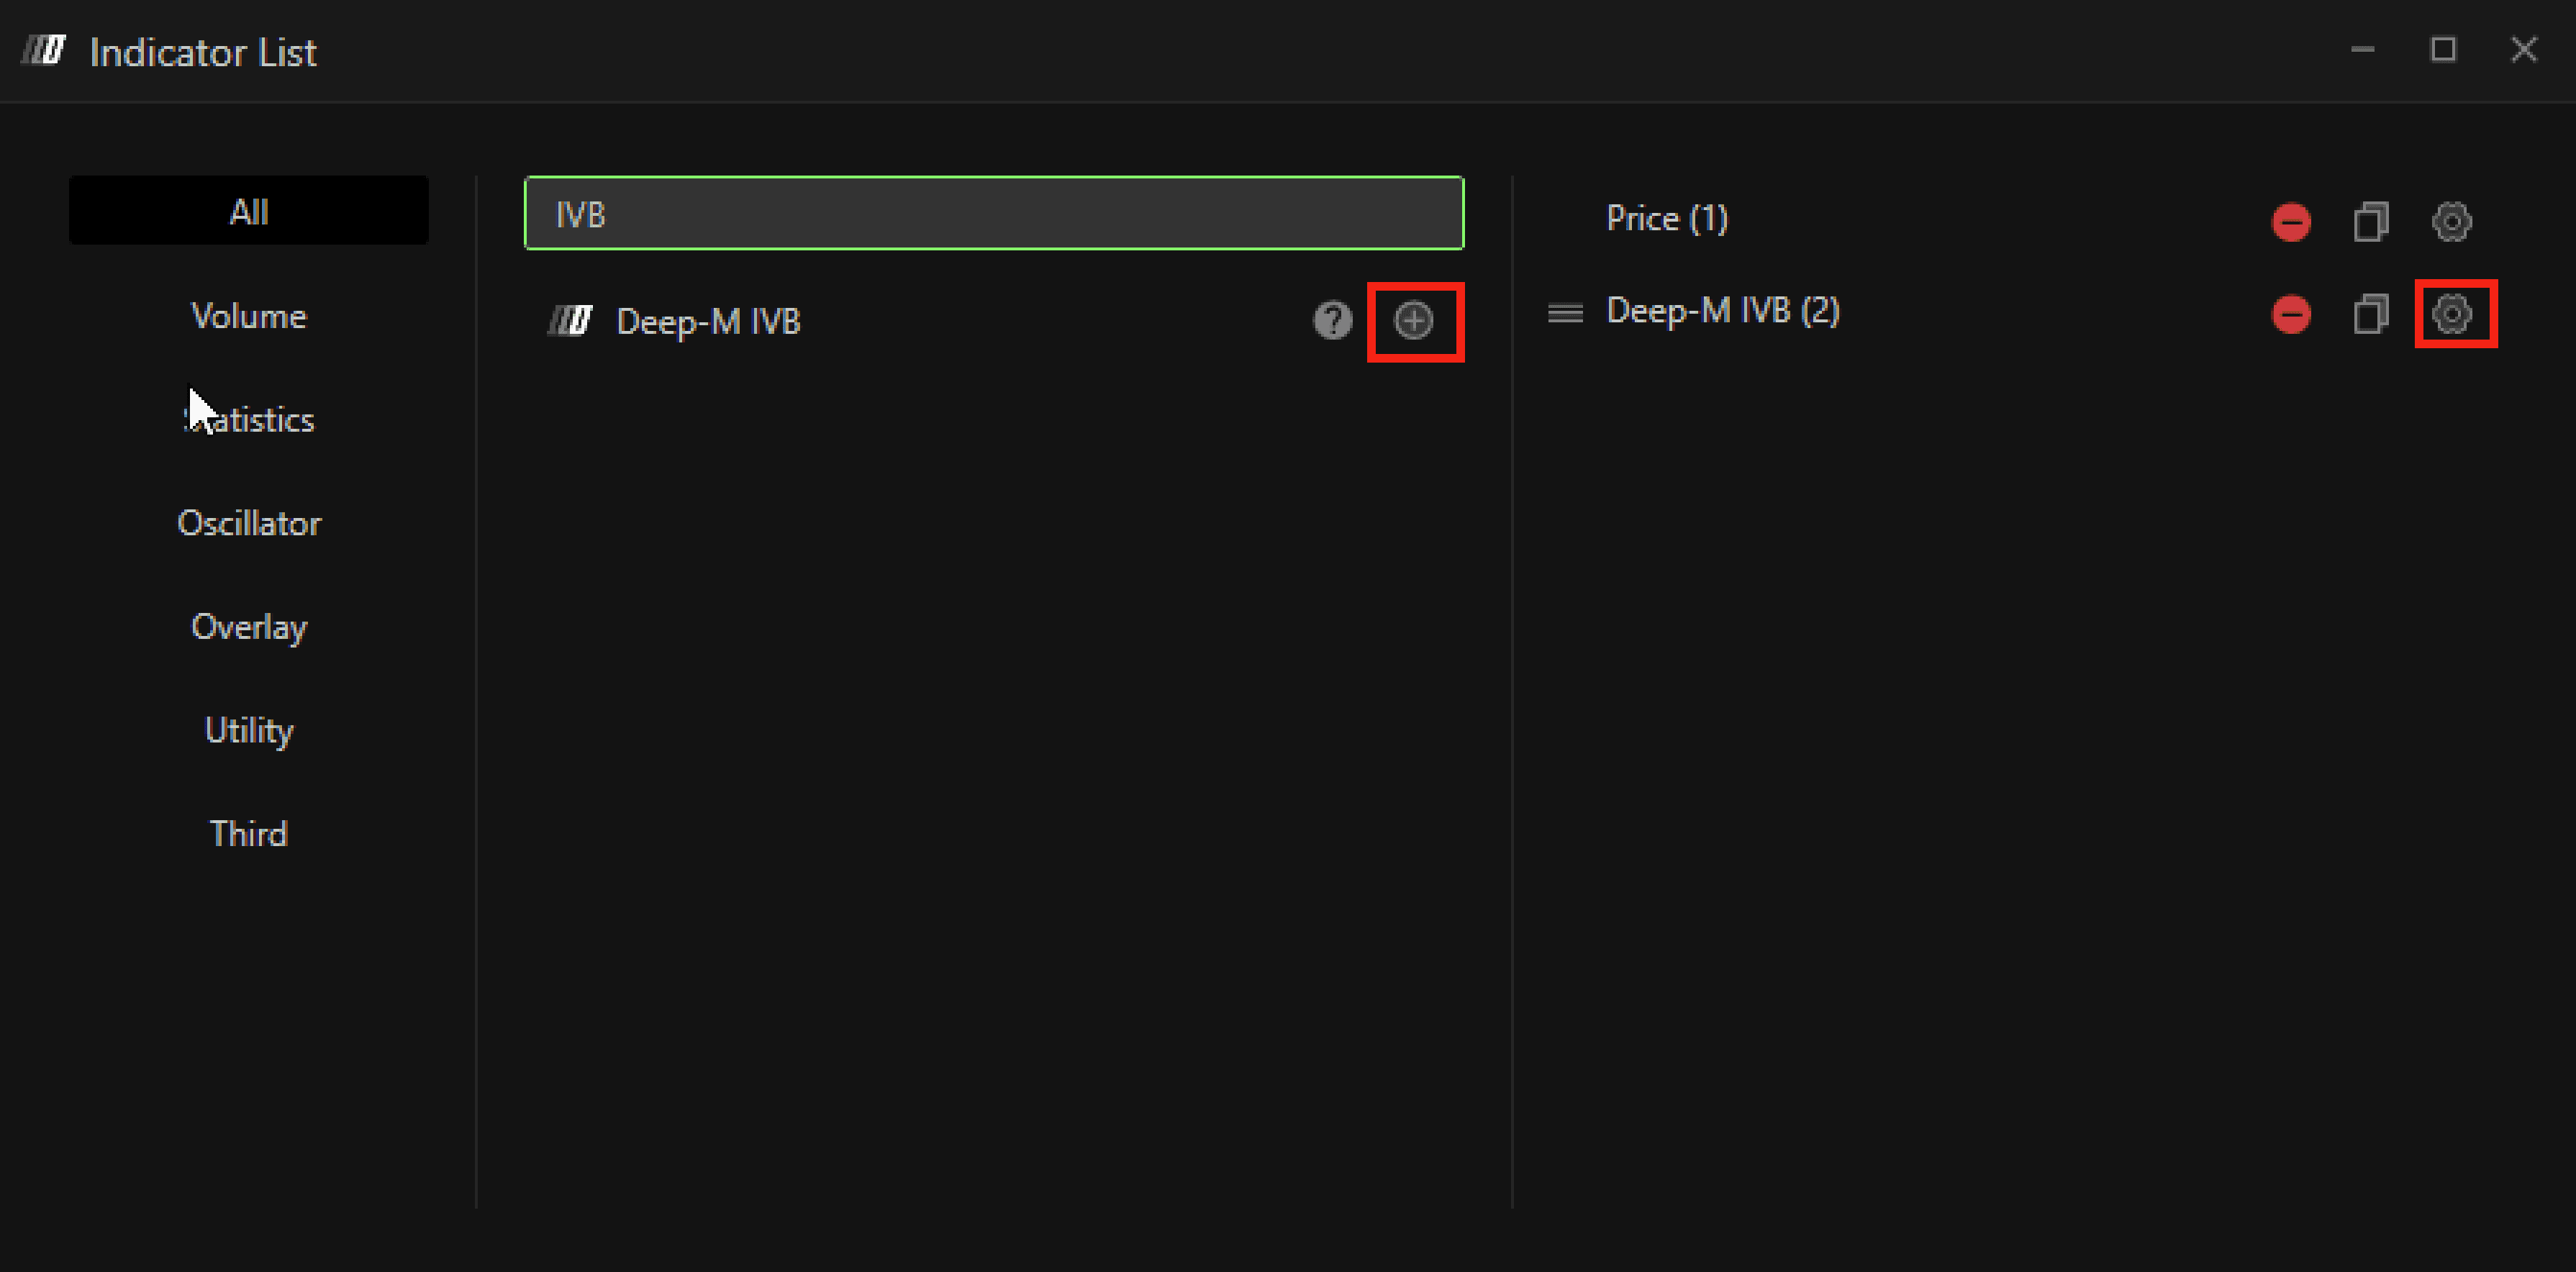
Apri la Lista indicatori sul grafico.
Cerca Deep-M IVB.
Fai clic su + per applicarlo al grafico.
Apri l'icona Impostazioni per configurare l'indicatore, se necessario.
2. Impostazioni
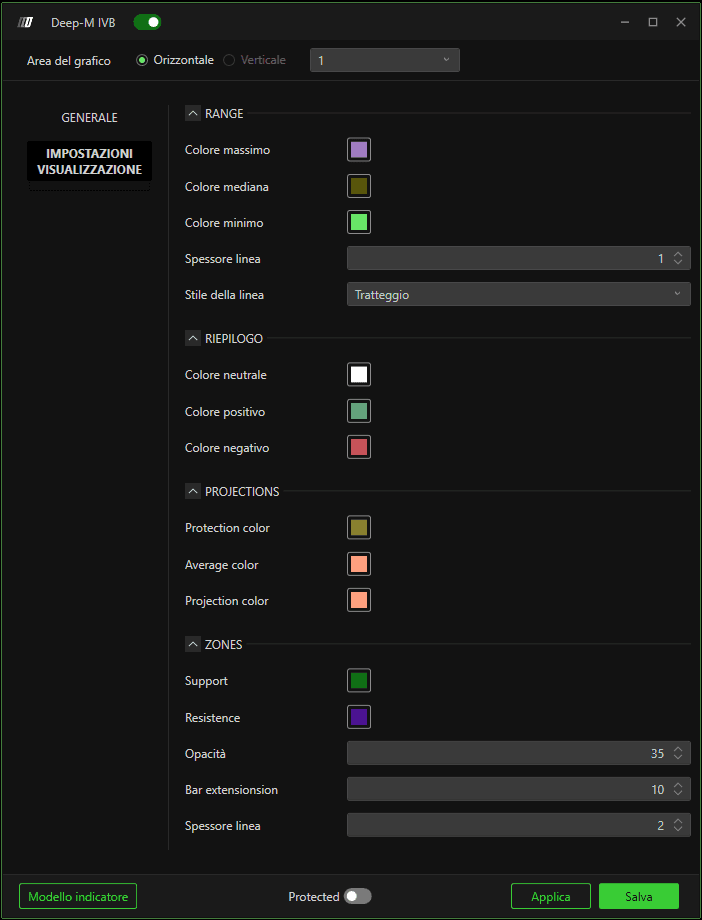
Impostazioni generali
Deep-M IVB è progettato come un sistema predefinito e pronto all'uso, quindi la configurazione è volutamente minima.
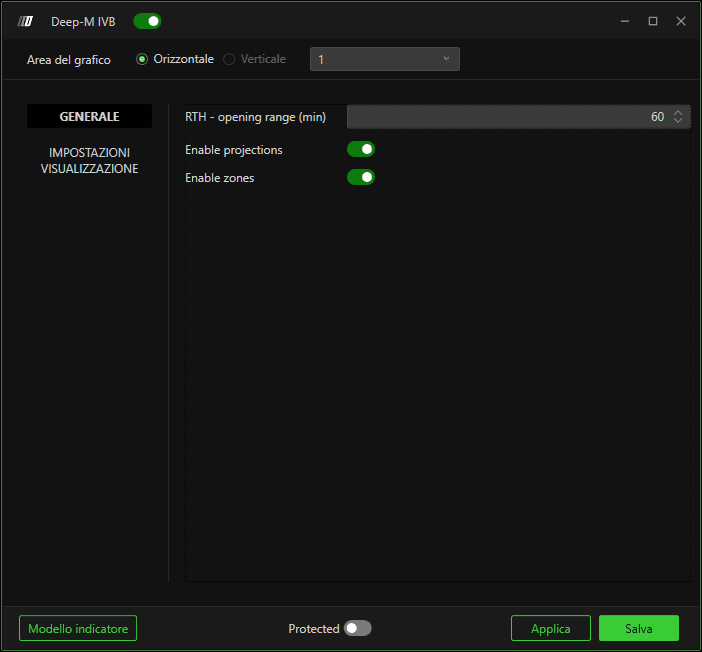
Range di apertura RTH (Min)
Definisce il numero di minuti utilizzato per calcolare il range di apertura.
Valori comuni:
15 minuti
30 minuti (consigliati dal team)
60 minuti
La durata selezionata determina i livelli High, Low e Mid che definiscono la struttura ORB.
Abilita protezione
Quando abilitato, l'indicatore traccia i livelli di protezione e di uscita dopo che il range viene rotto.
Questi livelli sono ricavati statisticamente e rappresentano:
Obiettivi ad alta probabilità
Zone di protezione strutturate
Aree logiche di uscita
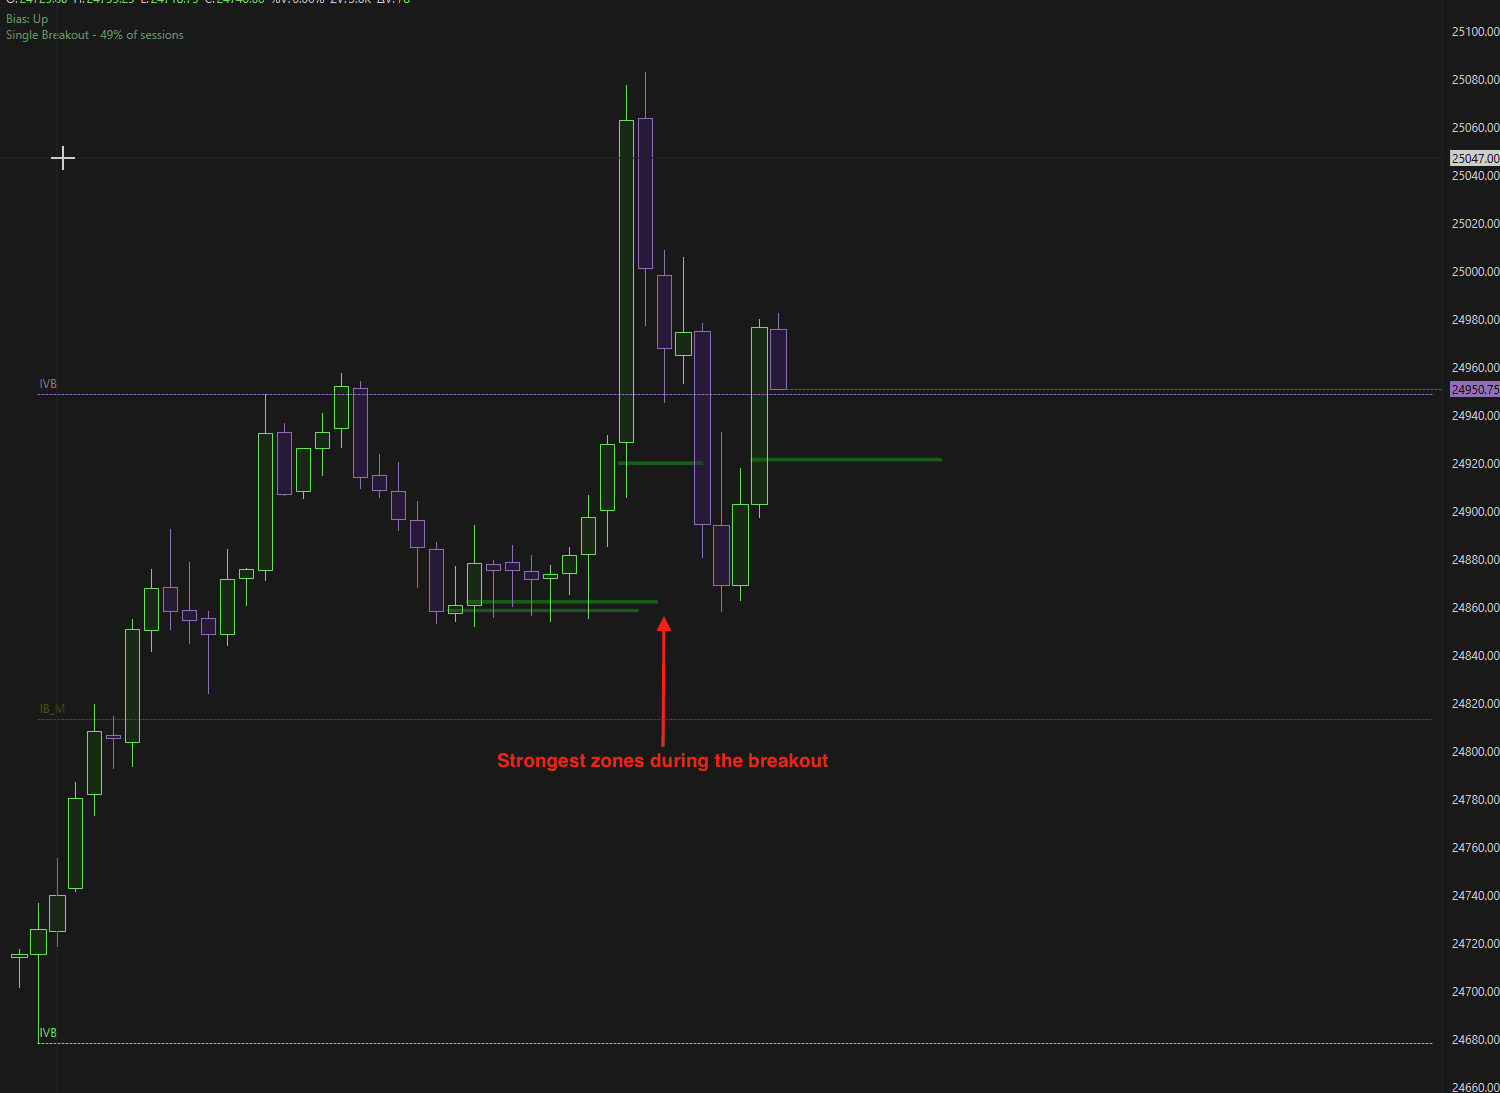
Abilita zone
Quando attivata, questa impostazione evidenzia le zone di reazione più forti durante un breakout.
Queste zone rappresentano aree ad alta probabilità in cui:
Il prezzo può reagire
Il momentum può rallentare
Si possono considerare uscite parziali
3. Impostazioni del plot
Range
Queste impostazioni controllano l'aspetto visivo del range di apertura.
Colore High – Colore della linea del massimo del range
Colore Mid – Colore della linea del punto medio
Colore Low – Colore della linea del minimo del range
Spessore linea – Spessore delle linee
Stile linea – Linea continua, tratteggiata o altri stili
4. Pannello riepilogativo
Il riepilogo appare nell'angolo in alto a sinistra del grafico e fornisce il bias giornaliero.
Colori del riepilogo
Colore neutro – Quando il bias giornaliero è neutro
Colore positivo – Quando il bias giornaliero è rialzista
Colore negativo – Quando il bias giornaliero è ribassista
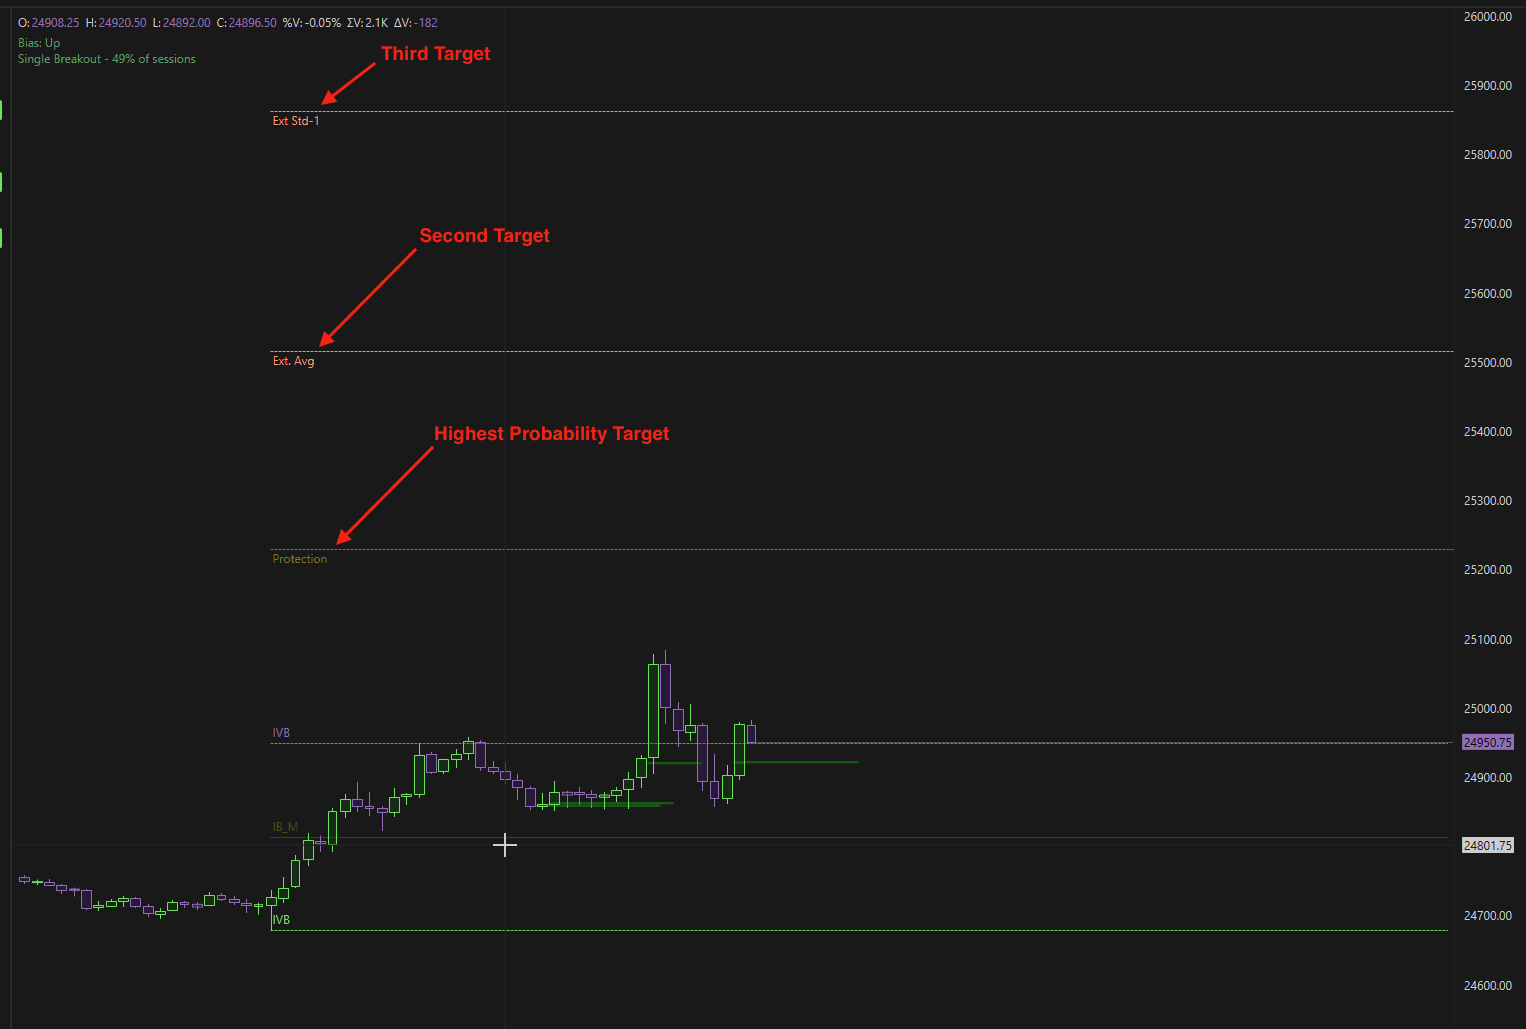
5. Proiezioni
Queste impostazioni controllano l'aspetto dei livelli target derivati statisticamente.
Colore protezione – Target con la probabilità più alta della giornata
Colore medio – Secondo target (Ext. Avg)
Colore proiezione – Terzo e ultimo target (Ext. Std-1)
Questi livelli vengono generati utilizzando modelli probabilistici storici.
5. Personalizzazione delle zone
La sezione Zone consente una personalizzazione visiva completa delle zone di reazione ai breakout.
Supporto
Colore delle zone di breakout rialziste.
Resistenza
Colore delle zone di breakout ribassiste.
Opacità
Regola la trasparenza della zona.
Estensione barre
Definisce quante candele in avanti verrà disegnata la zona.
Esempio: se impostato su 10, la zona si estenderà per le prossime 10 candele.
Spessore linea
Definisce lo spessore del bordo della zona.
Riepilogo
Deep-M IVB trasforma la tradizionale strategia Opening Range Breakout in un framework di trading basato sui dati e sulle probabilità.
Offre:
Calcolo automatico del range di apertura
Livelli di proiezione e protezione predefiniti
Zone di reazione durante i breakout
Riepilogo chiaro del bias giornaliero
Configurazione minima con una struttura professionale
Combinando la struttura ORB con la modellazione statistica storica, Deep-M IVB aiuta i trader ad affrontare le sessioni di breakout con chiarezza, struttura e probabilità misurabili.