Indicatori
Updated:
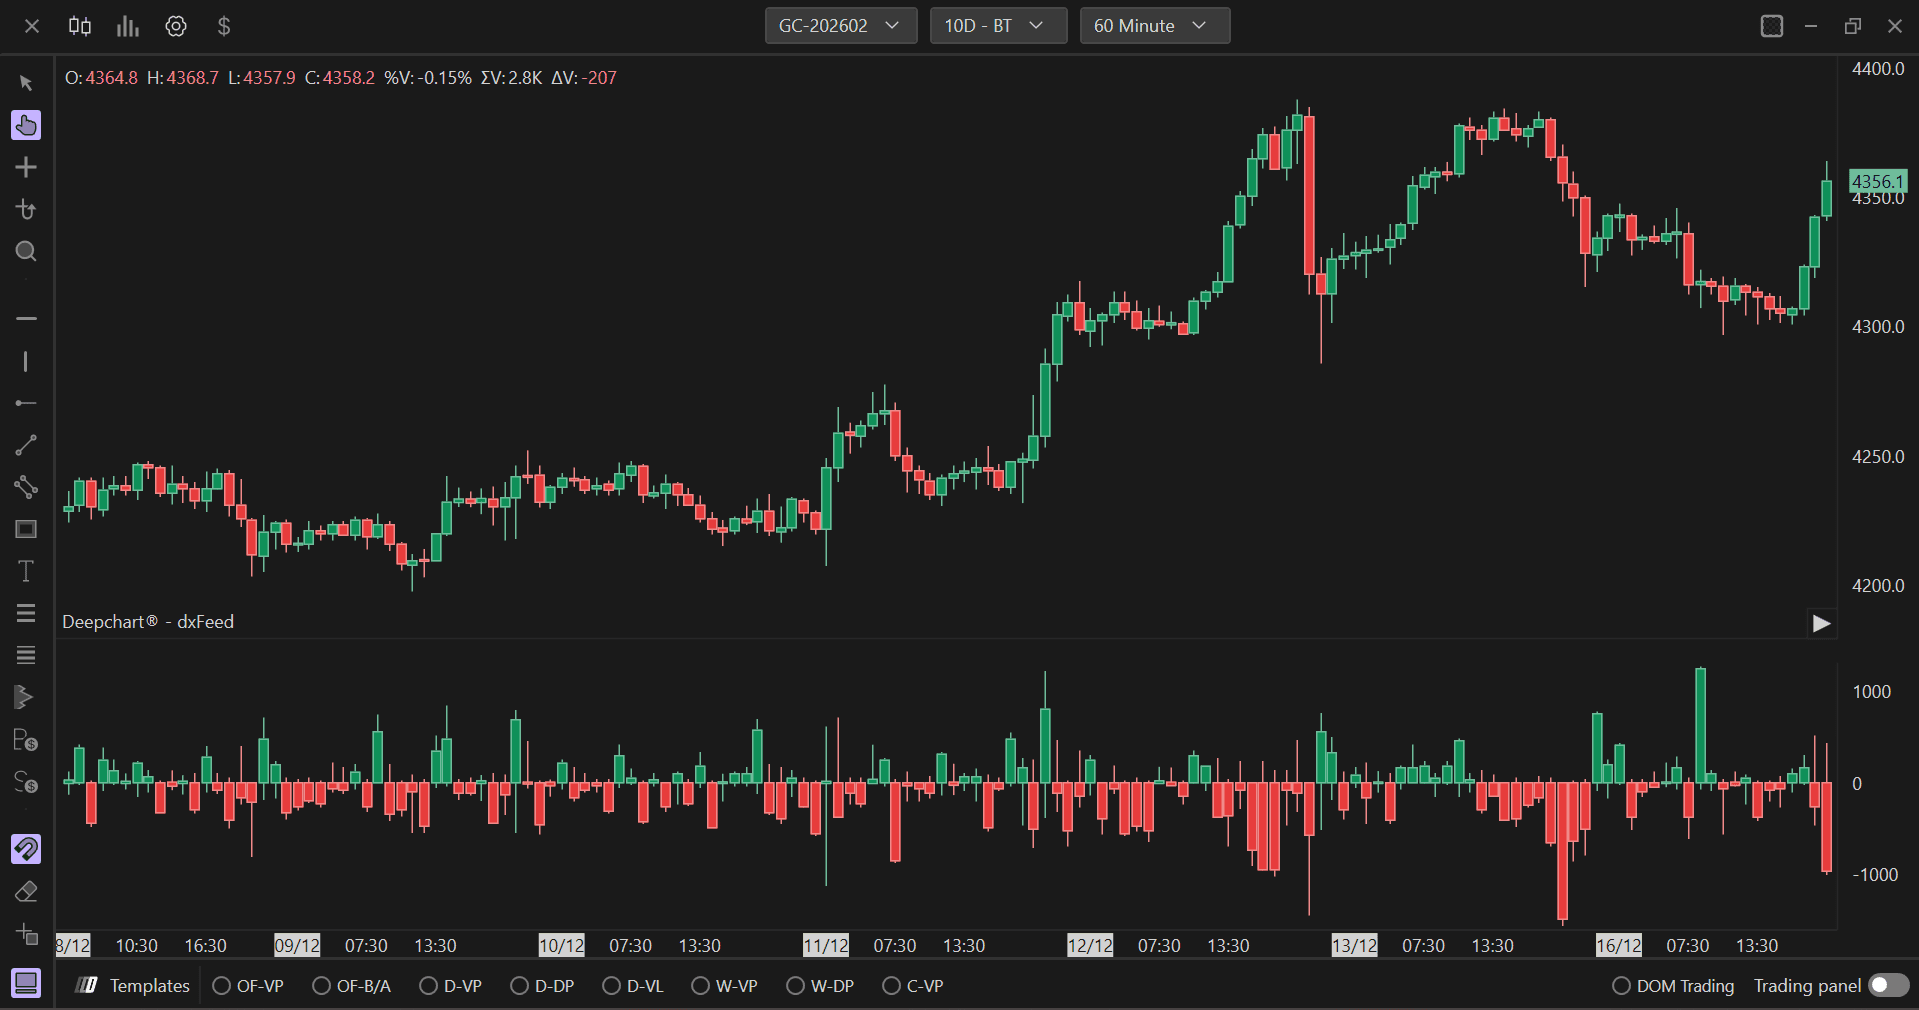
L indicatore Delta Bar mostra il delta di ogni candela, cioè la differenza tra acquisti a mercato e vendite a mercato, tramite barre nel riquadro inferiore del grafico. Questo consente ai trader di identificare visivamente la pressione del mercato confrontando il volume degli acquisti aggressivi rispetto alle vendite aggressive a ogni livello di prezzo.
Utilizzo delle impostazioni
Cliccando sull'icona delle impostazioni dell'indicatore si aprirà la sua finestra di configurazione, all'interno della quale è possibile effettuare diverse scelte relative al funzionamento dell'indicatore.
Parametri (Impostazione dei dati)
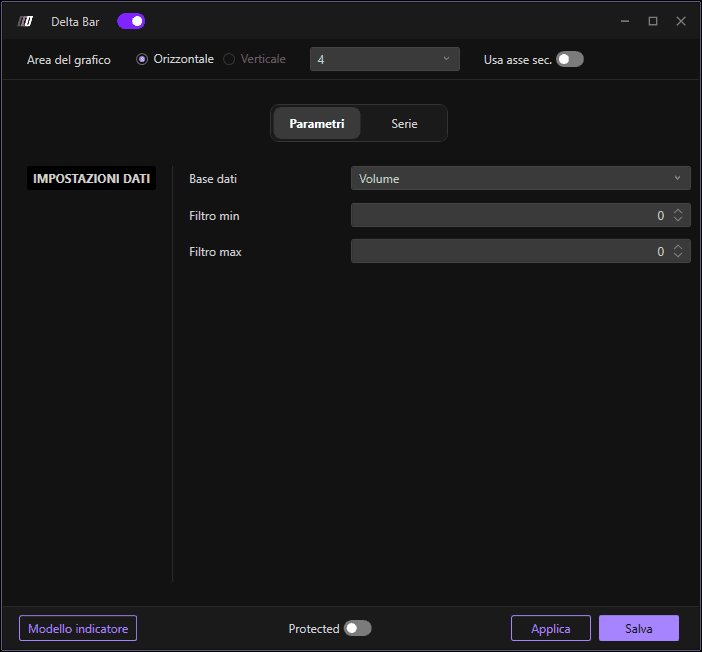
Definisce quale base dati utilizzare per calcolare l'indicatore. È possibile scegliere tra le seguenti opzioni:
Volume: Rappresenta il volume totale negoziato a ogni livello di prezzo. Questa fonte dati è utile per comprendere l'intensità del trading e individuare i livelli di prezzo in cui si è concentrata la maggior parte dell'attività di mercato.
Ordine: Considera i dati sugli ordini, come la quantità di ordini di acquisto e di vendita a ogni livello di prezzo. Questa opzione è utile per valutare la pressione degli ordini e analizzare il comportamento degli operatori di mercato.
Operazioni: Tiene traccia del numero di operazioni eseguite a ogni livello di prezzo.
Volume aggregato: Mostra il volume aggregato combinando piccoli ordini inseriti in un breve intervallo di tempo, riconducibili a un singolo ordine più grande. Ciò offre una visione più accurata dei livelli di attività di trading.
Operazioni aggregate: Mostra le operazioni aggregate, cioè piccoli ordini inseriti in un breve intervallo di tempo l'uno dall'altro, riconducibili a un singolo ordine più grande. Questa opzione offre una visione più accurata dei livelli di attività di trading raggruppando le operazioni eseguite allo stesso prezzo.
Filtraggio
Filtro minimo
Consente di applicare un filtro minimo all'indicatore. Verranno visualizzati solo i valori delta superiori a questa soglia.
Filtro massimo
Consente di applicare un filtro massimo all'indicatore. Se viene lasciato il valore 0, l'indicatore non applicherà alcun filtro massimo. Imposta un valore specifico per escludere le barre delta che superano questa soglia.
Sottografici
In questa sezione puoi definire l'aspetto visivo dell'indicatore Delta Bar:
Colori: Definisci la combinazione di colori per le barre delta (tipicamente colori diversi per il delta in acquisto e il delta in vendita)
Stile del sottografico: Scegli tra diversi stili di visualizzazione:
Candlestick: Mostra il delta come barre in stile candlestick
OHLC: Mostra nel formato Open, High, Low, Close
Corpo della candela: Mostra solo il corpo della candela senza ombre
Larghezza linea: Regola la larghezza/spessore delle barre delta per una migliore visibilità