Indicatori
Updated:
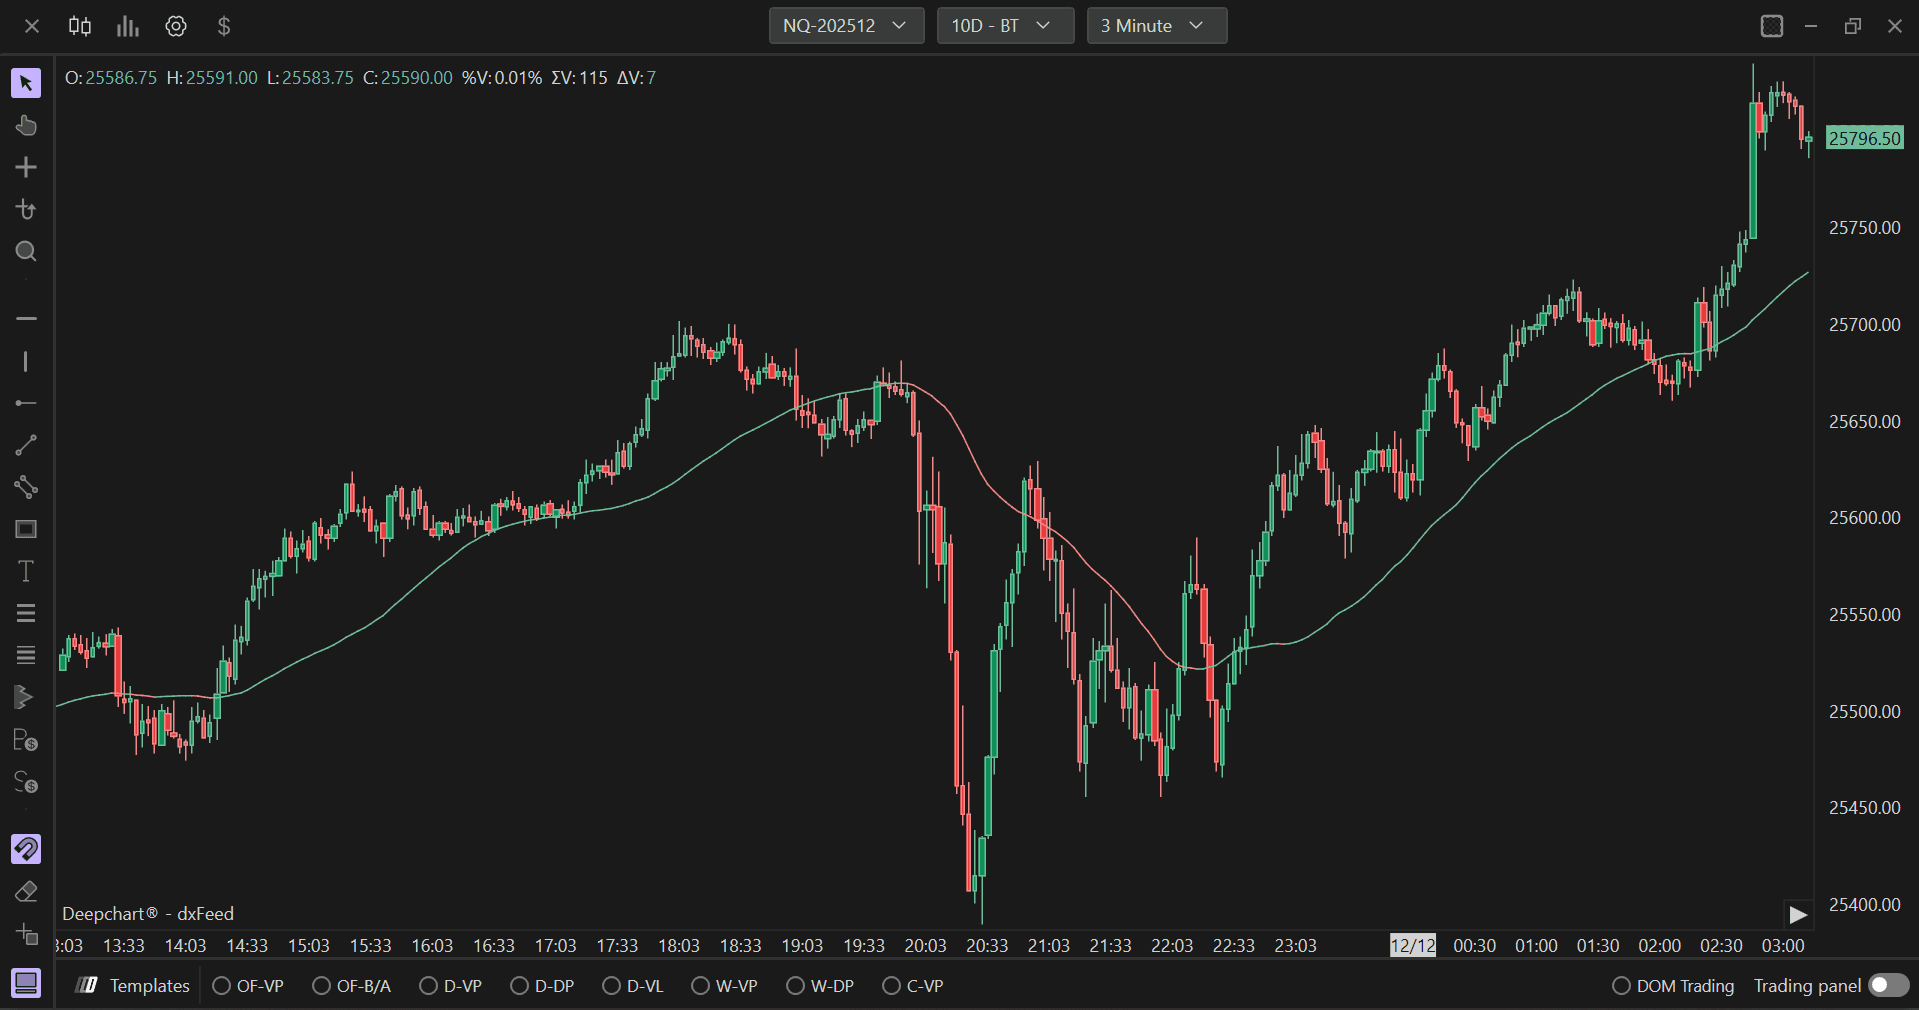
La Media Mobile è uno degli strumenti di analisi tecnica più utilizzati. È una linea tracciata sul grafico che rappresenta il valore medio dei prezzi di un asset su un certo numero di periodi. All'utente basta selezionare il tipo di media desiderato.
Le medie mobili possono essere utilizzate per analizzare i trend, individuare possibili inversioni di prezzo e generare segnali di acquisto o di vendita.
Utilizzo delle impostazioni
Facendo clic sull'icona delle impostazioni dell'indicatore si aprirà la sua finestra di configurazione, all'interno della quale potrai effettuare diverse scelte relative al funzionamento dell'indicatore.
Parametri
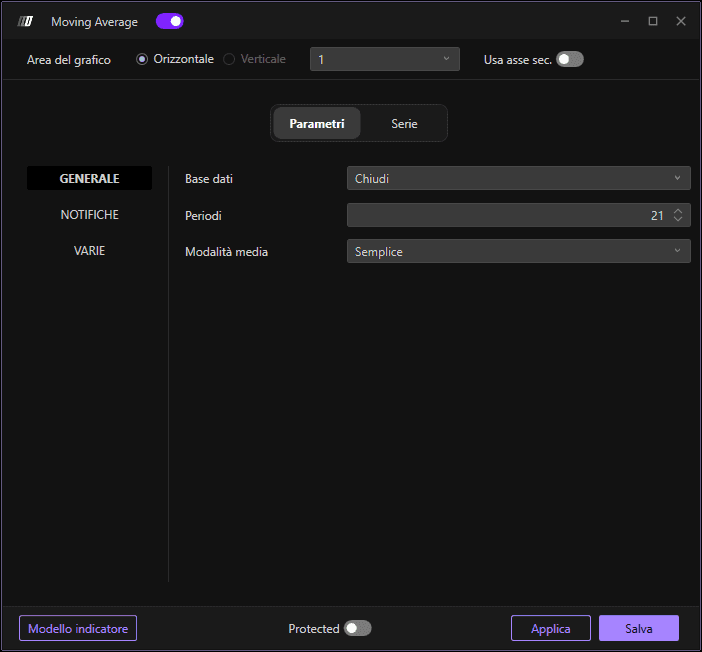
Nella sezione Parametri puoi modificare:
Input: I dati di prezzo da utilizzare per il calcolo (Chiusura, Apertura, Massimo, Minimo e volume)
Lunghezza: Il numero di periodi per il calcolo della media mobile (predefinito: 21 periodi)
Tipo di media: Scegli il tipo di media mobile (Semplice, Esponenziale, Triangolare e Ponderata)
Avviso
È inoltre possibile attivare le notifiche:
Attiva avviso sonoro: Genera avvisi sonori per eventi specifici
Attiva messaggio di avviso: Mostra avvisi popup sullo schermo
Nome avviso: Nome personalizzato per la notifica
Sottografico
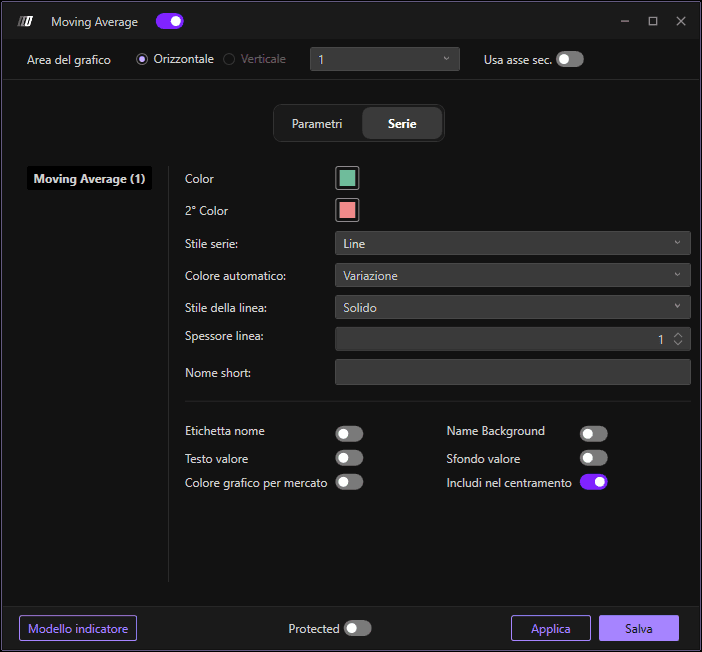
Nella sezione Sottografico puoi modificare lo stile e i colori della media mobile:
Colore media mobile: Imposta il colore della linea della media mobile
Colore secondario: Imposta un colore secondario opzionale
Stile sottografico: Scegli lo stile di visualizzazione
Stile linea: Definisci lo stile della linea
Spessore linea: Definisci la larghezza della linea
Usa asse secondario: Opzione per visualizzare su un asse secondario