Indicatori
Updated:
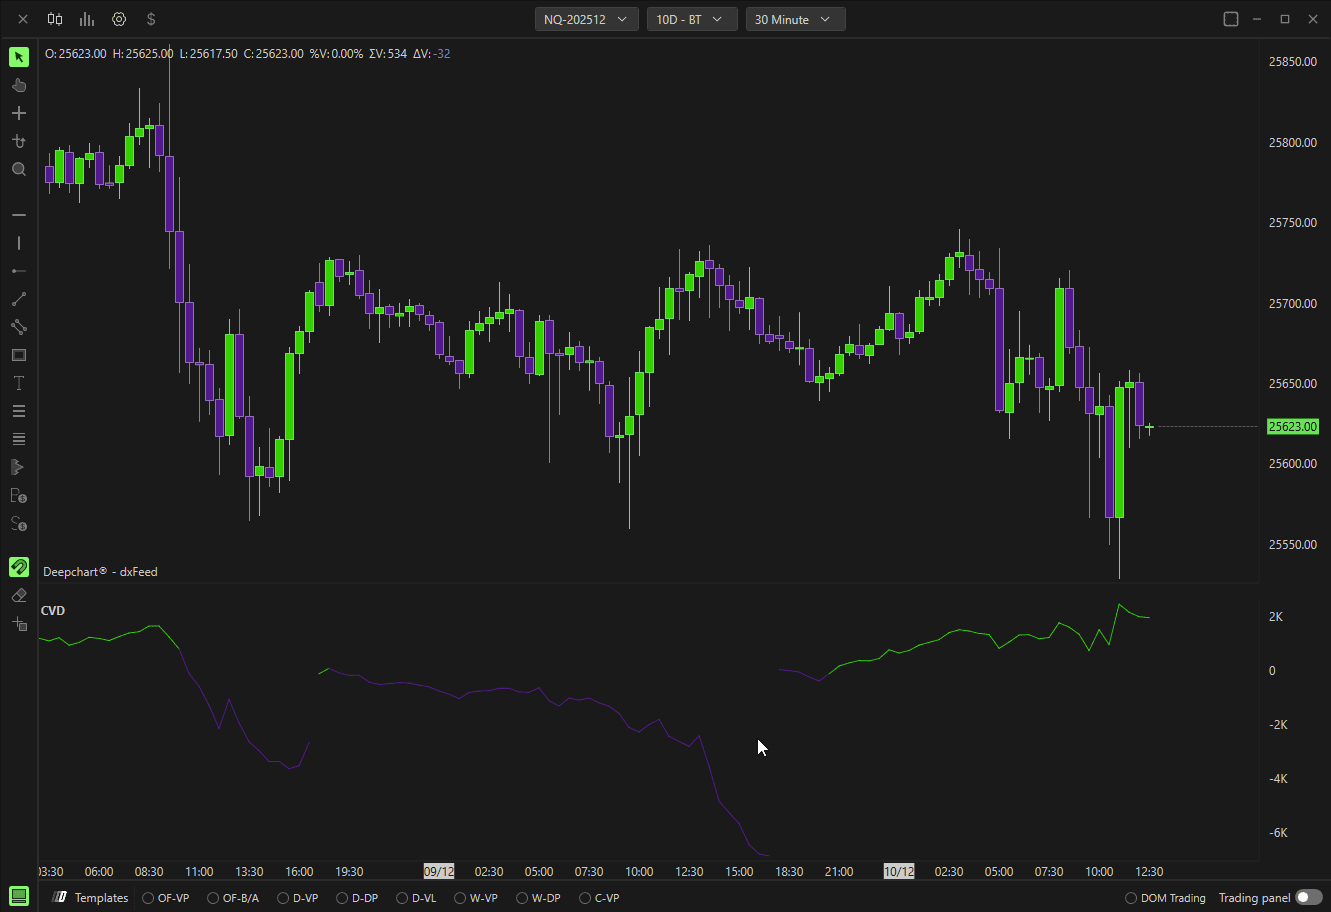
L'indicatore DeepChart Delta Cumulative Histogram consente all'utente di visualizzare tramite barre o una linea, nella parte inferiore del grafico, la somma cumulativa del delta di ogni candela, ovvero la differenza tra vendite a mercato e acquisti a mercato, permettendo all'utente di identificare quale lato del mercato è più aggressivo.
Impostazioni generali
Facendo clic sull' icona delle impostazioni dell'indicatore, si aprirà la finestra di configurazione. Da lì, puoi personalizzare il comportamento, la sorgente dei dati e l'aspetto visivo dell'indicatore in base alle tue preferenze di trading.
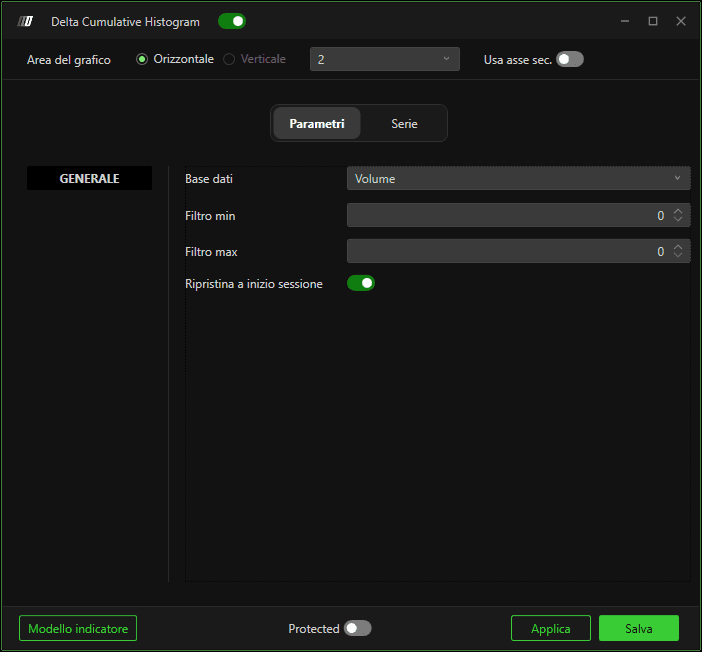
Parametri
Dati di input
Definisce quale sorgente dati viene utilizzata per calcolare il delta cumulativo. Puoi scegliere tra:
1. Volumi
Utilizza la quantità di contratti o azioni scambiati per calcolare il delta.
2. Operazioni
Utilizza il numero di operazioni eseguite, indipendentemente dalla loro dimensione.
Differenza principale:
Le operazioni mostrano quanto spesso viene scambiato uno strumento.
I volumi mostrano quanto dello strumento viene scambiato.
Ad esempio:
Un aumento delle operazioni senza un aumento significativo dei volumi indica negoziazioni frequenti con ordini di piccole dimensioni.
Un aumento dei volumi senza un corrispondente aumento delle operazioni suggerisce un numero minore di trader che eseguono ordini di grandi dimensioni.
puoi leggere i dati di input da qui …
Filtro minimo
Consente di applicare un filtro minimo ai dati utilizzati nel calcolo del delta cumulativo. I valori inferiori a questa soglia vengono ignorati.
Filtro massimo
Consente di applicare un filtro massimo ai dati.
Se il valore è impostato su 0, non verrà applicato alcun filtro massimo.
Ripristina all'inizio della sessione
Se abilitato, il Delta Cumulative Histogram si azzera all'inizio di ogni sessione di trading, invece di continuare indefinitamente da una sessione all'altra.
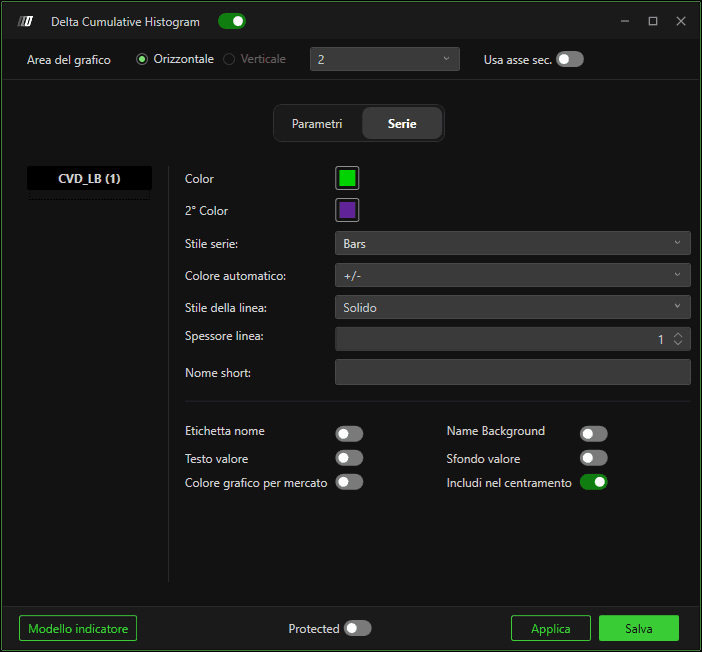
Sottografici
In questa sezione, puoi personalizzare completamente l'aspetto dell'indicatore:
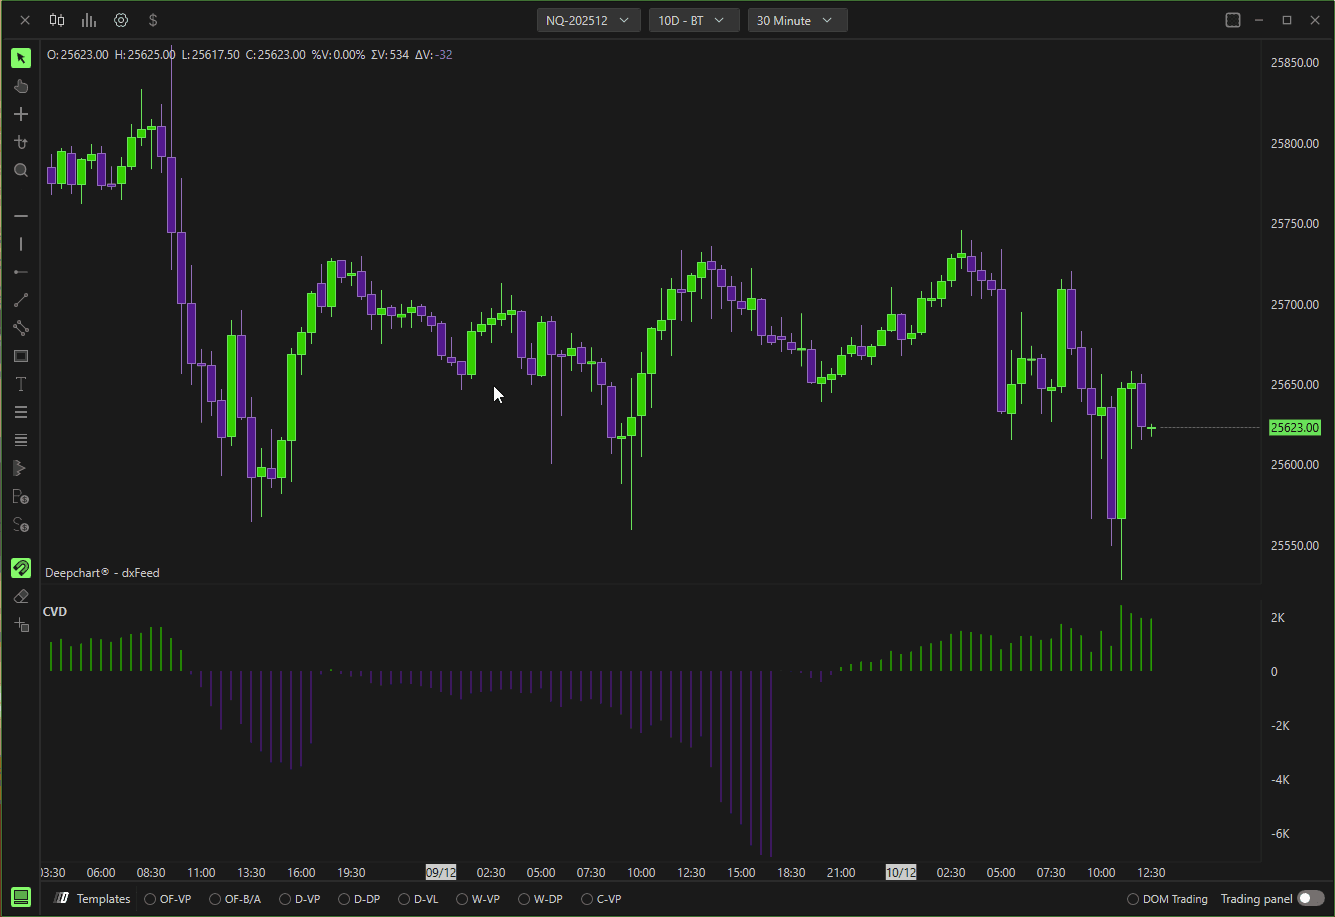
Stile del sottografico: scegli Barre o Linea
Seleziona lo stile della linea: Continua o Tratteggiata
Regola la larghezza della linea
Personalizza i colori
Mostra o nascondi il nome e il valore dell'indicatore
Assegna un nome personalizzato all'indicatore
Comportamento predefinito:
Barre/linea verdi indicano un delta cumulativo positivo, mostrando l'aggressività dei compratori.
Barre/linea rosse indicano un delta cumulativo negativo, mostrando l'aggressività dei venditori.