Generale
Updated:
Gestisci Indicatori / Liste Indicatori
Per vedere / gestire gli indicatori correnti o vedere l'elenco completo degli indicatori, fai clic sull'icona del grafico a barre in alto a sinistra (vedi immagine).
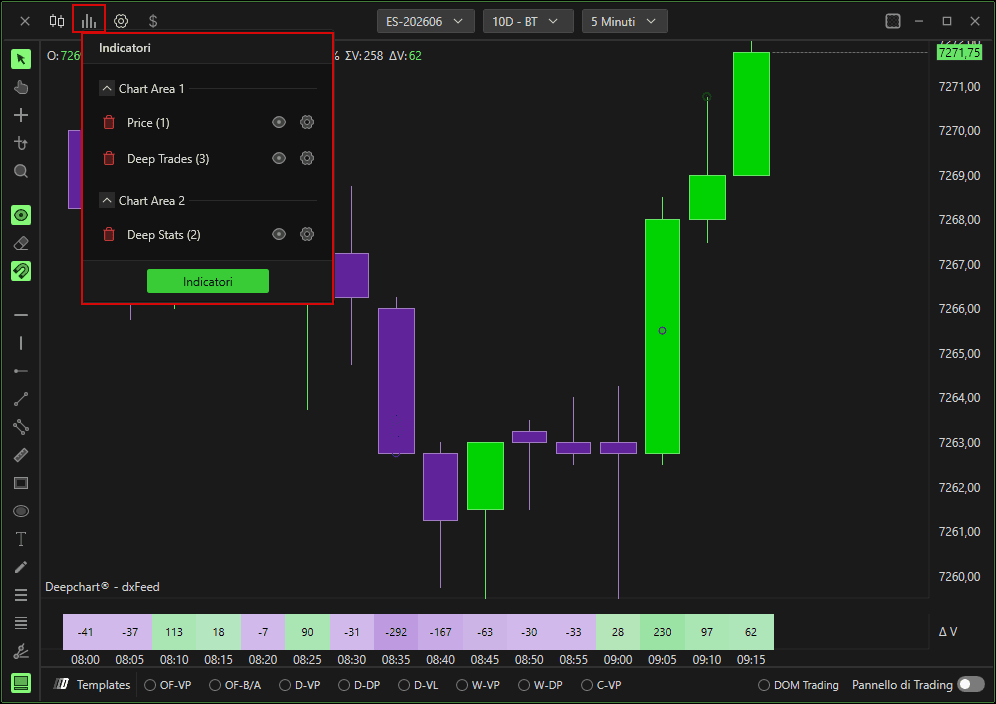
Puoi rimuovere l'indicatore corrente facendo clic sull'icona del cestino
Puoi nascondere l'indicatore facendo clic sull'icona a forma di occhio
Puoi modificare le impostazioni dell'indicatore facendo clic sull'icona a ingranaggio
L'area del grafico definisce dove vengono posizionati gli indicatori sul grafico dei prezzi
Sul grafico dei prezzi, puoi modificare la dimensione dell'area del grafico facendo clic sulla linea in cui l'area è divisa e trascinando.Fai clic su Indicatori per vedere l'elenco completo degli indicatori
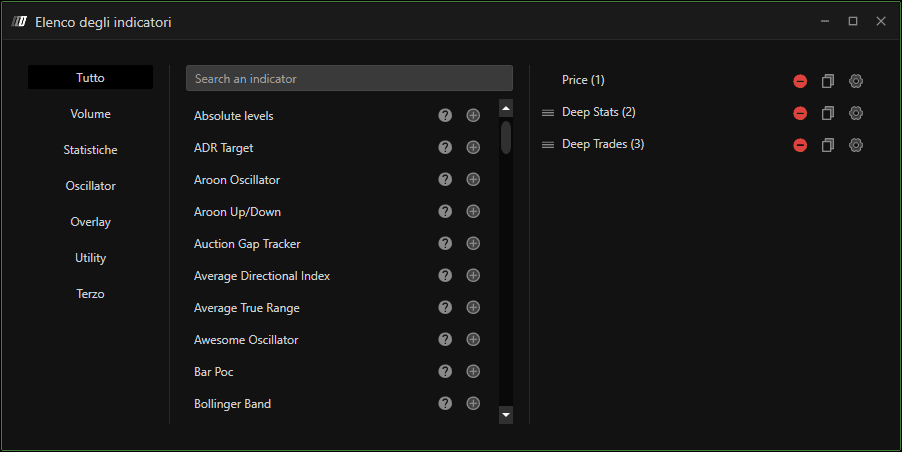
Nell'elenco degli indicatori, puoi aggiungere l'indicatore preferito facendo clic sul pulsante +. L'indicatore aggiunto verrà mostrato sul lato destro.
Puoi rimuovere l'indicatore aggiunto facendo clic sul pulsante - nel pannello di destra.
Puoi modificare le impostazioni dell'indicatore aggiunto facendo clic sull'icona a ingranaggio
Puoi modificare l'ordine dell'indicatore trascinando l'icona a tre linee verso l'alto o verso il basso.
Barra degli strumenti degli indicatori (Indicatori preimpostati)
Ogni grafico ha una barra degli strumenti nell'angolo in basso a sinistra, nella quale alcuni indicatori volumetrici sono già preimpostati e possono essere abilitati in modo molto semplice.
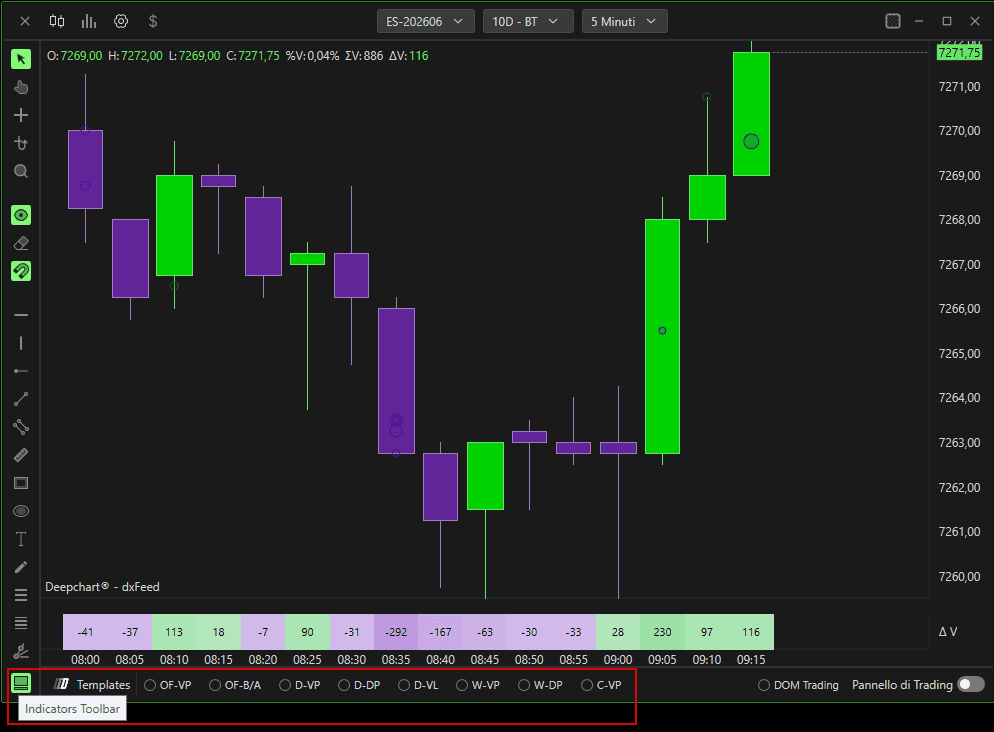
OF-VP: Order Flow Volume Profile
OF-B/A: Order Flow Bid / Ask
D-VP: Profilo Volume Giornaliero
D-DP: Profilo Delta Giornaliero
D-VL:
W-VP: Profilo Volume Settimanale
W-DP: Profilo Delta Settimanale
C-VP: Profilo Volume Composito
Navigazione sul grafico dei prezzi
Asse X
Per spostare l'asse X, basta fare uno scroll con la rotellina del mouse; in alternativa, fai clic con il tasto sinistro del mouse sulla timeline e trascina.
Scorrimento automatico : fai clic con il tasto destro sull'asse X per impostare lo scorrimento automatico; quando è abilitato, il prezzo avanzerà automaticamente con l'avanzare delle barre.
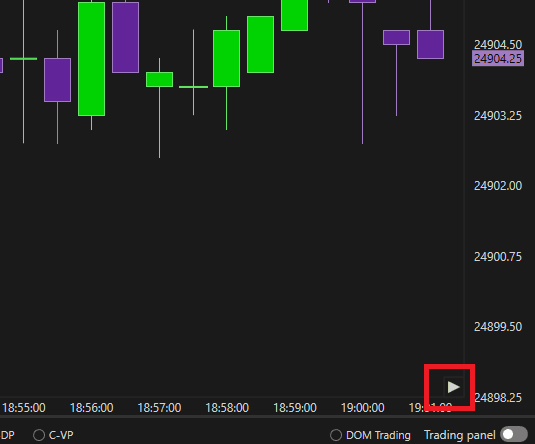
Fai doppio clic o premi il pulsante play in basso a destra (vedi immagine) per riportare il grafico alla barra corrente (barra più recente).
Asse Y
Scorrimento automatico: fai clic con il tasto destro sull'asse Y per impostare lo scorrimento automatico; quando è abilitato, l'asse seguirà il prezzo se esce dalla visualizzazione corrente del grafico.
Spostamento dell'asse Y: Fai clic con il tasto destro per vedere le impostazioni.
Tipo di parametro
Rilevamento automatico:
Se ti posizioni nella parte del grafico dell'asse Y, premendo il tasto sinistro del mouse potrai spostare l'asse, mentre se ti posizioni nella zona dell'asse in cui sono mostrati i prezzi, in alto o in basso, potrai ridimensionarlo.Sposta intervallo asse:
Premendo con il tasto sinistro del mouse in qualsiasi punto dell'asse Y (sia nel grafico sia sui prezzi) sposterai il grafico verso l'alto o verso il basso.Ridimensiona intervallo asse:
Premendo con il tasto sinistro del mouse in qualsiasi punto dell'asse Y (sia nel grafico sia sui prezzi) ridimensionerai gli intervalli di prezzo.
Annotazioni (Disegni)
Puoi fare clic con il tasto destro sul grafico per visualizzare/gestire gli strumenti di annotazione
Come scorciatoia, puoi trovare le annotazioni all'estremità sinistra del grafico dei prezzi.
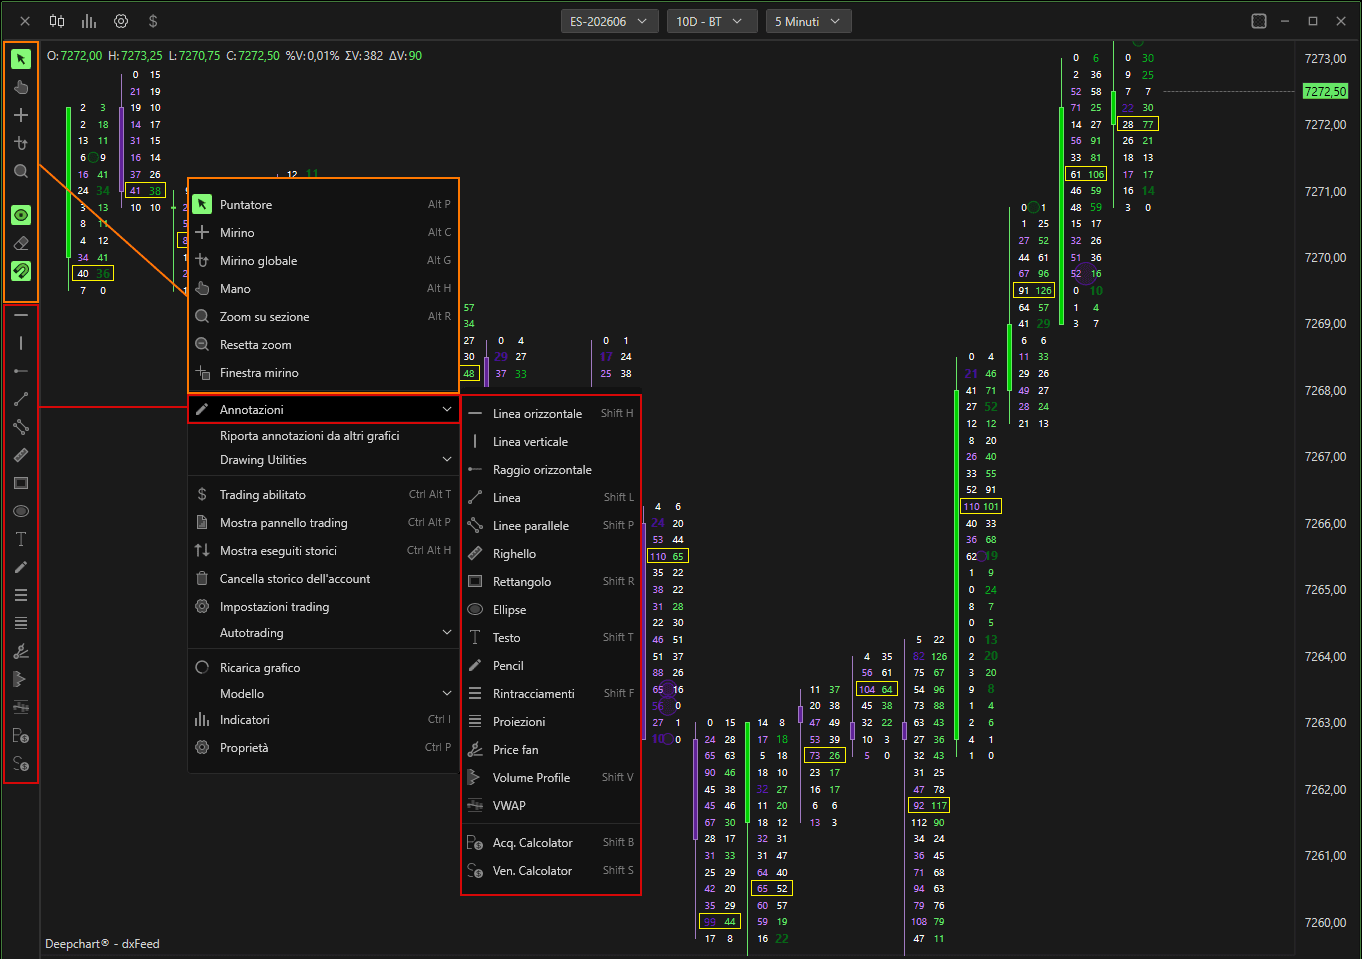
Puntatore
Attiva Puntatore (predefinito)
Mirino
Attiva Mirino
Visualizzatore Globale
Attiva la funzionalità globale del mirino
per vedere contemporaneamente il mirino su tutti i grafici dello stesso strumento presenti nel piano di lavoro
Mano
Ti consente di spostare il grafico verticalmente e orizzontalmente facendo clic sul grafico stesso con il tasto sinistro del mouse.
Intervallo Zoom
Ti consente di ingrandire una sezione desiderata. Fai clic sinistro sull'inizio e clic sinistro sulla sezione finale dello zoom.
Riduci Zoom
Ripristina intervallo zoom
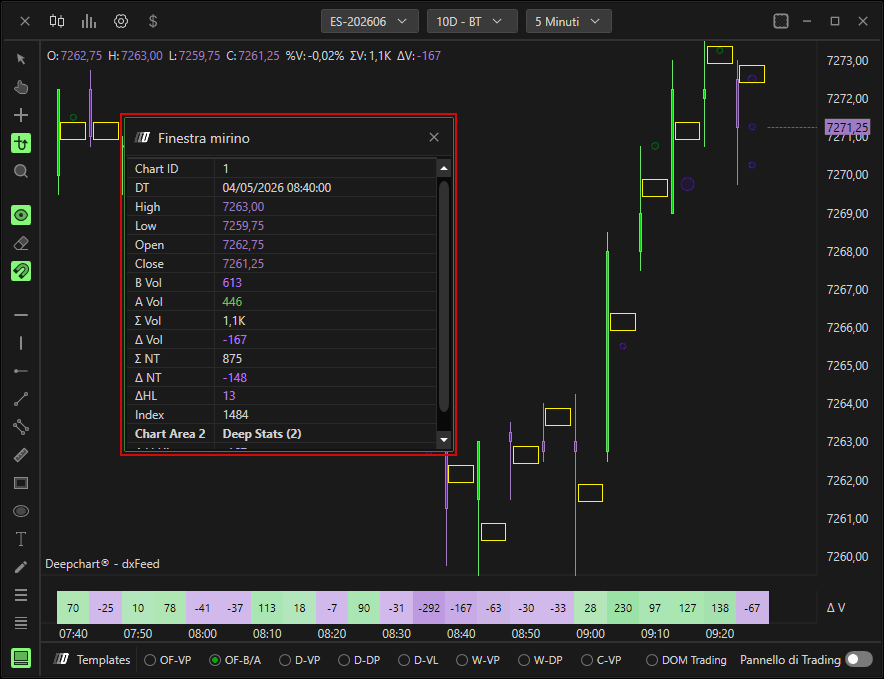
Finestra Mirino
Apre la finestra del mirino.
La finestra del mirino mostra dove puoi vedere i dettagli della posizione del mirino e l'intervallo di informazioni per ogni barra a cui punti il mirino, come High, Low, Open e Close oppure volume cumulato e trade cumulati (vedi immagine)
Oggetti di Disegno
Linea Orizzontale
Linea Verticale
Raggio Orizzontale
Linea
Linee parallele
Rettangolo
Testo
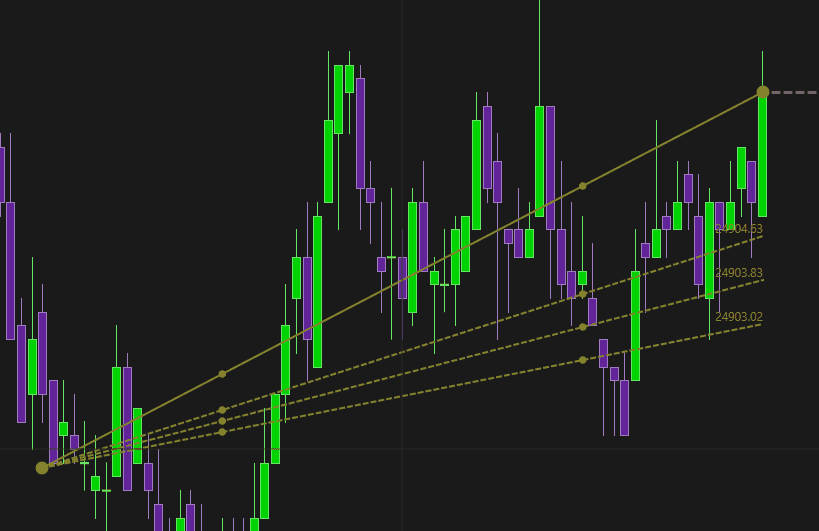
Ritracciamento di prezzo (Ritracciamento di Fibonacci)
Proiezione di prezzo (Proiezioni di Fibonacci)
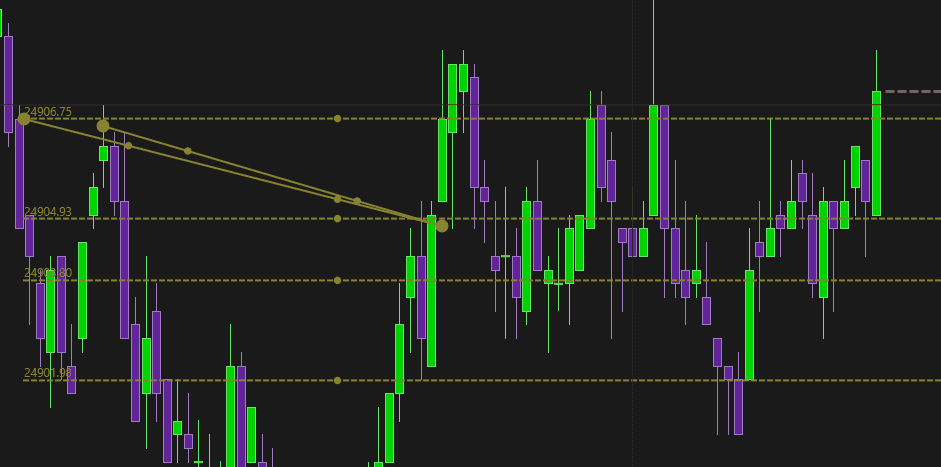
Ventaglio di prezzo
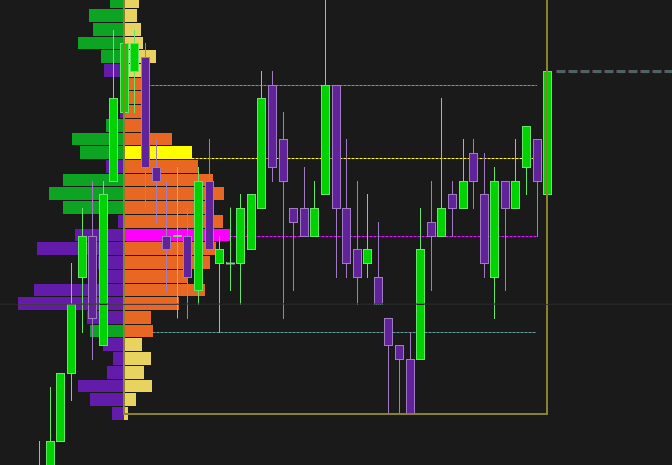
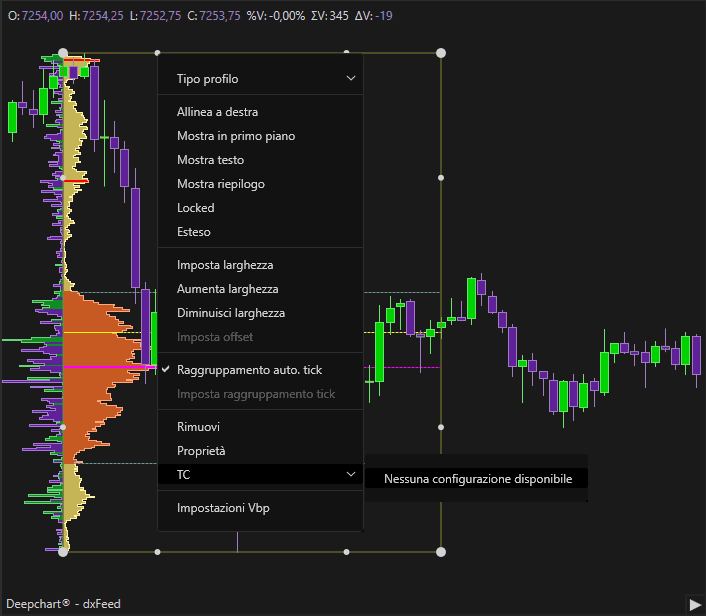
Profilo Volume: Crea il Profilo Volume nella tua sezione preferita
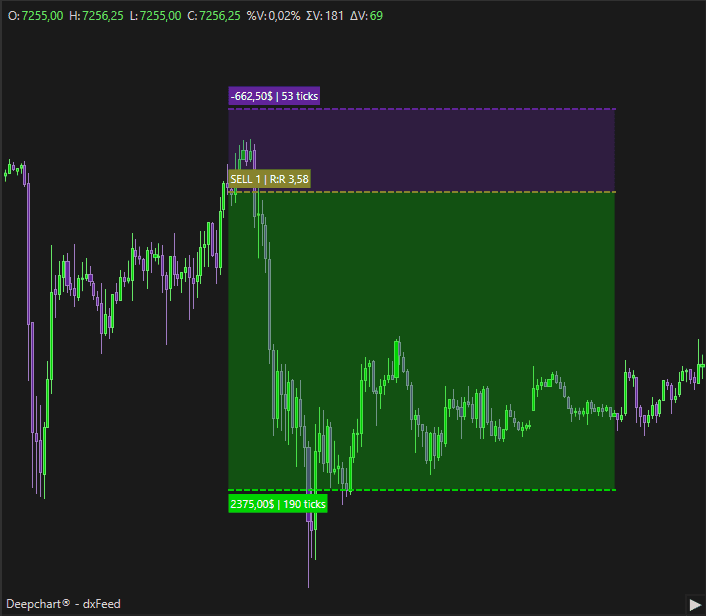
Calcolatore Acquisto
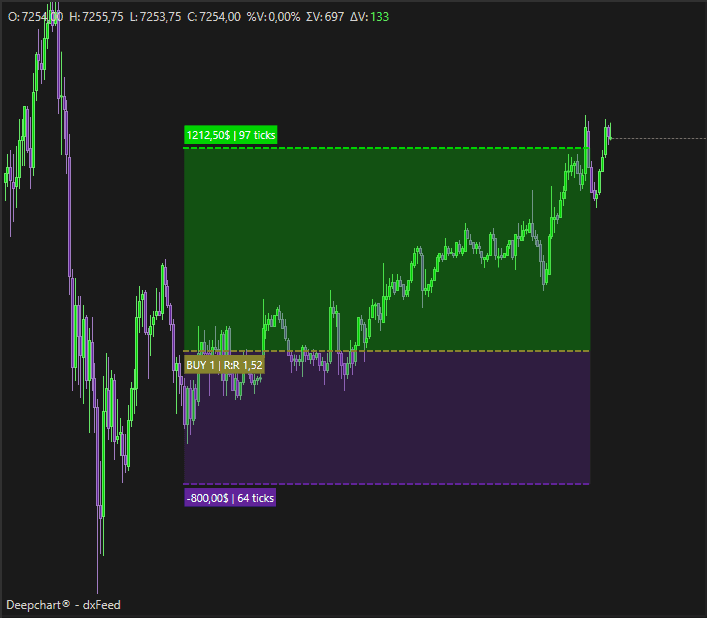
Calcolatore Vendita
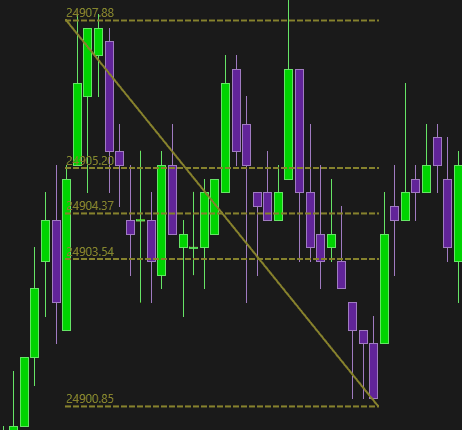
Impostazioni degli Oggetti di Disegno
Impostazioni Annotazione
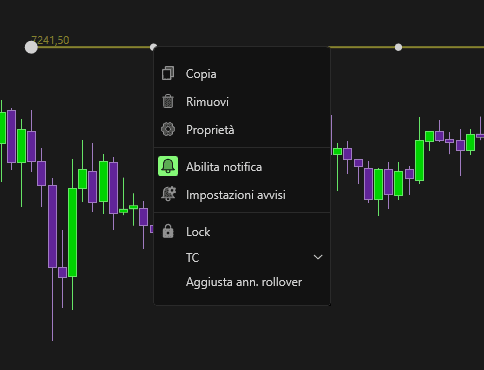
Per aprire le impostazioni degli oggetti di disegno, fai clic sinistro sul disegno e, quando sei sul disegno, puoi fare clic con il tasto destro per aprire le Impostazioni. Vai su Proprietà per aprire le Impostazioni annotazione
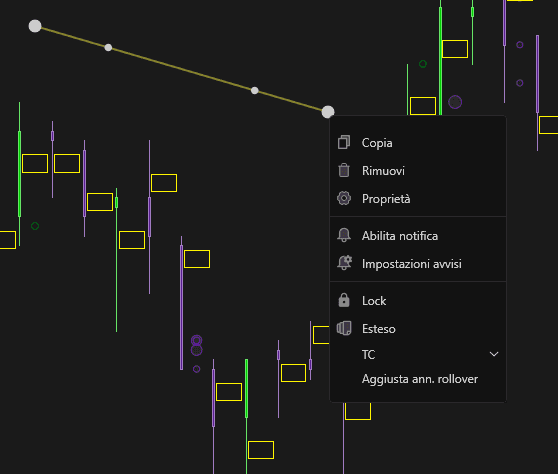
Puoi anche fare doppio clic sinistro per aprire le Impostazioni annotazione
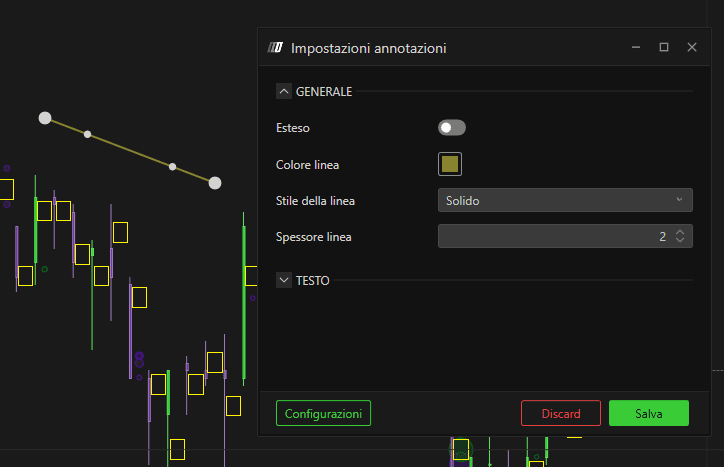
Puoi modificare colori e stili nelle Impostazioni annotazione.
Configurazioni Annotazione
Una volta impostate le configurazioni, puoi salvarle per usi futuri.
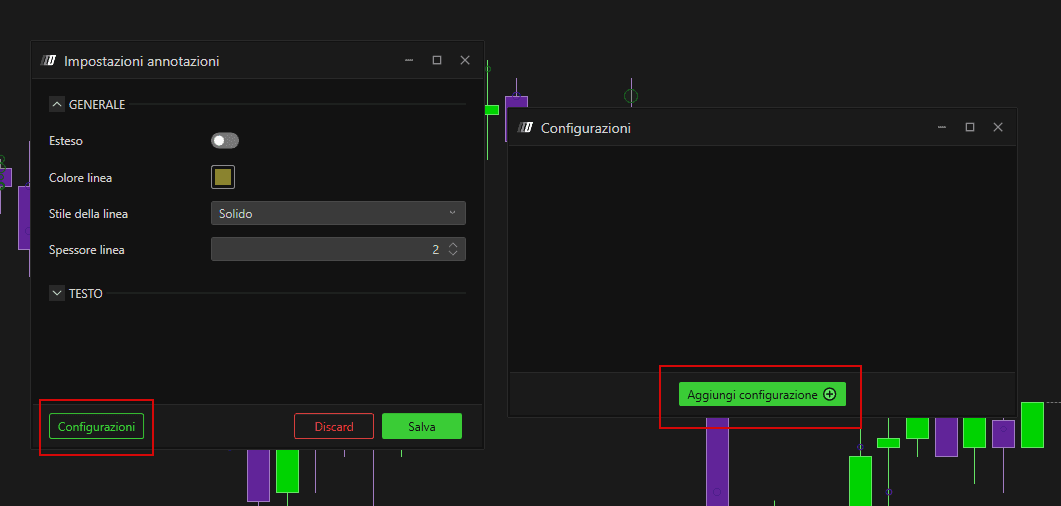
Puoi richiamare la configurazione facendo clic e poi facendo clic con il tasto destro sul disegno e aprendo Config. Strumento
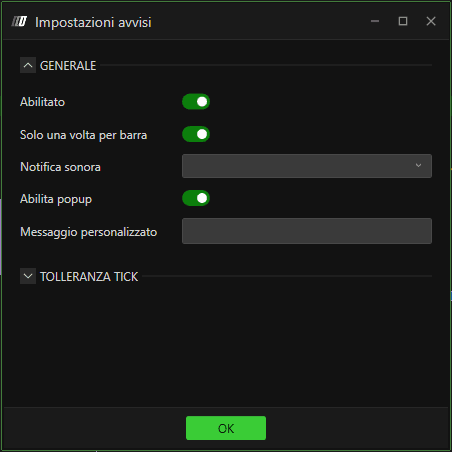
Avviso
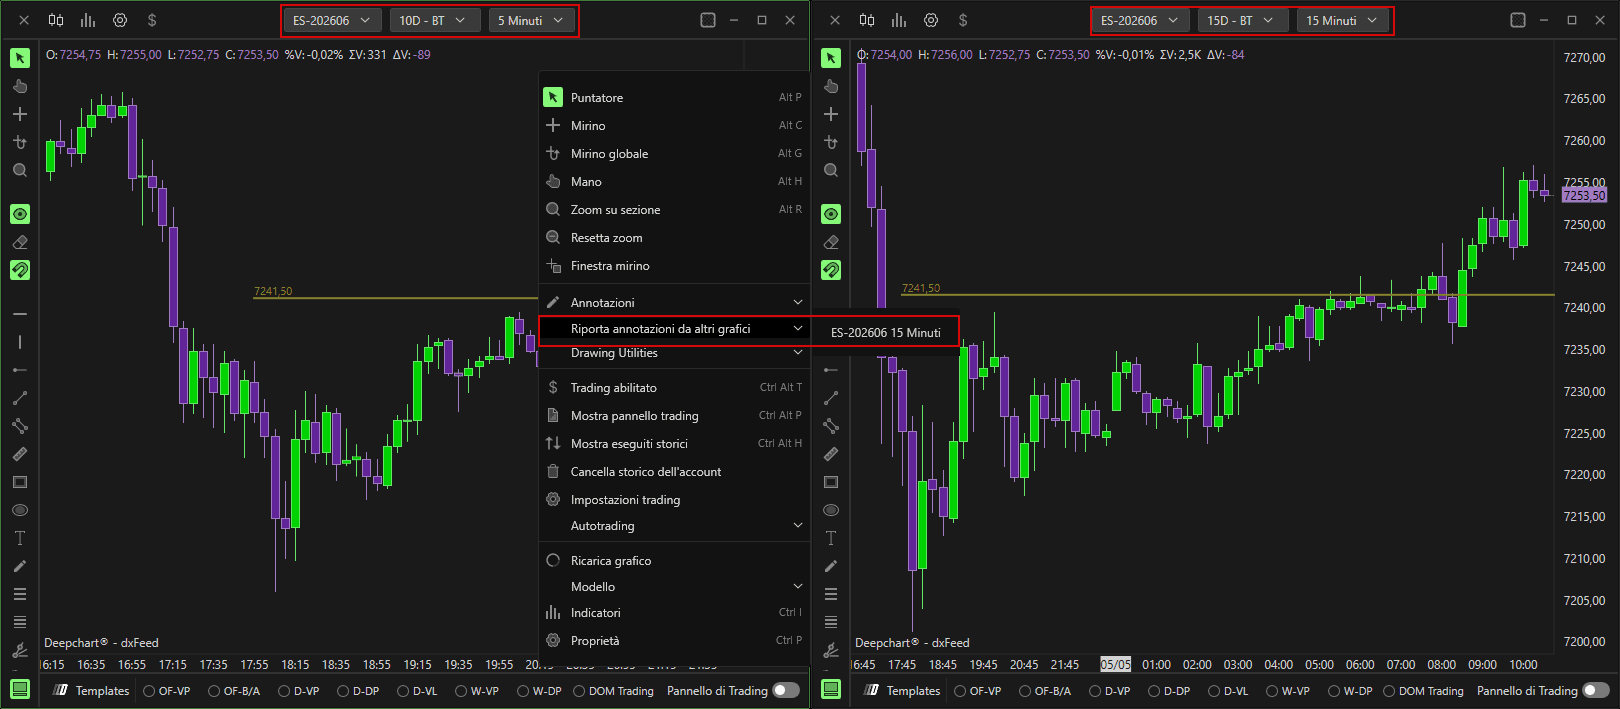
Strumenti di Disegno da un Altro Grafico
Puoi importare gli stessi disegni da un altro grafico
Importa/Esporta Annotazioni
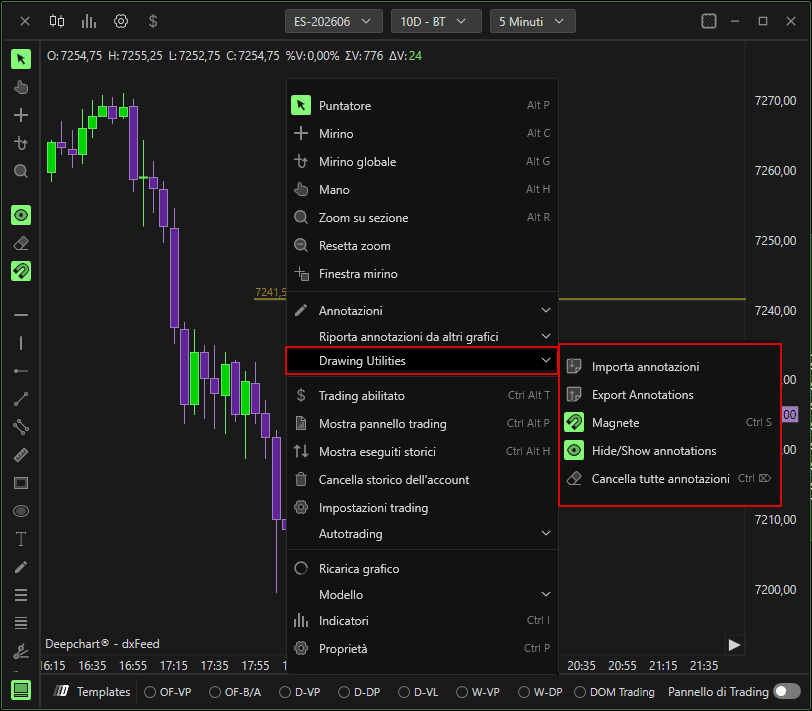
Puoi importare / esportare annotazioni con file salvati.
Ricostruisci Grafico
Ricarica il grafico.
Modello
Puoi caricare / salvare l'intero modello del Grafico dei Prezzi
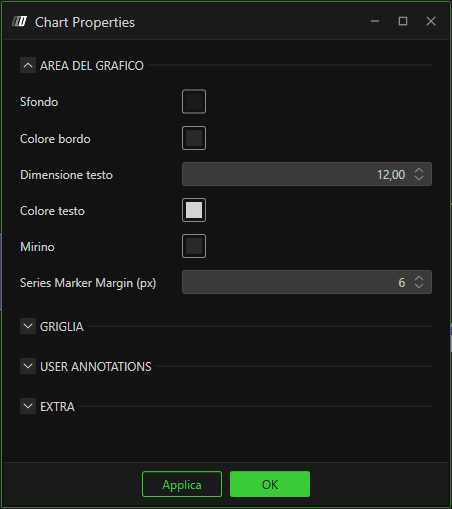
Proprietà
Puoi modificare i colori (ad es. lo sfondo), la dimensione e il nome della finestra del grafico