Generale
Updated:
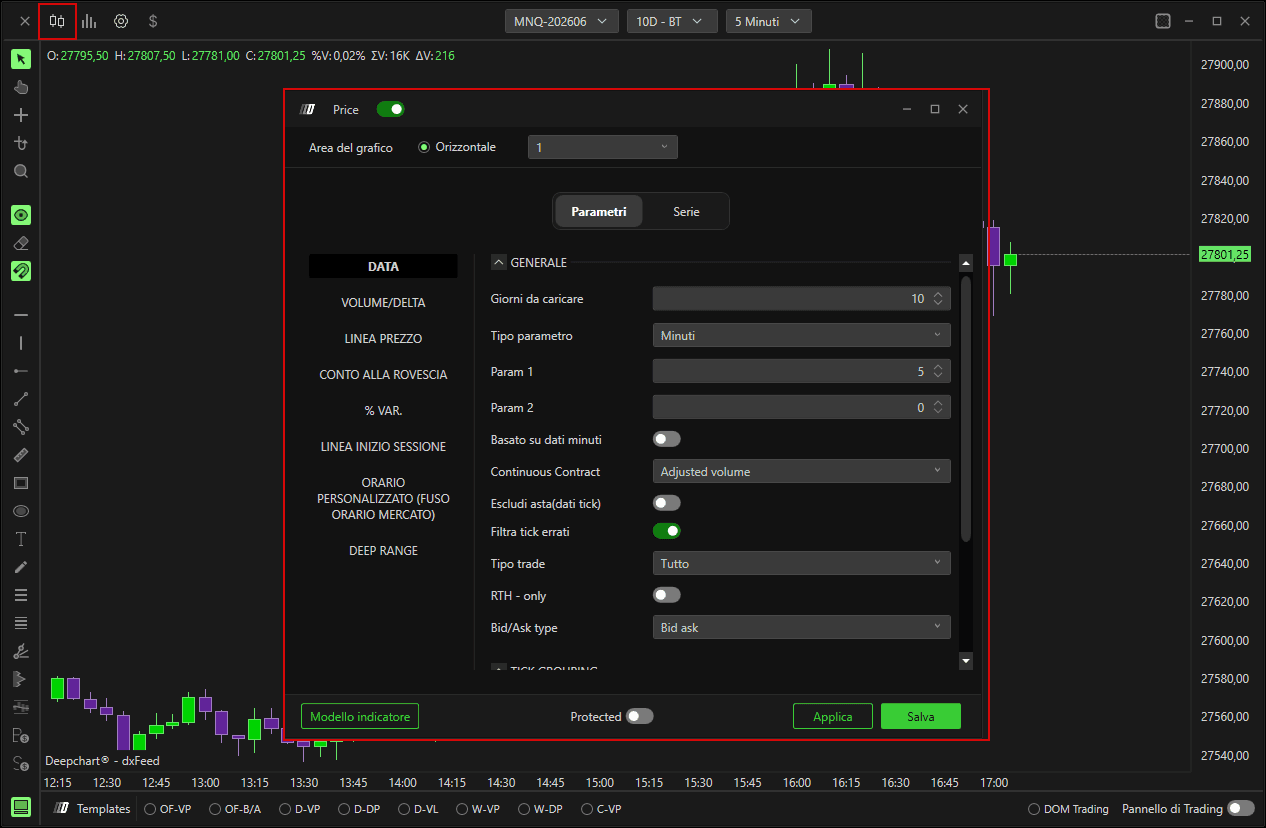
Per aprire le Impostazioni del prezzo, fai clic sull'icona con le due candele in alto a sinistra (vedi immagine)
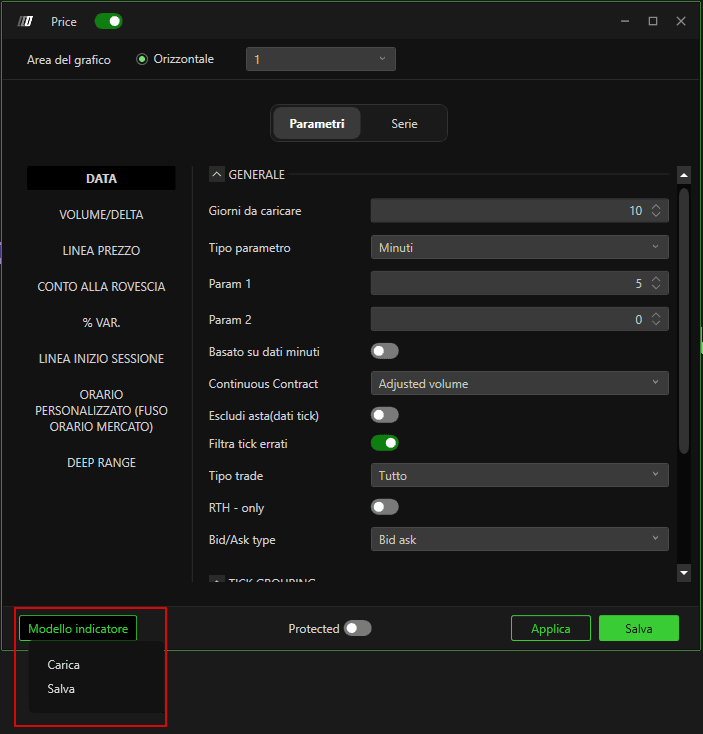
Parametri
Generale
Giorni da caricare
Definisce il numero di giorni da caricare nel grafico
Tipo di parametro
Minuto / Secondo / Giornaliero / Settimanale / Mensile
Ogni barra si basa su minuto, secondo, giornaliero, settimanale, mensile.Vol bars
Richiede due parametri, Target e Reverse; il primo parametro definisce il Target in termini di numero minimo di tick che la barra deve raggiungere. Una volta raggiunto questo obiettivo minimo, il secondo parametro definisce il Reverse in termini di tick che la barra deve fare per crearne una nuova.Range
Definisce il range in termini di tick di ogni singola barra. Per esempio, se è impostato un grafico Range 10, ogni nuova barra verrà creata ogni volta che il prezzo si muove da massimo a minimo di più di 10 tick.Volume
Definisce il volume massimo di ogni barra; una volta raggiunto quel volume verrà creata una nuova barra.Trades
Definisce il numero massimo di trade di ogni barra; una volta raggiunto quel valore verrà creata una nuova barra.Renko
Simile ai grafici Range, definisce un certo parametro in termini di tick, ad esempio 10; verrà creata una nuova barra ogni volta che il prezzo si muove di 10 tick dal corpo della candela precedentePoint figure
Come i Vol Bars, richiede due parametri, Target e Reverse: il primo definisce la dimensione del box e il secondo l'ammontare dell'inversione. Quando dal massimo o dal minimo della candela c'è un ritracciamento uguale al parametro 2, si forma una nuova candela.Delta
Definisce il delta, in valore assoluto, di ogni barra; una volta raggiunto questo valore verrà creata una nuova barra.
Param 1
Definisce il numero di giorni da caricare nel graficoParam 2
Definisce il secondo parametro nei grafici Vol bars e Point figure.Dati basati sui minuti
Definisce il tipo di dato su cui si basa la costruzione del grafico. Di default, la fonte dati sarà tick, offrendo la massima precisione in termini di ordini eseguiti, permettendo così di definire tick per tick se un contratto viene eseguito su Bid o Ask, abilitando quindi il calcolo del delta. Si consiglia di abilitare il database a minuti quando è necessario caricare uno storico dati molto ampio, per analisi su periodi più lunghi.Contratto continuo
Nei Futures è possibile visualizzare il contratto sintetico, cioè quel contratto che combina le varie scadenze a cui i futures stessi sono soggetti, consentendo all'utente di effettuare analisi più di lungo periodo;Nessuno
Non viene eseguito alcun rollover.Data
Il rollover si basa sulla scadenza temporale di ogni singolo contratto.Volume
Il rollover si basa sul volume, cioè sul momento in cui sul contratto successivo viene registrato più volume rispetto al contratto in scadenza.Regolato sulla Data
Esegue il rollover in base alla scadenza temporale e applica un aggiustamento alla serie storica dei prezzi in base al contango o alla backwardation tra il contratto in scadenza e il nuovo contratto.Regolato sul Volume
Esegue il rollover in base al volume e applica un aggiustamento alla serie storica dei prezzi in base al contango o alla backwardation tra il contratto in scadenza e il nuovo contratto.
Escludi asta (dati tick)
Se abilitato, esclude i dati derivanti dalle aste di apertura e chiusura. Opzione utile nei mercati azionari per evitare che i volumi scambiati in quelle fasi compensino i volumi scambiati nella negoziazione continua.
Volume/Delta
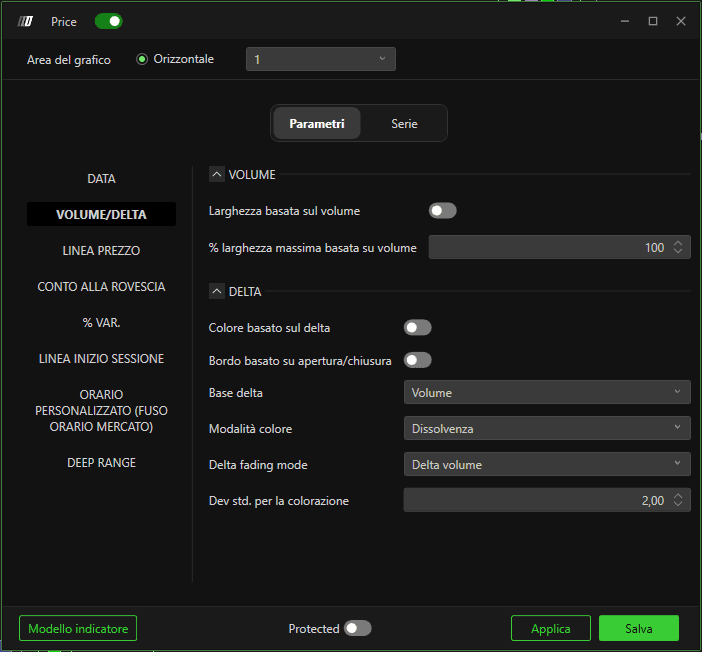
Volume
% di larghezza massima basata sul volume
Imposta la larghezza massima in % delle candele in base al volume% di larghezza massima basata sul volume
Imposta la larghezza massima in % delle candele in base al volume
Delta
Colore in base al delta
Quando abilitato, il colore delle candele varierà in base al delta di ogni barra.
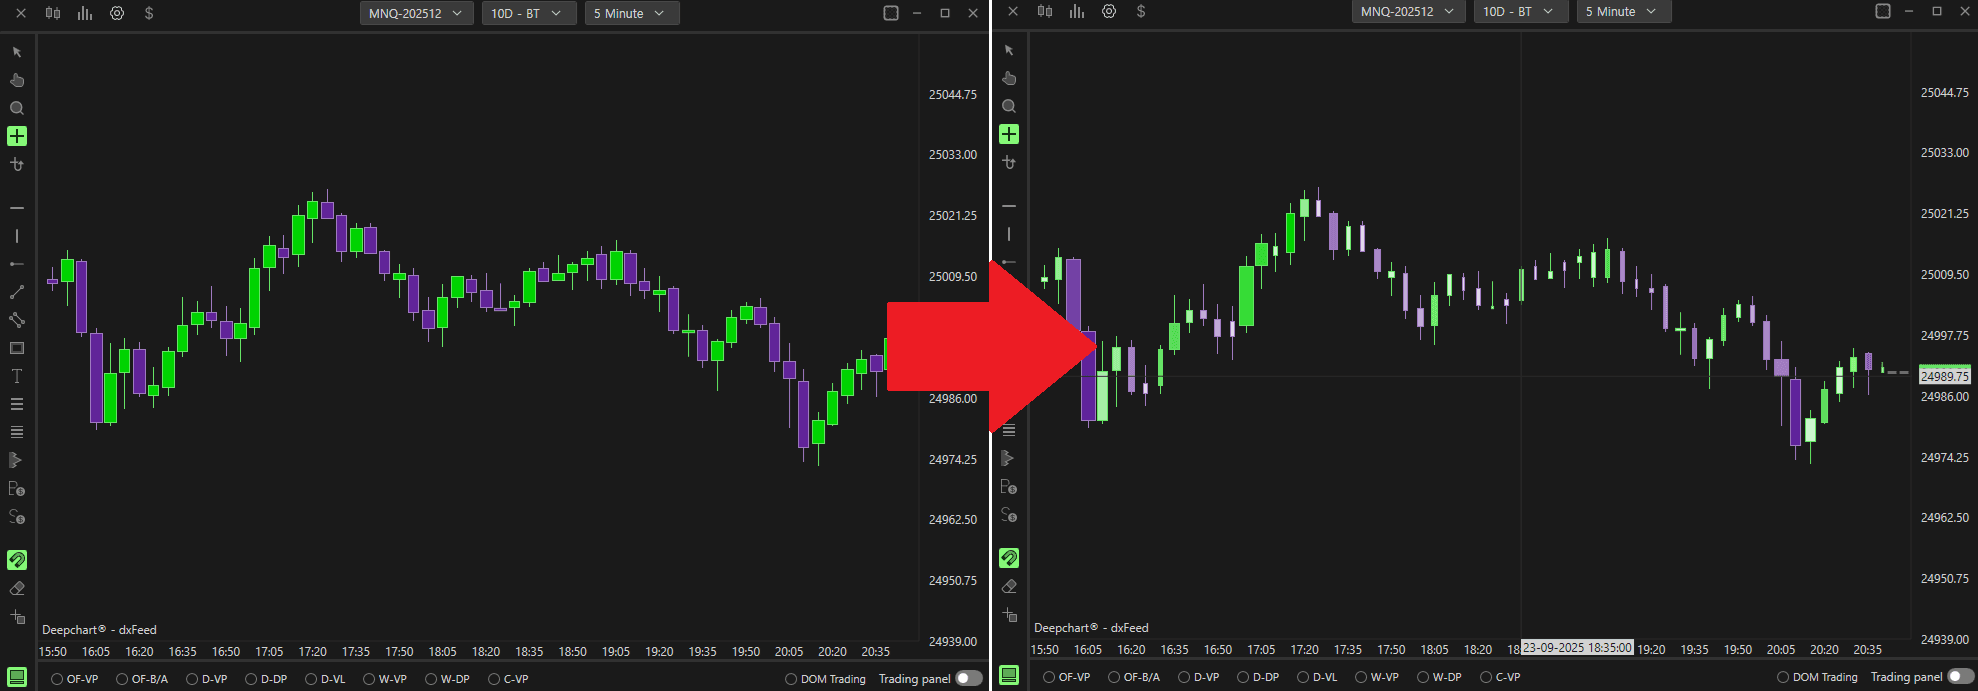
Linea del prezzo
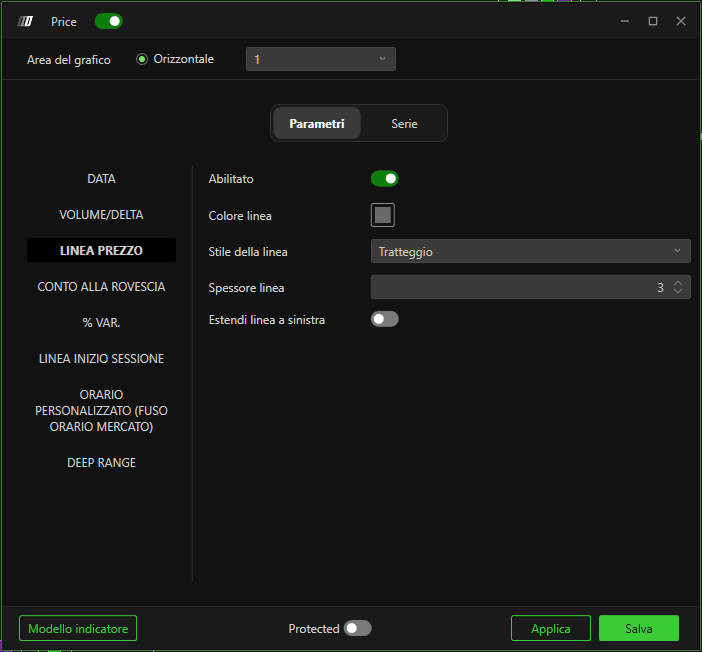
Questa impostazione è per la linea del prezzo corrente
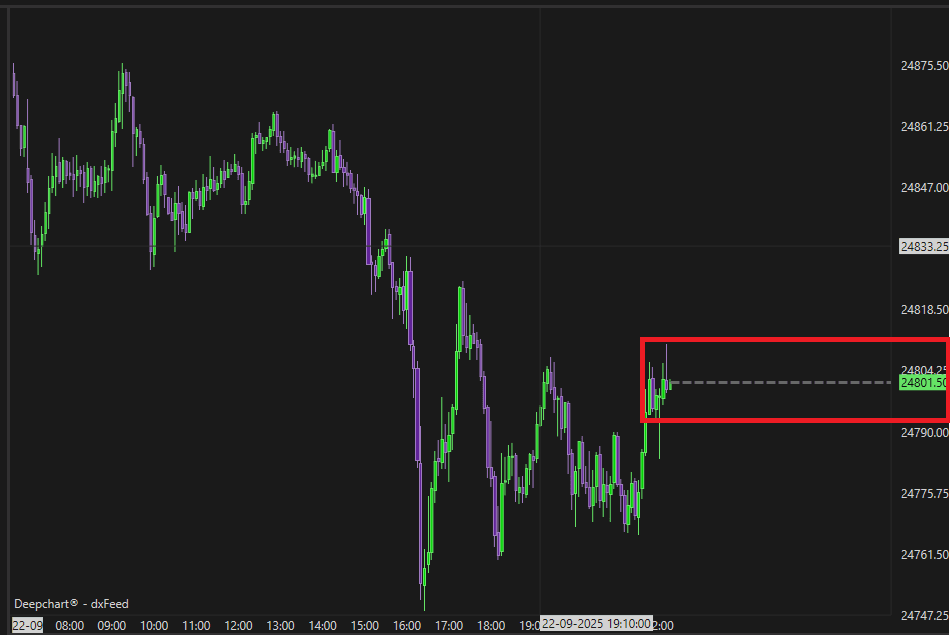
Abilitato
Se abilitato, mostrerà la linea del prezzo corrente (vedi immagine)Colore linea
Imposta il colore della linea del prezzo.Stile linea
Imposta lo stile della linea del prezzoLarghezza linea
Imposta lo spessore (dimensione) della linea del prezzoEstendi la linea a sinistra
Quando abilitato, la linea del prezzo viene mostrata anche a sinistra.Indicatore Countdown

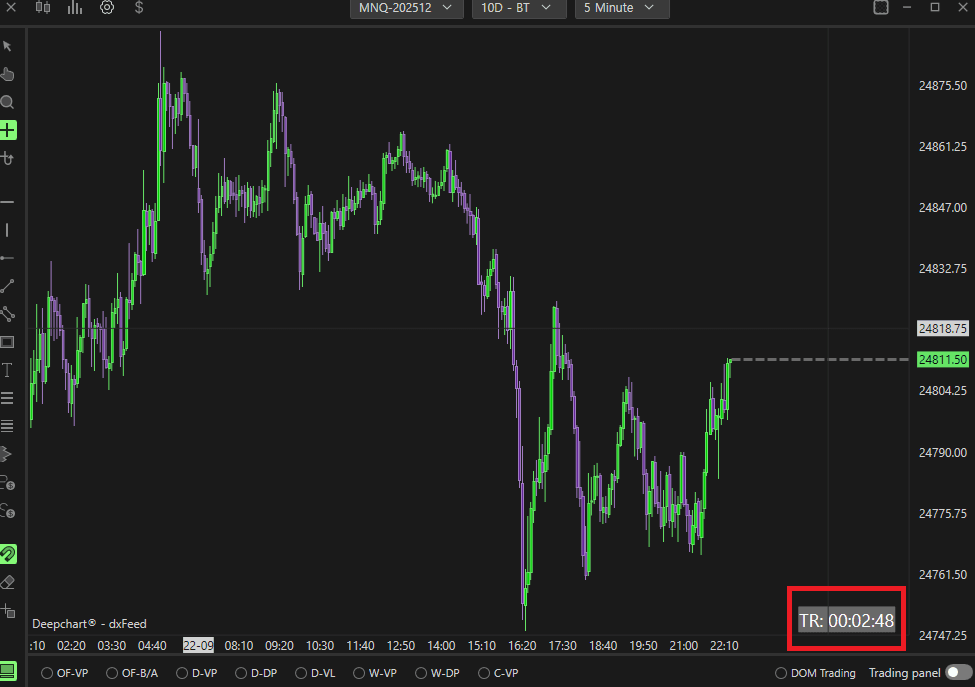
Questa è l'impostazione per il conto alla rovescia per la formazione della barra successiva. Puoi spostare il riquadro facendo clic sul riquadro e trascinandolo
Abilitato
Quando abilitato, sul grafico dei prezzi apparirà il riquadro del conto alla rovescia per la formazione della barra successiva (vedi immagine).Dimensione testo
Imposta la dimensione del testo del conto alla rovesciaColore testo
Imposta il colore del testo del conto alla rovesciaColore sfondo
Imposta il colore dello sfondo del riquadro del conto alla rovesciaVariazione percentuale
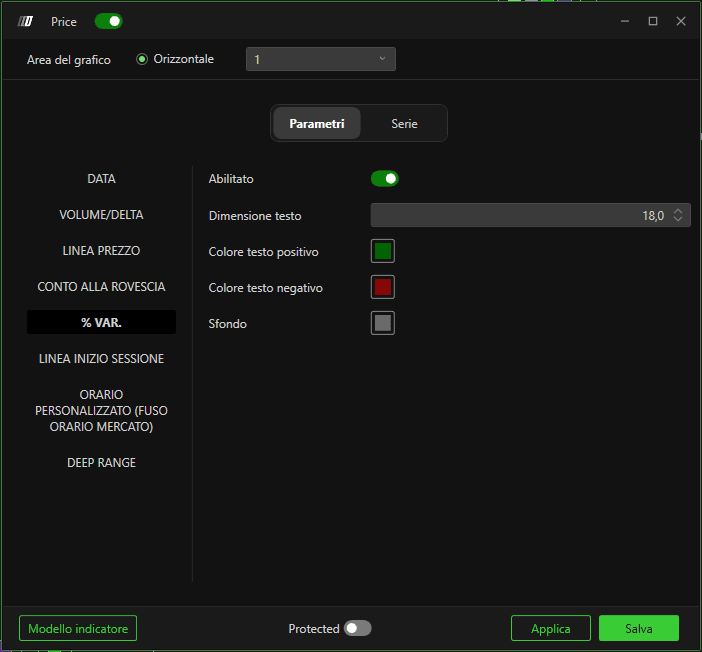
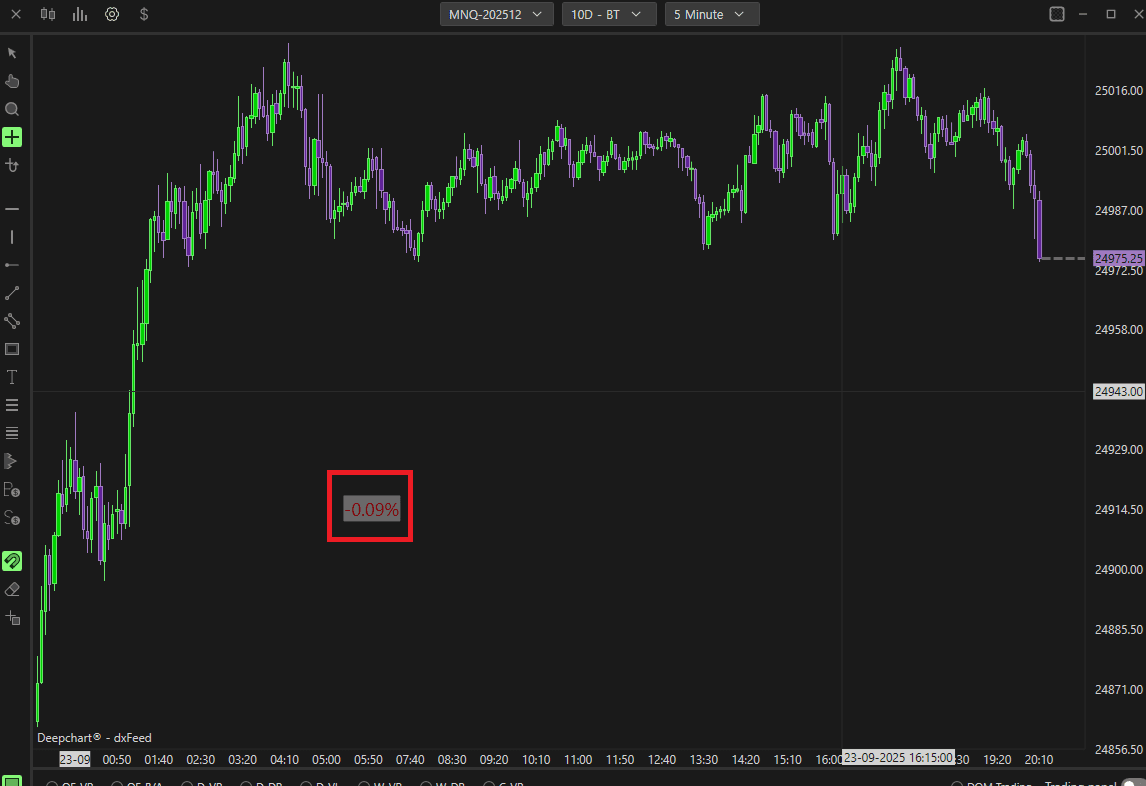
Puoi spostare il riquadro facendo clic sul riquadro e trascinandolo
Abilitato
Quando abilitato, sul grafico dei prezzi apparirà la variazione % rispetto al prezzo di chiusura della sessione precedente.Dimensione testo
Imposta la dimensione del testo della variazione %Colore testo pos.
Imposta il colore del testo della variazione % per variazione positivaColore testo neg.
Imposta il colore del testo della variazione % per variazione negativaColore sfondo
Imposta il colore dello sfondo del riquadro % VarLinea inizio giornata
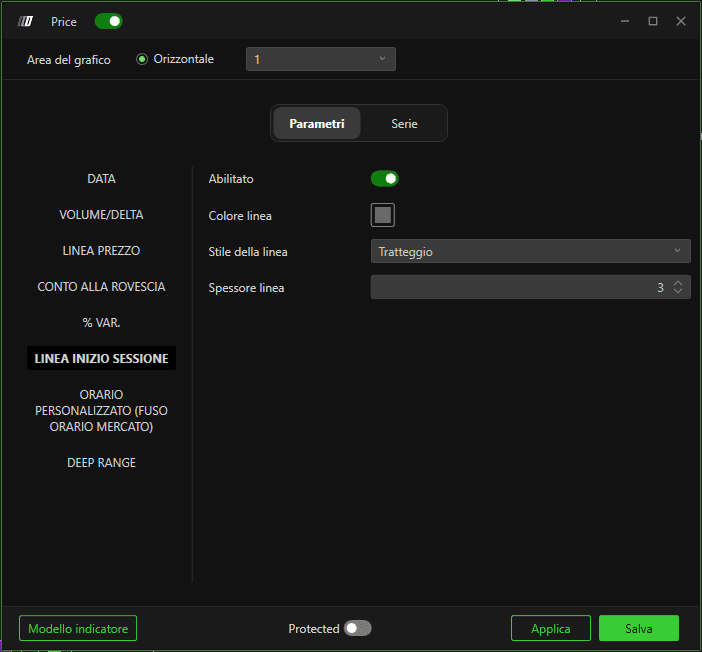
Abilitato
Quando abilitato, sul grafico dei prezzi apparirà una linea verticale all'inizio di una sessioneColore linea
Imposta il colore della linea di inizio sessioneStile linea
Imposta lo stile della linea di inizio sessione (l'immagine mostra lo stile: Dash)Larghezza linea
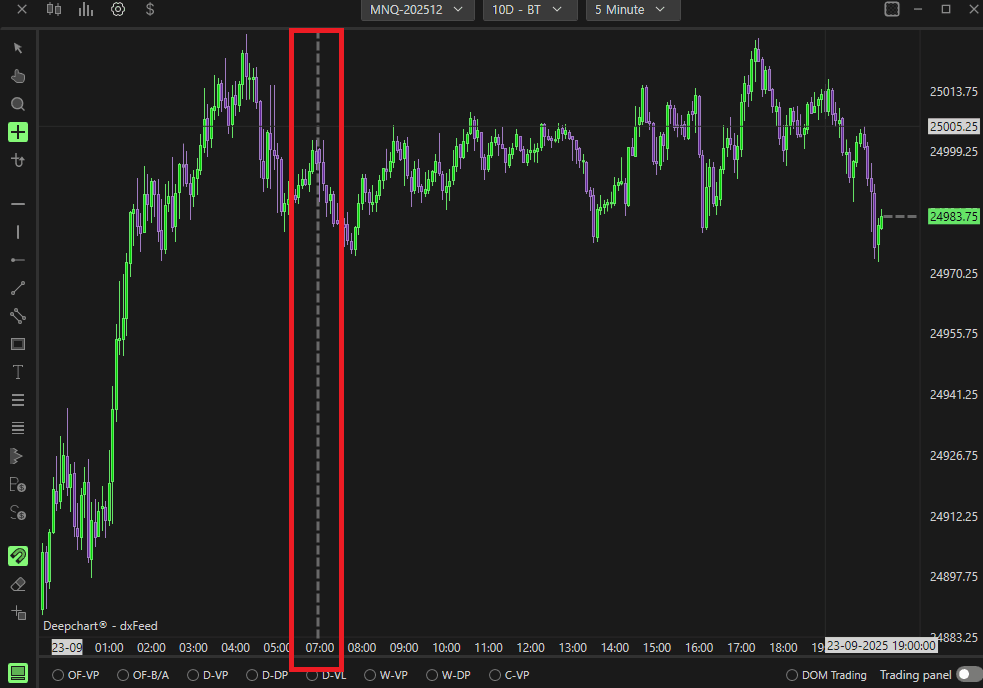
Imposta lo spessore della linea di inizio sessioneSessione oraria personalizzata (fuso orario dell'exchange)
Abilitato
Quando abilitato, consente di personalizzare l'orario di inizio e fine della sessione, utile per evidenziare nei futures la sola sessione cash. La piattaforma tiene conto del fuso orario del mercato, quindi per evidenziare la sessione cash nei futures quotati al CME (Chicago Mercantile Exchange), devi inserire 09:30-16:00.Ora inizio
Imposta l'ora di inizio per la sessione oraria personalizzataOra fine
Imposta l'ora di fine per la sessione oraria personalizzata
Sottografici
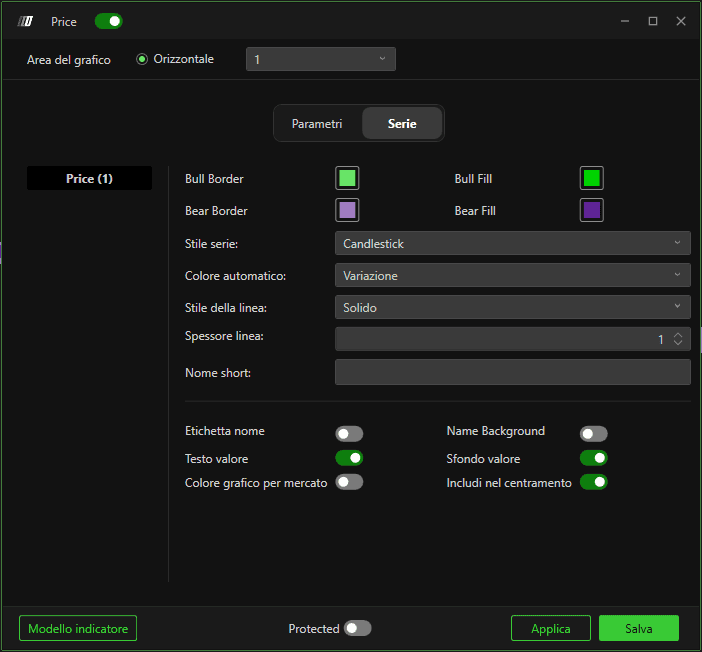
Qui puoi impostare gli stili delle candele. Puoi cambiare gli stili in: Linea, Candlestick, OHLC, Nascosto e Candlebody.
La Value Label in basso è per il marcatore del prezzo corrente.
Template dell'indicatore
 |  |
|
|
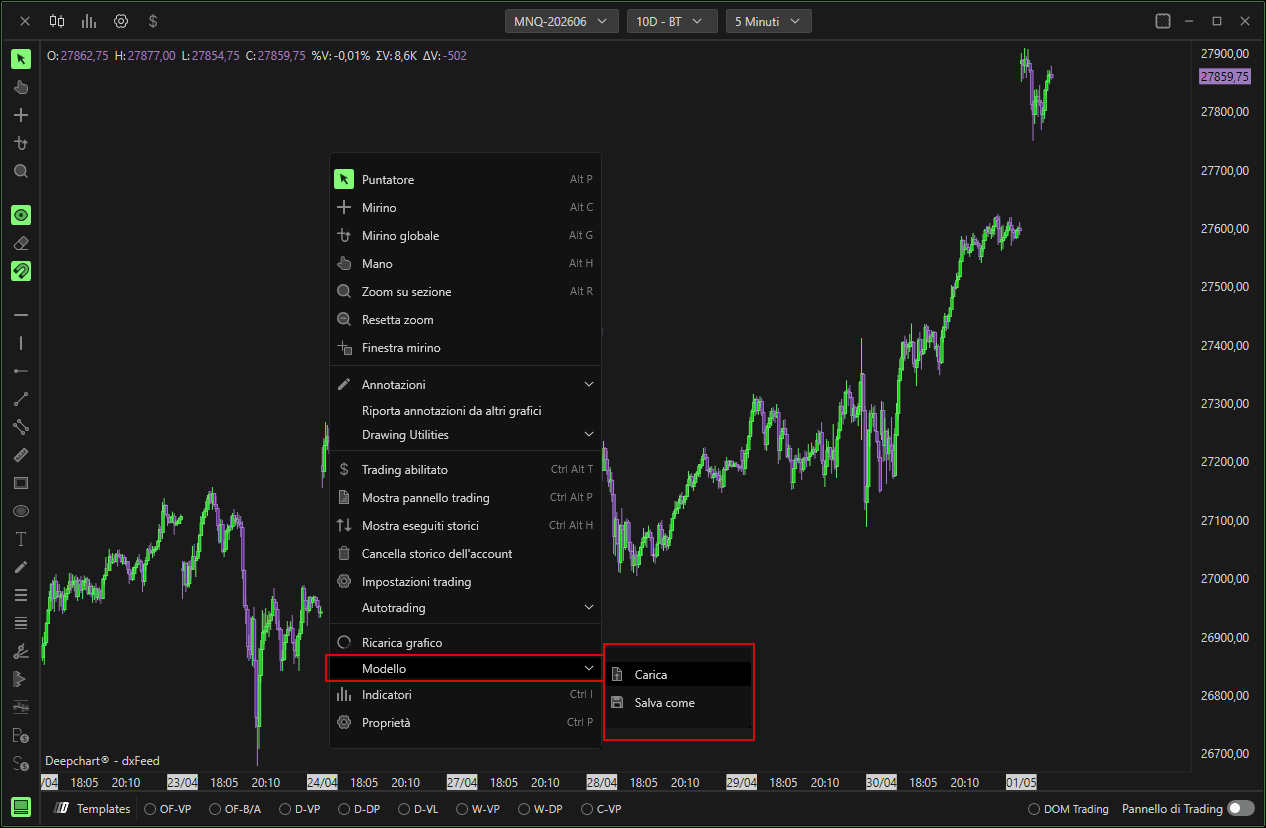
Template
Puoi caricare / salvare l'intero template del grafico dei prezzi
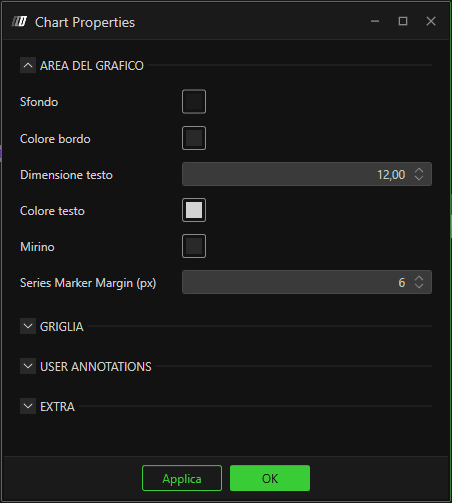
Proprietà
Puoi cambiare i colori (ad es. lo sfondo), la dimensione e il nome della finestra del grafico