Indicatori
Updated:
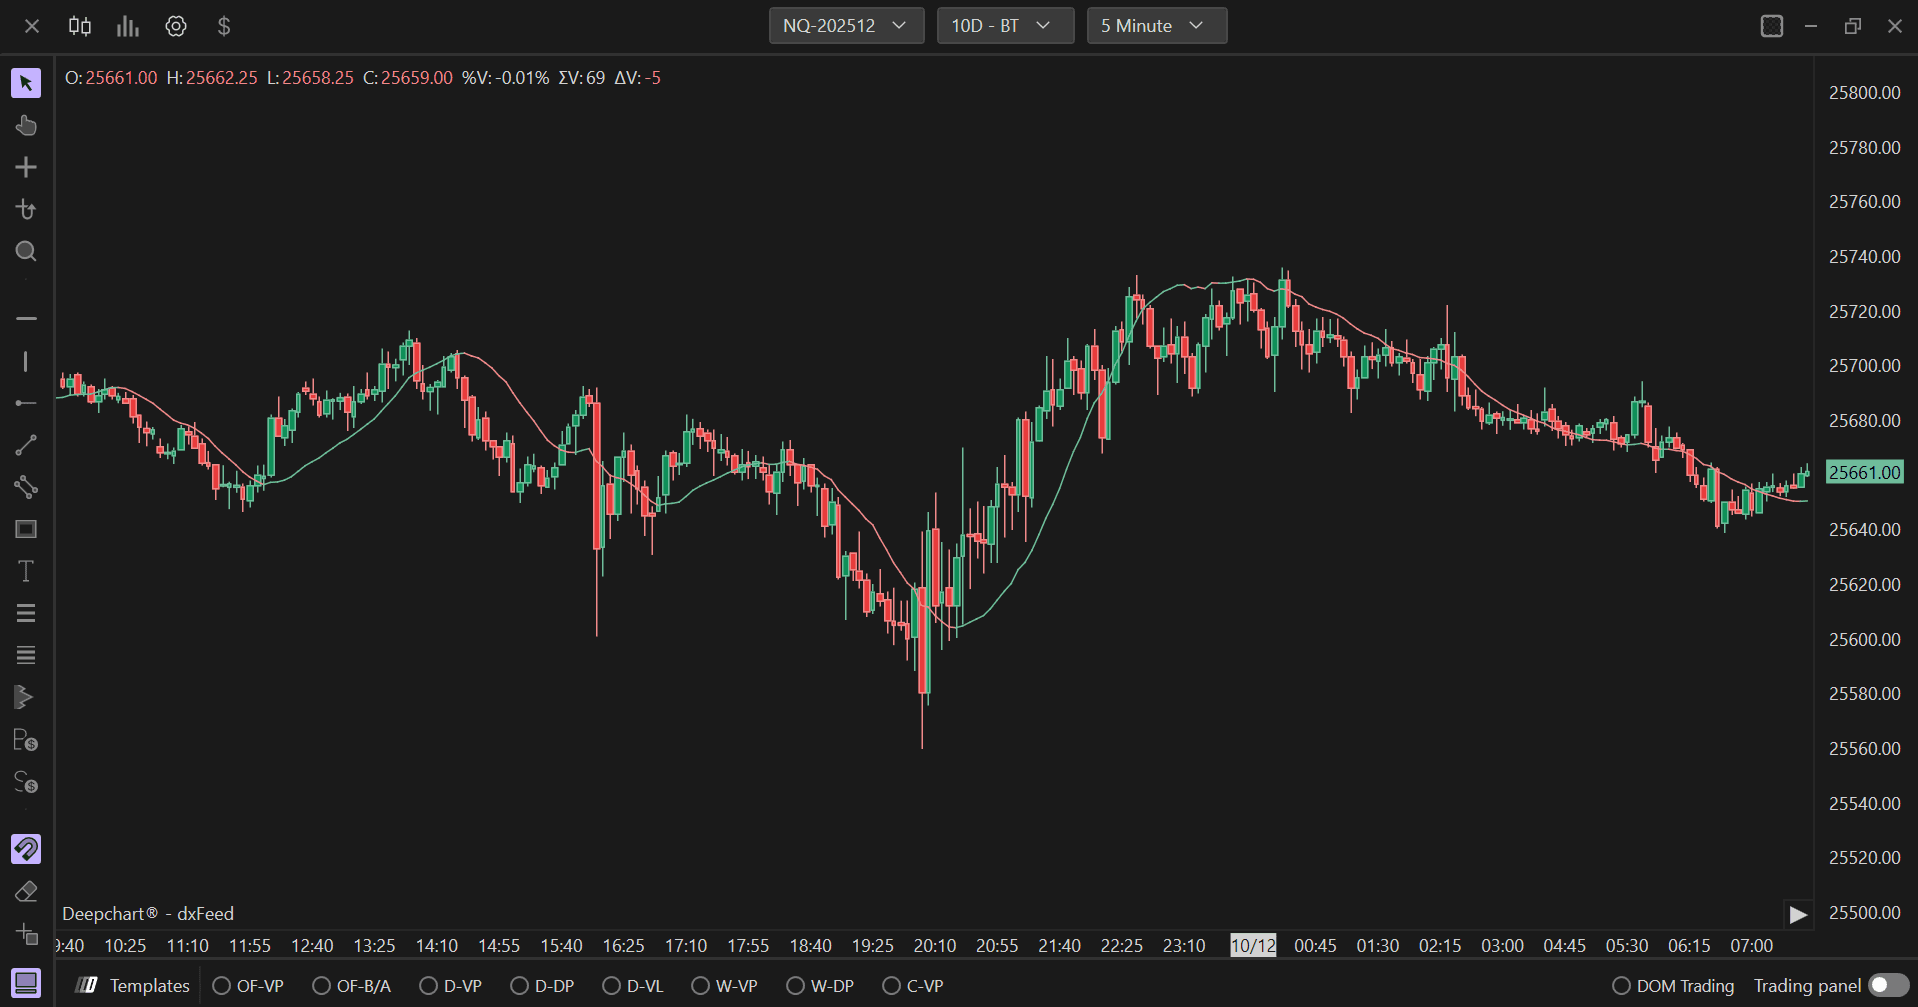
L indicatore Linear Regression è uno strumento di analisi tecnica che calcola e visualizza una linea di trend basata sul metodo della regressione lineare, cioè una linea che minimizza la distanza dai punti di prezzo in un periodo specifico. Questo indicatore aiuta i trader a identificare la direzione del trend e a prevedere i futuri movimenti dei prezzi individuando zone dinamiche di supporto e resistenza.
Utilizzo delle impostazioni
Facendo clic sull'icona delle impostazioni dell'indicatore si apre la finestra di configurazione, all'interno della quale puoi effettuare diverse scelte relative alla funzionalità dell'indicatore.
Parametri
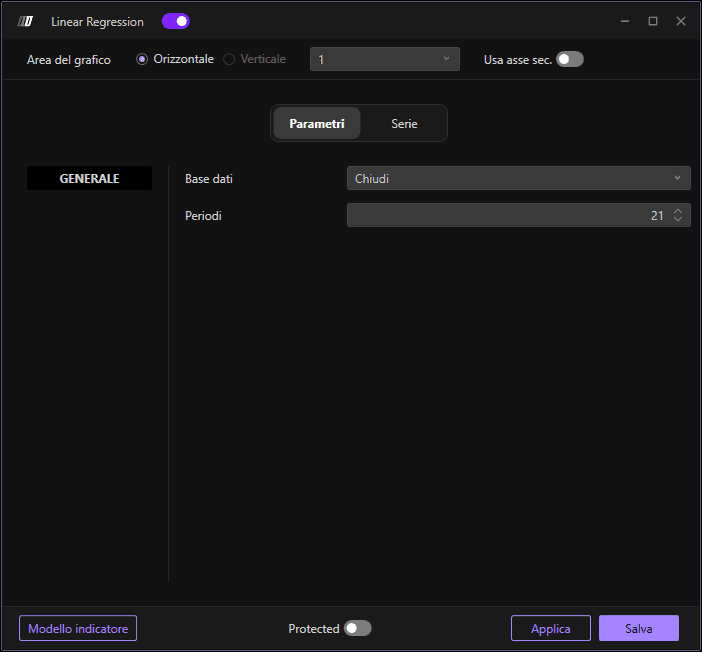
Nella sezione Parametri puoi selezionare:
Dati di input: I dati di prezzo da usare per il calcolo (Chiusura, Apertura, Massimo, Minimo e Volume)
Lunghezza: Il numero di periodi su cui viene calcolata la linea di regressione lineare (predefinito: 21 periodi)
Sottografico
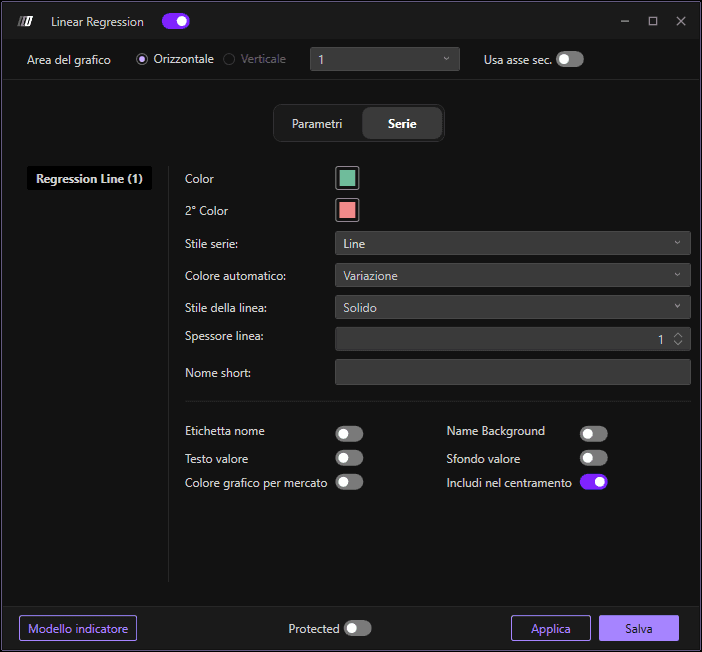
Nella sezione Sottografico puoi modificare i colori e lo stile della linea:
Colore della linea di regressione: Imposta il colore della linea di regressione
Colore secondario: Imposta un colore secondario opzionale
Stile del sottografico: Scegli lo stile di visualizzazione
Stile della linea: Definisci lo stile della linea
Spessore della linea: Definisci lo spessore della linea
Usa asse secondario: Opzione per visualizzare su un asse secondario