Indicatori
Updated:
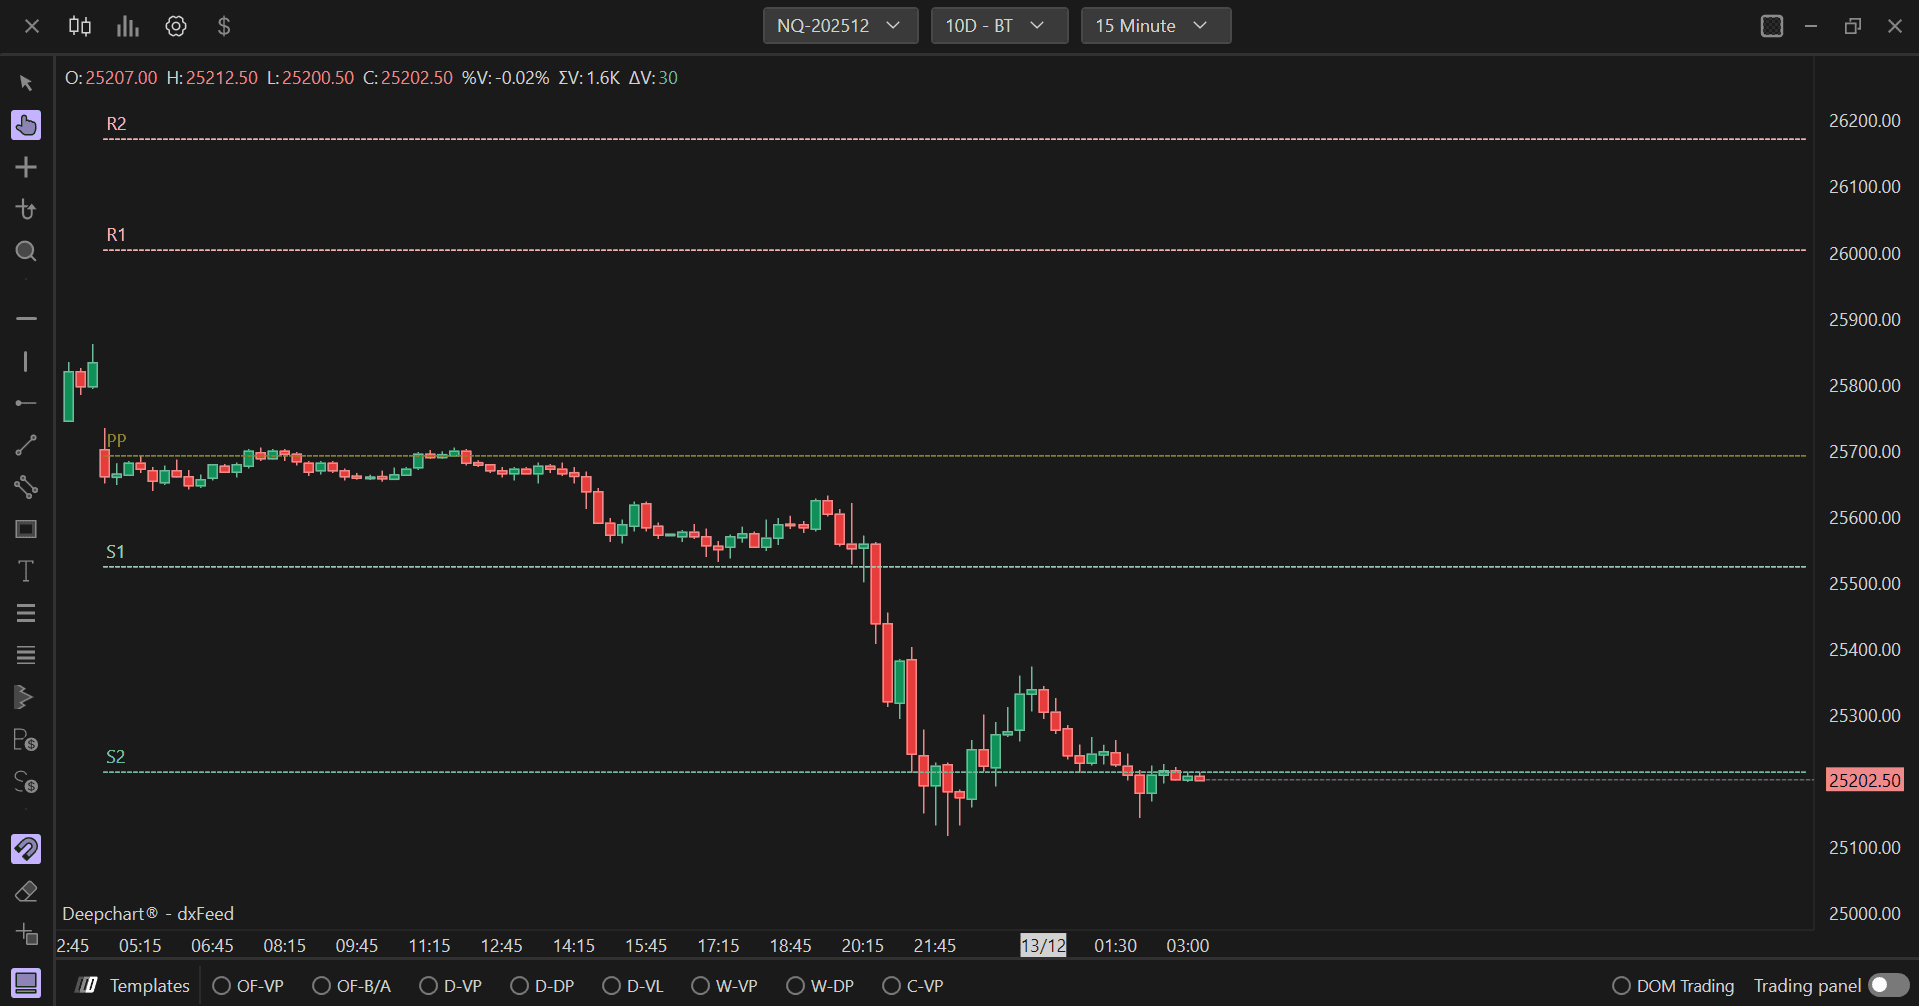
I Pivot Points sono uno degli strumenti di analisi tecnica più utilizzati per identificare potenziali livelli di supporto e resistenza. Vengono calcolati utilizzando i prezzi massimo, minimo e di chiusura di un periodo precedente (di solito giornaliero, settimanale o mensile).
Utilizzo delle impostazioni
Facendo clic sull'icona delle impostazioni dell'indicatore si aprirà la sua finestra di configurazione, all'interno della quale potrai effettuare diverse scelte relative alla funzionalità dell'indicatore.
Impostazioni di visualizzazione
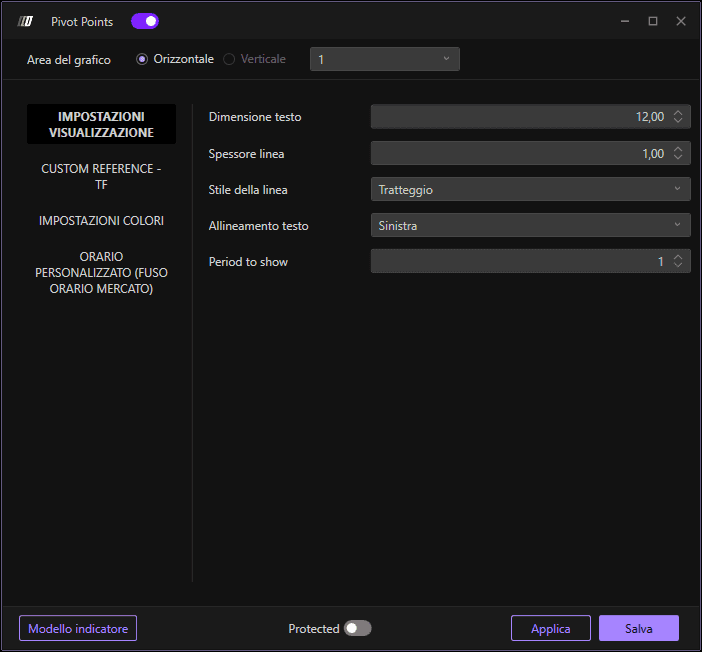
Configura l'aspetto visivo dell'indicatore:
Dimensione carattere: Imposta la dimensione del font per le etichette (predefinito: 12.00)
Spessore linea: Definisci lo spessore delle linee dei Pivot Point (predefinito: 1.00)
Stile linea: Scegli lo stile della linea
Allineamento etichette: Imposta l'allineamento del testo
Periodo da mostrare: Numero di periodi da visualizzare (predefinito: 1)
Riferimento personalizzato - Timeframe
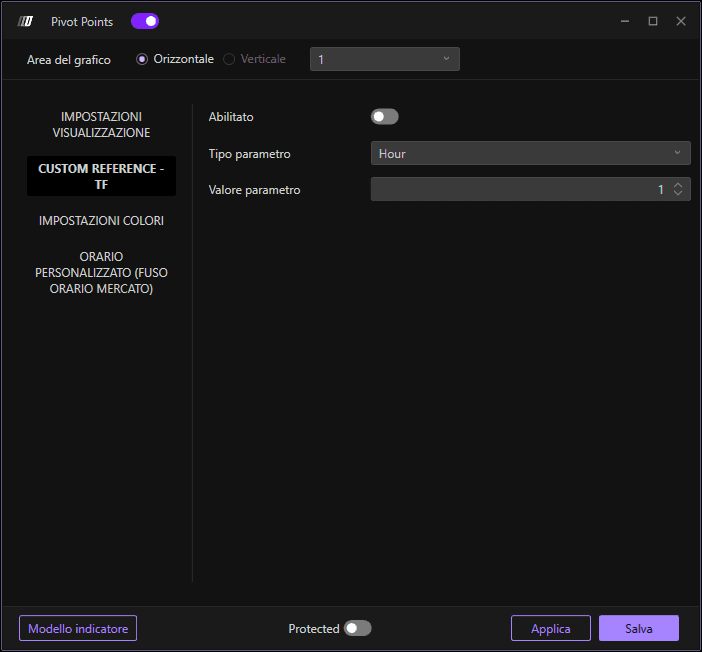
Imposta i parametri di riferimento personalizzato:
Abilita: Attiva o disattiva il riferimento personalizzato
Tipo parametro: Scegli il tipo di riferimento temporale
Valore parametro: Imposta il valore per il tipo di parametro selezionato
Impostazioni colore
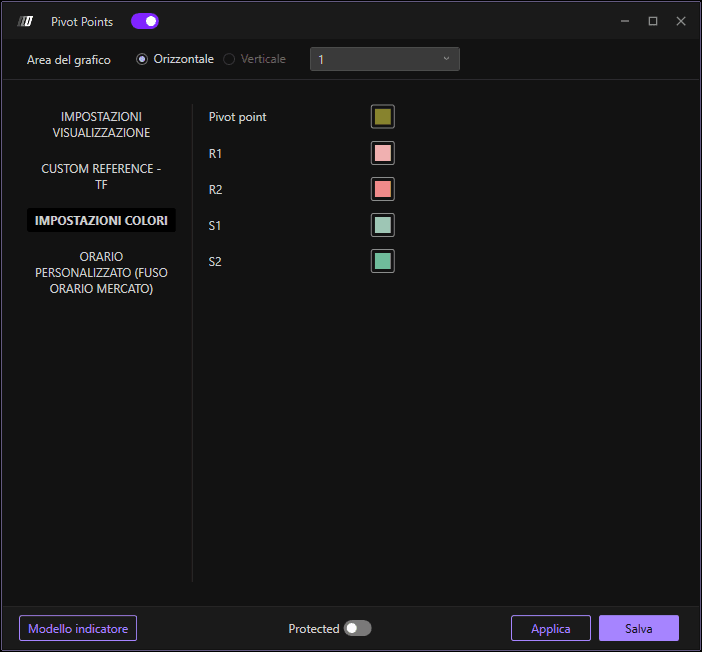
Personalizza i colori per ciascun livello pivot:
Colore Pivot Point: Colore per il Pivot Point principale
Colore R1: Colore per il primo livello di resistenza
Colore R2: Colore per il secondo livello di resistenza
Colore S1: Colore per il primo livello di supporto
Colore S2: Colore per il secondo livello di supporto
Orario personalizzato - Fuso orario del mercato
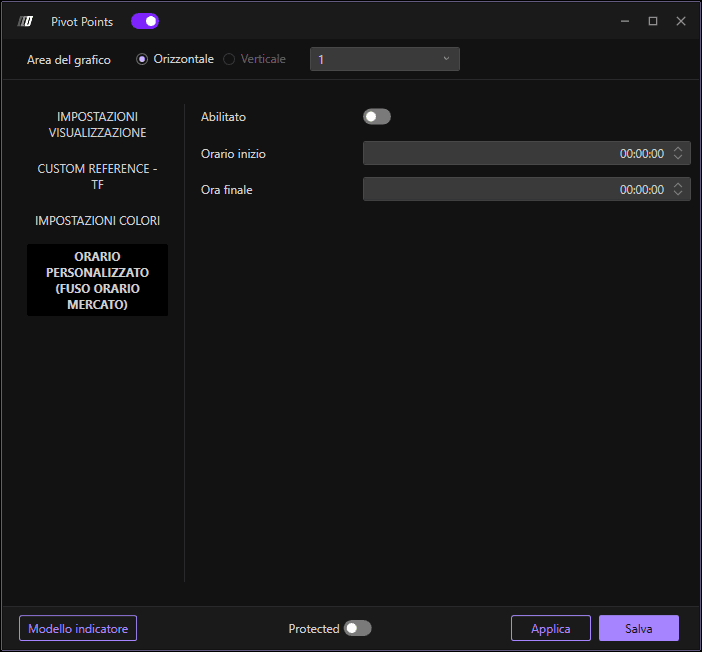
Imposta i parametri di orario personalizzato in base al fuso orario del mercato:
Abilita: Attiva o disattiva le impostazioni di orario personalizzato
Ora iniziale: Imposta l'orario di inizio del periodo (predefinito: 00:00:00)
Ora di fine: Imposta l'orario di fine del periodo (predefinito: 00:00:00)