Indicatori
Updated:
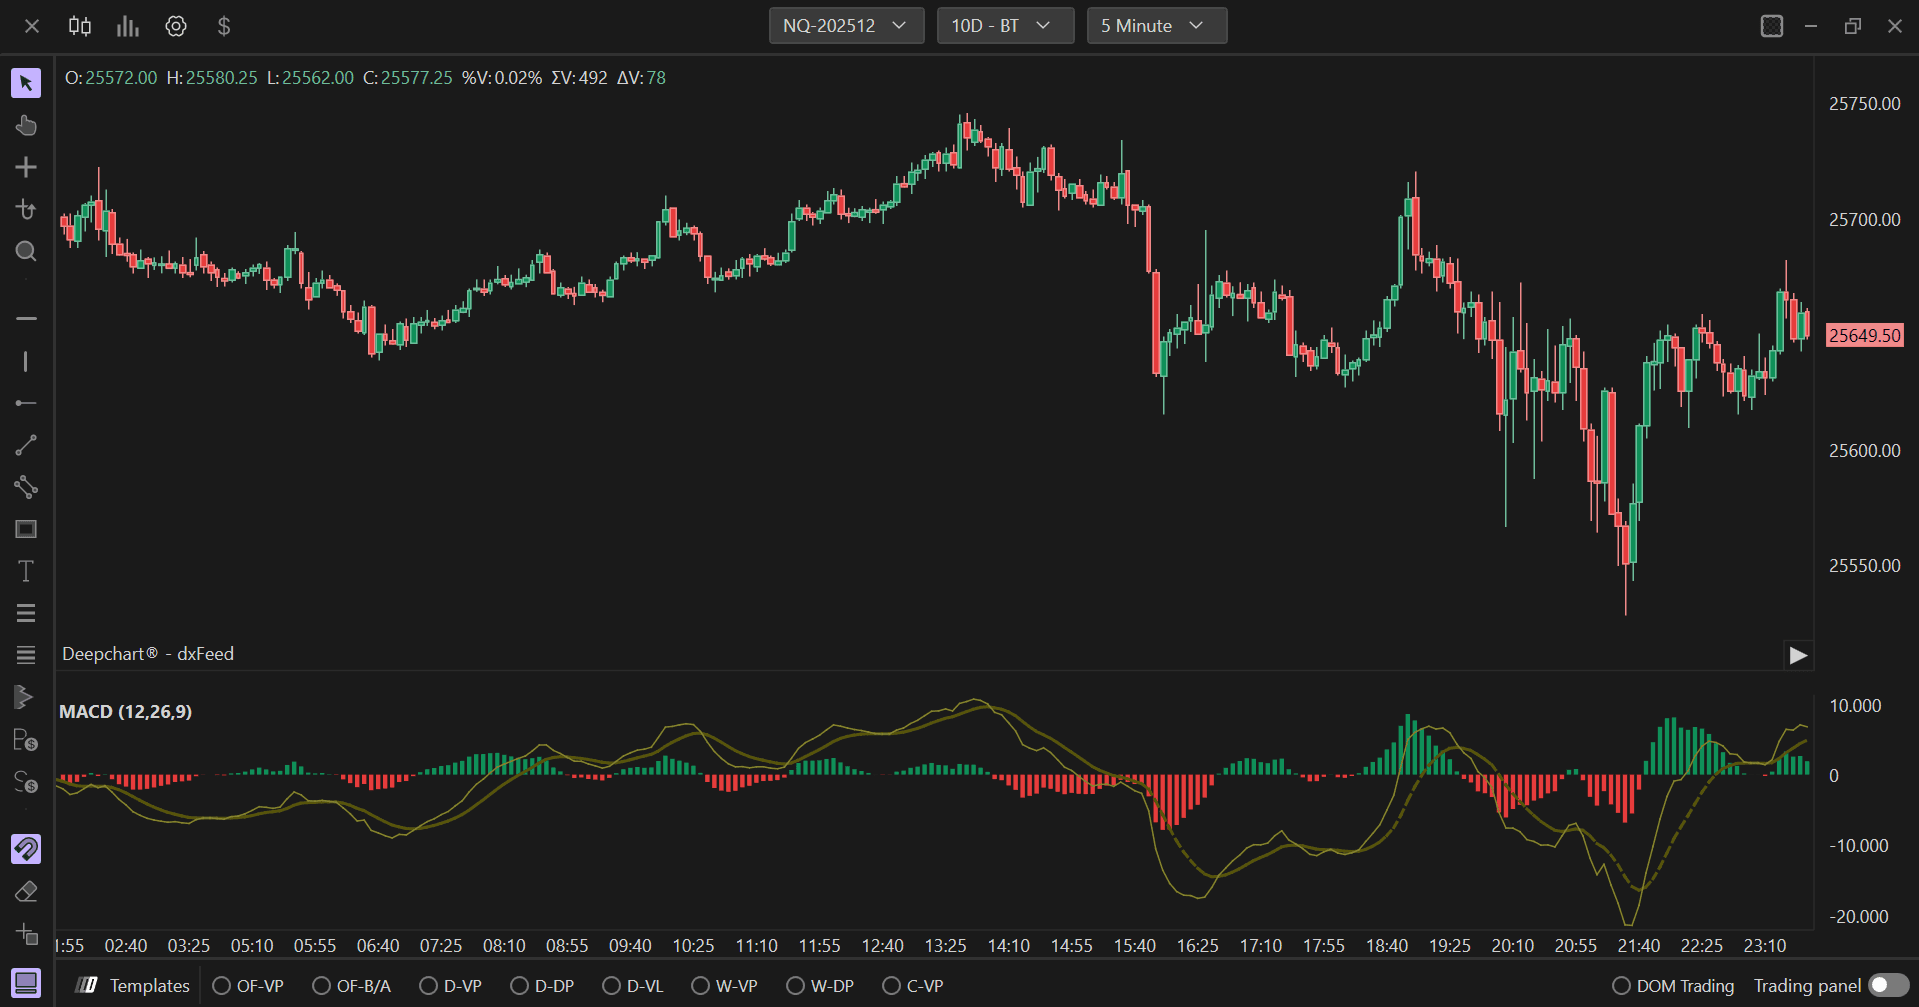
Il MACD (Convergenza/Divergenza delle Medie Mobili) è un indicatore di analisi tecnica usato per individuare i cambiamenti nel momentum e nella direzione del trend di un asset. È stato sviluppato da Gerald Appel negli anni '70 ed è uno degli strumenti più popolari per analizzare i mercati finanziari.
Utilizzo delle impostazioni
Facendo clic sull'icona delle impostazioni dell'indicatore si aprirà la relativa finestra di configurazione, all'interno della quale potrai effettuare diverse scelte riguardo al funzionamento dell'indicatore stesso.
Parametri
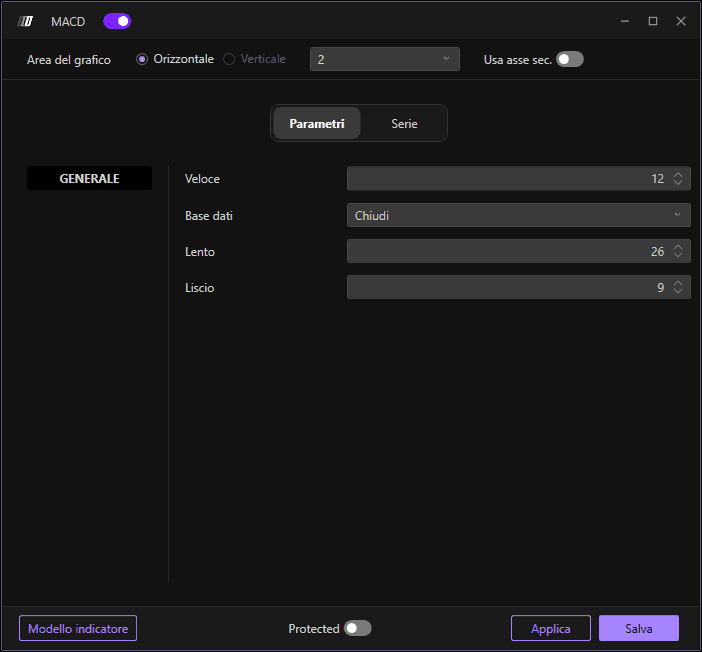
Nella sezione Parametri puoi modificare i parametri dell'indicatore:
Veloce: Il periodo della EMA veloce (predefinito: 12 periodi)
Lenta: Il periodo della EMA lenta (predefinito: 26 periodi)
Dati di input: I dati di prezzo da usare per il calcolo (Chiusura, Apertura, Massimo, Minimo e Volume)
Smussamento: Opzione di smussamento per la linea MACD
Sottografici
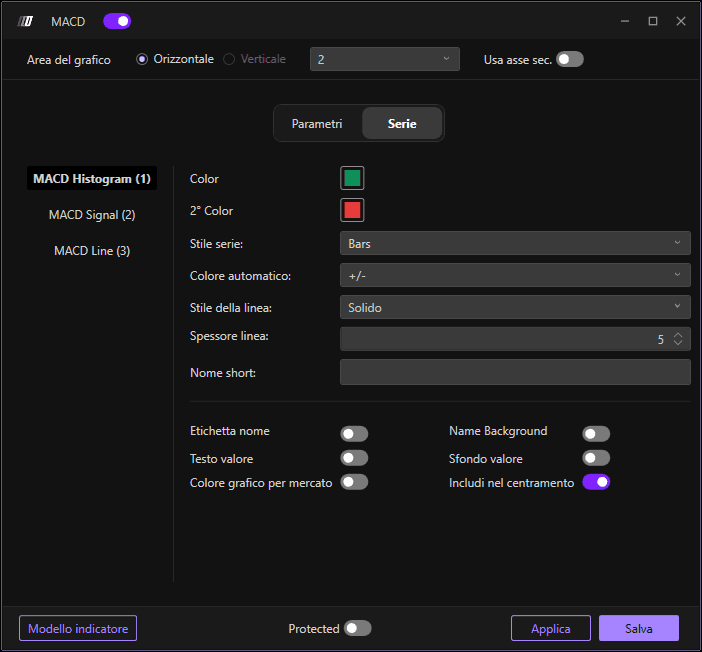
Nella sezione Sottografici, puoi impostare i colori e lo stile dell'istogramma, della linea di segnale e della linea dell'indicatore:
Colore istogramma MACD: Imposta il colore dell'istogramma
Colore segnale MACD: Imposta il colore della linea di segnale
Colore linea MACD: Imposta il colore della linea MACD
Colore secondario: Imposta un colore secondario opzionale
Stile del sottografico: Scegli lo stile di visualizzazione
Stile della linea: Definisci lo stile della linea
Spessore della linea: Definisci lo spessore delle linee
Usa asse secondario: Opzione per visualizzare su un asse secondario