Indicatori
Updated:
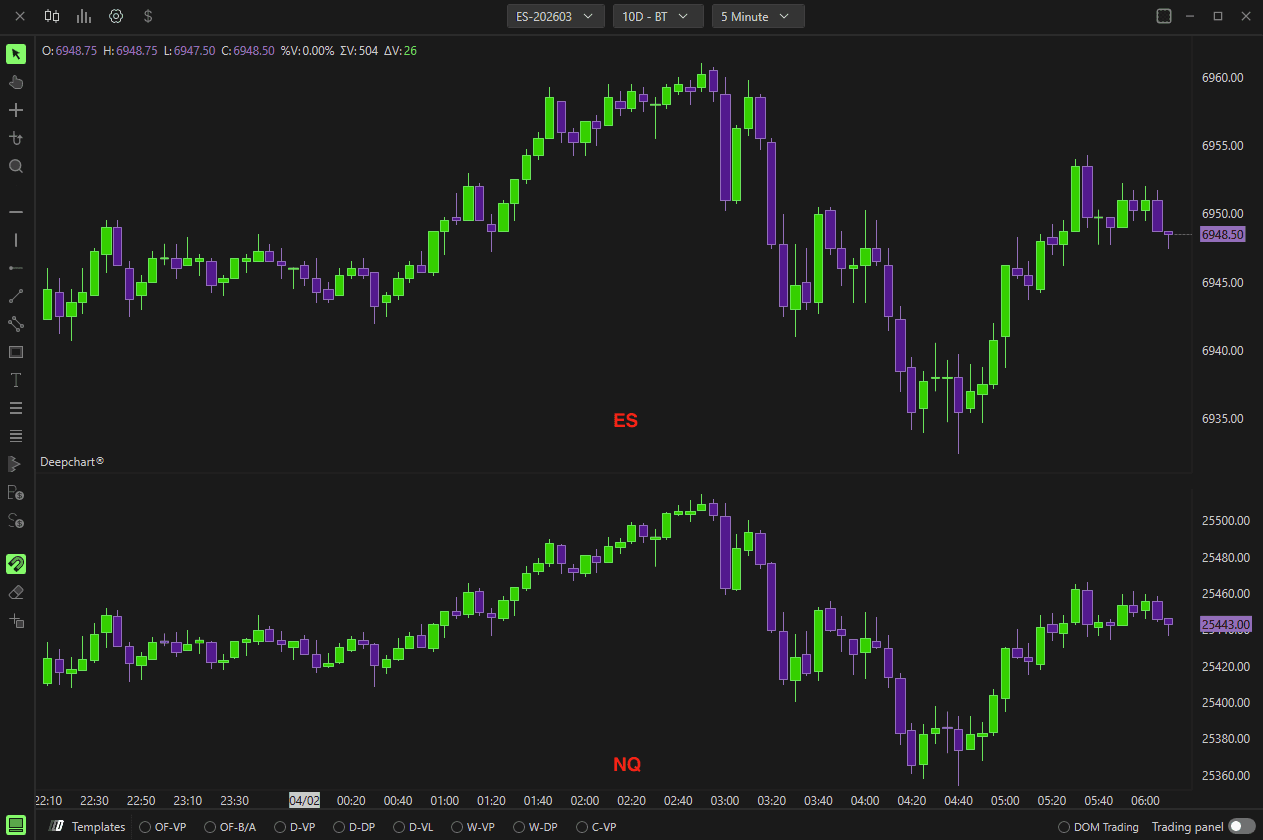
L'indicatore Deepcharts Overlay Symbol consente di visualizzare il grafico di un altro strumento finanziario sul grafico principale, permettendoti di monitorare più strumenti contemporaneamente. Questo può essere fatto creando un'area grafico secondaria oppure sovrapponendo i due grafici.
Il secondo grafico verrà impostato sullo stesso timeframe del grafico principale e, ogni volta che questo viene modificato, anche il timeframe del secondo grafico cambierà automaticamente.
Parametri
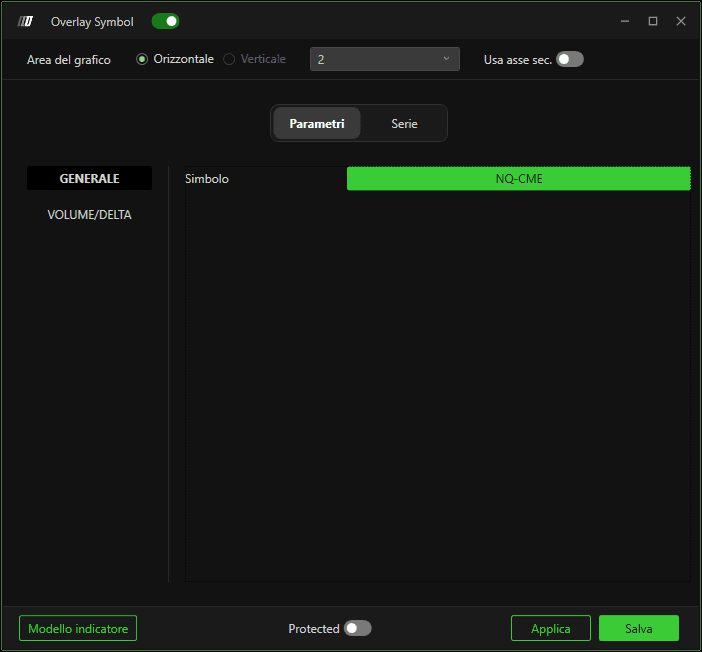
Generale
Facendo clic su Seleziona puoi selezionare il simbolo che desideri sovrapporre.
Volume/Delta
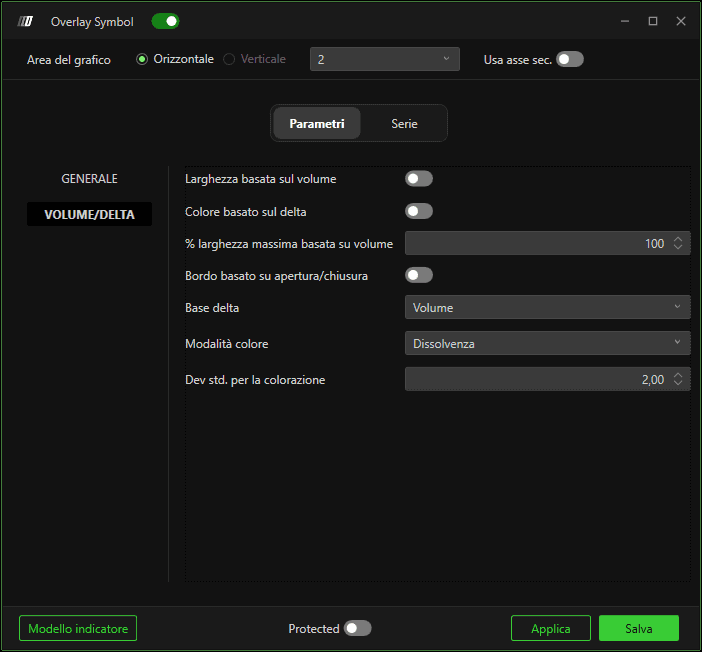
Larghezza basata sul volume
Se abilitata, la dimensione delle candele varierà in base al volume scambiato in ciascuna di esse.
Colore basato sul Delta
Se abilitata, il colore delle candele varierà in base al delta di ciascuna di esse.
% Larghezza massima basata sul volume
Definisce la percentuale massima di larghezza delle candele basate sul volume.
Bordo basato su apertura/chiusura
Se abilitata, il colore del bordo delle candele varierà in base al fatto che la candela sia rialzista o ribassista.
Input Delta
Definisce il database per il calcolo del delta, potendo scegliere tra Volume e Trades.
Modalità colore
Definisce come colorare le barre nel caso di colore basato sul delta, con l'opzione di scegliere tra sfumato e fisso.
Dev. std. per la colorazione
Definisce il valore della deviazione standard per la modalità sfumata.
Sottografico

Facendo clic sull'icona del sottografico in alto puoi cambiare il colore del bordo e del riempimento delle candele.
Cambia lo stile del grafico, scegliendo tra Line, Candlestick, OHLC, Hidden, Candlebody charts.
Cambia lo spessore del bordo.
Area del grafico
Se desideri sovrapporre i due grafici nell'area del grafico principale, seleziona l'area 1 del grafico nella parte superiore della finestra dell'indicatore, vedi la figura seguente.
Ricorda di abilitare l'opzione Usa asse secondario se la scala dei prezzi dei due strumenti è diversa.