Indicatori
Updated:
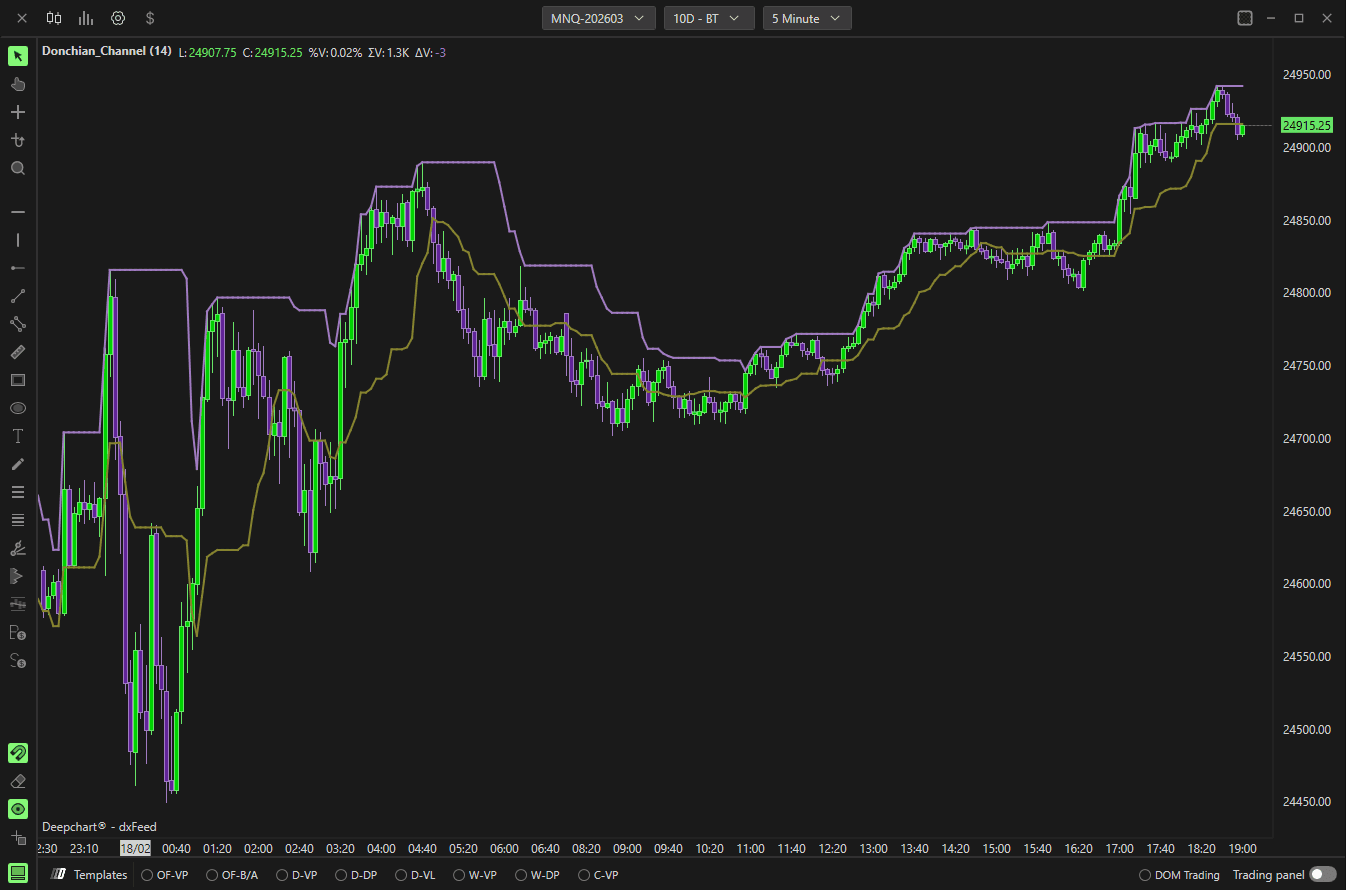
Il Canale Donchian traccia il massimo più alto e il minimo più basso su un numero selezionato di periodi.
Aiuta a identificare:
Rotture
Direzione del trend
Espansione della volatilità
Livelli di supporto e resistenza
Il canale è composto da:
Linea superiore – Massimo più alto del periodo di lookback
Linea inferiore – Minimo più basso del periodo di lookback
Utilizzo delle impostazioni
Parametri
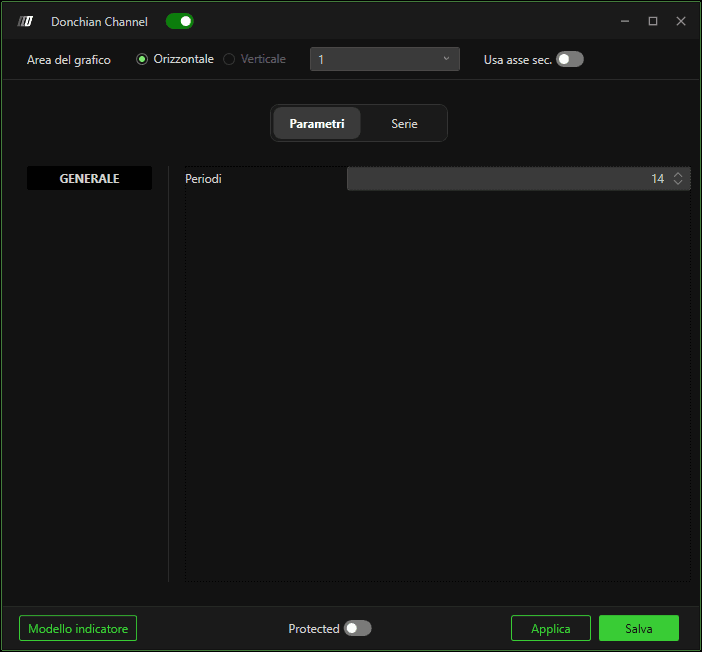
Lunghezza
Definisce quante barre passate vengono utilizzate per calcolare:
Il massimo più alto (Linea superiore)
Il minimo più basso (Linea inferiore)
Aumentare la lunghezza rende il canale più ampio e più lento a reagire.
Diminuire la lunghezza lo rende più sensibile alle variazioni recenti del prezzo.
Sottografici
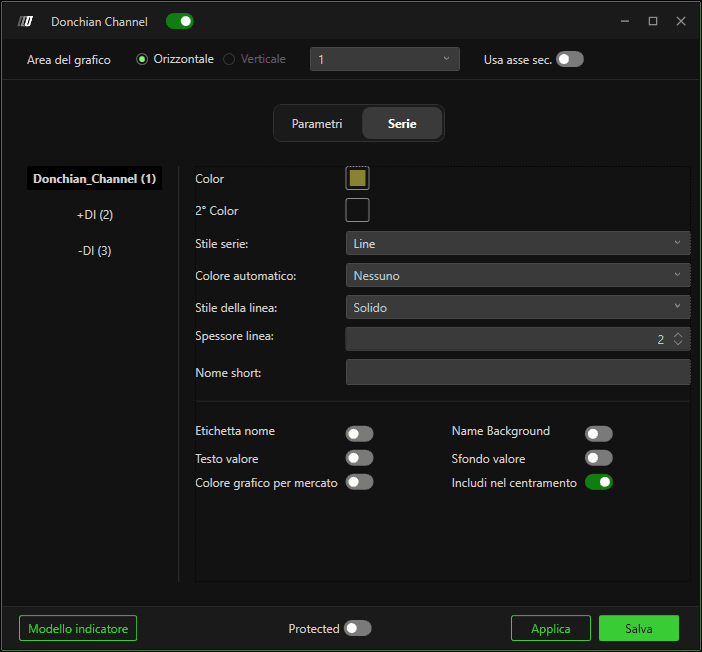
Donchian_Channel
Controlla lo stile visivo della struttura principale del canale.
Colore / 2° colore – Imposta i colori delle linee.
Stile del sottografico – Determina come viene disegnato il canale (stile della linea).
Colore automatico – Cambia automaticamente colore in base alla logica (se abilitato).
Stile linea – Continua, tratteggiata, ecc.
Spessore linea – Regola lo spessore.
Nome breve – Etichetta personalizzata visualizzata sul grafico.
+DI (Linea superiore)
Rappresenta il massimo più alto nel periodo selezionato.
-DI (Linea inferiore)
Rappresenta il minimo più basso nel periodo selezionato.
Opzioni di visualizzazione (tutti i sottografi)
Etichetta nome – Mostra il nome dell'indicatore sul grafico.
Etichetta valore – Mostra il valore corrente.
Sfondo nome – Sfondo dietro il nome.
Sfondo valore – Sfondo dietro il valore.
Includi in Auto Center – Include l'indicatore nei calcoli di autoscaling.
Colore del grafico per il marker – Usa il colore del grafico per gli elementi del marker.