Indicatori
Updated:
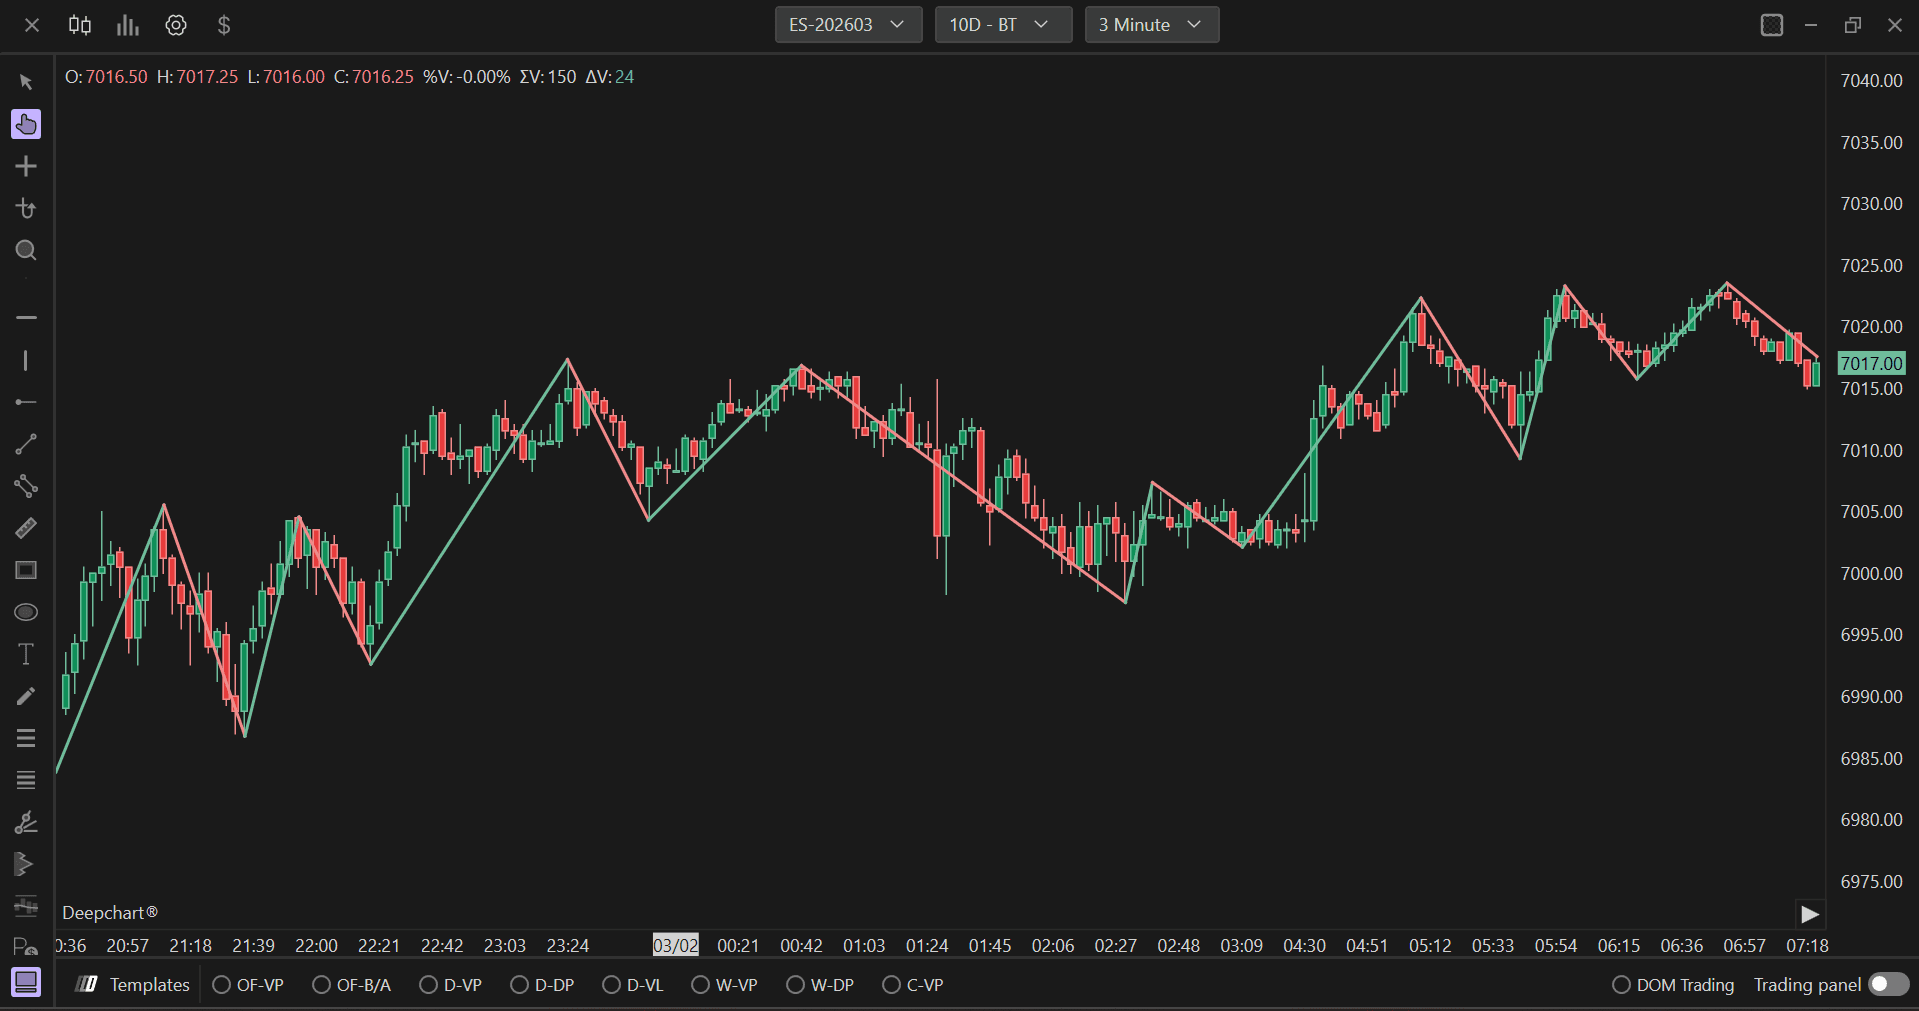
L'indicatore Zig Zag filtra i piccoli movimenti di prezzo e mette in evidenza le oscillazioni di prezzo significative collegando i massimi e i minimi di swing. Aiuta i trader a identificare le inversioni di trend, i livelli di supporto e resistenza e i principali pattern di prezzo eliminando il rumore di mercato. L'indicatore traccia linee rette tra i punti di pivot significativi, rendendo più facile visualizzare la direzione complessiva e la struttura dei movimenti di prezzo.
Impostazioni di utilizzo
Facendo clic sull'icona delle impostazioni dell'indicatore si aprirà la relativa finestra di configurazione, all'interno della quale sarà possibile effettuare diverse scelte riguardo alle funzionalità dell'indicatore stesso.
Impostazioni Zig Zag

Modalità Zig Zag
Definisce il metodo usato per identificare i punti di swing significativi. Le opzioni disponibili sono:
Massimo minimo: Identifica i punti di swing in base al massimo più alto e al minimo più basso all'interno di un intervallo specificato, utilizzando un approccio più tradizionale che considera i livelli di prezzo estremi in un dato periodo.
Inversione assoluta: Utilizza una variazione percentuale fissa del prezzo per determinare i punti di swing. Questo metodo richiede un movimento di prezzo percentuale specifico nella direzione opposta per confermare un nuovo swing.
Inversione tick: Utilizza un numero fisso di tick come soglia di inversione. Questo metodo è più adatto agli strumenti con dimensioni del tick specifiche e offre un'identificazione coerente degli swing indipendentemente dal livello di prezzo.
Zig Zag Inversione assoluta
Quando si utilizza la modalità Inversione Assoluta, questo parametro imposta la variazione percentuale minima del prezzo necessaria per identificare un nuovo punto di swing. Il valore predefinito è 0,50%. Valori più alti determinano swing meno frequenti ma più significativi filtrando i movimenti di prezzo più piccoli, mentre valori più bassi creano identificazioni di swing più frequenti che catturano variazioni di prezzo minori. Questa impostazione influisce direttamente su come l'indicatore bilancia la chiarezza del segnale e la reattività.
Zig Zag Inversione Tick/Massimo Minimo
Questo parametro a doppia funzione svolge ruoli diversi a seconda della modalità Zig Zag selezionata:
Per la modalità Inversione Tick: Definisce il numero di tick richiesti per un'inversione. Il valore predefinito è 10. Aumentare questo valore rende l'indicatore meno sensibile, identificando solo gli swing principali, mentre diminuirlo lo rende più reattivo ai movimenti di prezzo più piccoli.
Per la modalità Massimo Minimo: Imposta il periodo di lookback (numero di barre) utilizzato per identificare il massimo più alto e il minimo più basso. Questo determina l'intervallo su cui vengono valutati i livelli di prezzo estremi.
Colore su
Imposta il colore delle linee zigzag durante gli swing al rialzo (movimenti rialzisti).
Colore in discesa
Imposta il colore delle linee zigzag durante gli swing al ribasso (movimenti ribassisti).
Larghezza linea
Regola lo spessore delle linee zigzag visualizzate sul grafico. Il valore predefinito è 2. Aumentare questo valore rende le linee di swing più evidenti e facili da vedere, soprattutto quando si analizzano grafici su schermi più piccoli o quando si monitorano più indicatori. Diminuirlo crea linee più sottili e discrete che riducono il disordine visivo sui grafici più affollati.
Impostazioni di ritracciamento

Colore sfondo
Imposta il colore di sfondo per le etichette dei livelli di ritracciamento visualizzate sul grafico. Questo sfondo aiuta il testo a risaltare rispetto al grafico e migliora la leggibilità, soprattutto quando il grafico contiene un'azione di prezzo complessa o più elementi sovrapposti.
Dimensione carattere
Regola la dimensione del testo per le etichette dei livelli di ritracciamento. Il valore predefinito è 11,00. Dimensioni di carattere maggiori rendono le etichette più visibili e facili da leggere, particolarmente utile per le presentazioni o quando si monitorano i grafici da una certa distanza.
Colore carattere
Imposta il colore del testo per le etichette dei livelli di ritracciamento. Scegli un colore che offra un forte contrasto con il colore di sfondo per una leggibilità ottimale. Il colore dovrebbe essere facilmente visibile in diverse condizioni di illuminazione e su vari sfondi del grafico.
Larghezza linea
Regola lo spessore delle linee dei livelli di ritracciamento tracciate sul grafico. Il valore predefinito è 1. Linee più spesse rendono i livelli di ritracciamento più evidenti e facili da individuare, mentre linee più sottili creano un aspetto più discreto che non domina la visuale del grafico.
Colore linea
Imposta il colore delle linee dei livelli di ritracciamento. Questo colore dovrebbe essere distinto sia dai colori delle linee Zig Zag sia dagli elementi principali del grafico, per garantire che i livelli di ritracciamento siano chiaramente visibili e facilmente distinguibili dagli altri indicatori.
Mostra 38,2%
Quando abilitato, visualizza sul grafico il livello di ritracciamento Fibonacci del 38,2%. Questo è uno dei principali rapporti di Fibonacci, spesso usato per identificare potenziali aree di supporto o resistenza in cui il prezzo potrebbe invertirsi o consolidarsi durante un ritracciamento dello swing precedente.
Mostra 50%
Quando abilitato, visualizza sul grafico il livello di ritracciamento del 50%. Pur non essendo un vero rapporto di Fibonacci, il livello del 50% è ampiamente seguito dai trader perché rappresenta il punto medio di uno swing e spesso agisce come livello significativo di supporto o resistenza durante i ritracciamenti di prezzo.
Mostra 61,8%
Quando abilitato, visualizza il livello di ritracciamento Fibonacci del 61,8%, noto anche come "rapporto aureo". È considerato uno dei livelli di Fibonacci più significativi, e spesso funge da forte area di supporto o resistenza in cui il prezzo può invertirsi o trovare equilibrio durante un ritracciamento.
Mostra 75%
Quando abilitato, visualizza sul grafico il livello di ritracciamento del 75%. Questo livello rappresenta un ritracciamento più profondo e può indicare un movimento controtrend più forte. È utile per identificare potenziali zone di inversione quando il prezzo effettua un ritracciamento sostanziale dello swing precedente.
Estendi a destra
Quando abilitato, estende le linee dei livelli di ritracciamento fino al bordo destro del grafico, proiettandole nelle barre future. Questo rende più facile monitorare se il prezzo interagisce con questi livelli mentre si sviluppa in tempo reale, aiutando i trader ad anticipare potenziali zone di supporto o resistenza in anticipo.
Subgrafici

Colore
Imposta il colore principale per la linea Zig Zag.
2° Colore
Imposta l'opzione di colore secondario per la linea Zig Zag.
Stile subgrafico
Definisce come vengono visualizzati i dati Zig Zag. L'impostazione predefinita è "Ignora", che utilizza il metodo di disegno delle linee integrato nell'indicatore. Altre opzioni includono Barre, anche se per questo indicatore è generalmente preferibile la rappresentazione tradizionale dello Zig Zag.
Colore automatico
Determina la logica di colorazione automatica delle linee Zig Zag. Le opzioni includono:
+/-: Colora le linee in base alla direzione - gli swing al rialzo usano Colore su, gli swing al ribasso usano Colore in discesa, fornendo un feedback visivo immediato sulla direzione dello swing.
Barre: Può applicare la colorazione in base a un'analisi barra per barra.
Ignora: Disabilita la colorazione automatica, usando l'impostazione del colore principale per tutte le linee.
Stile linea
Imposta lo stile delle linee Zig Zag. Il valore predefinito è "Continuo" per linee continue e senza interruzioni che mostrano chiaramente i collegamenti tra gli swing. Altre opzioni includono pattern tratteggiati e puntinati, che possono aiutare a distinguere l'indicatore Zig Zag da altri elementi del grafico quando vengono visualizzati più indicatori.
Larghezza linea
Regola lo spessore della linea Zig Zag principale nelle impostazioni del subgrafico.
Nome breve
Consente di impostare un nome breve o un'etichetta personalizzata per l'indicatore che apparirà nella legenda del grafico.